


Abstract
Little is known about the effect of the COVID-19 pandemic on recreational fisheries compliance. Starting in 2015, we monitored recreational fishing activity in Rockfish Conservation Areas (RCAs) with trail cameras overlooking RCAs around Galiano Island, Canada. We also carried out in-person surveys with recreational fishers at marinas and docks to assess recreational fisher compliance with RCAs. Questions included asking fishers whether they had accidentally or intentionally fished inside RCAs with prohibited techniques in the past two years. The number of suspected or confirmed angling incidents that we observed on the trail cameras declined steadily from 2015 to 2019, and then increased significantly during the pandemic to the highest levels seen during our eight years of data collection. The number of fishers who admitted to intentionally or accidentally fishing in RCAs in the past two years with prohibited gears did not change during the pandemic, although there was an apparent but not statistically significant increase in the number of respondents who personally knew someone who intentionally fished in RCAs. Our study corroborates other research that showed a response of pandemic lockdowns on illegal activities. High non-compliance highlights the ongoing need for education, outreach, and increased enforcement.
Introduction
The COVID-19 pandemic is affecting fisheries (Bennett et al., 2020), including recreational fisheries. Recreational fishing is valuable for mental and physical well-being, and was seen as a safe activity during the pandemic (Howarth et al., 2021; Midway et al., 2021). In North America, 92% of jurisdictions kept recreational fishing open during the start of the pandemic (March–April 2020). Restrictions included residency requirements (non-residents excluded mostly due to border closures), cancellations of some competitive angling events, and closures or restricted operations of some fishing charters (Paradis et al., 2021). New recreational fishery entrants increased in many jurisdictions. For instance, there was an increase of 21% in Ontario, Canada (Howarth et al., 2021); a 20% increase in sales of mandatory angling licenses in Denmark (Gundelund and Skov, 2021); an increase in fishing trips in the USA (Midway et al., 2021); and increased fishing activity in Western Australia (Ryan et al., 2021). A decrease was seen in fishing charter trips in places where tourism was significantly reduced, such as the Canary Islands, and Spain (Guerra-Marrero et al., 2021). Another study from 15 countries showed a reduction in marine recreational fishing activity (Pita et al., 2021). While there has been mixed evidence on whether recreational fishing is increasing or decreasing, the pandemic simultaneously resulted in disruptions in data collection and monitoring (Link et al., 2021).
Little information exists in the published literature about whether and how compliance with recreational fisheries regulations might be affected by the COVID-19 pandemic. While the pandemic has resulted in devastating effects on individuals and communities (e.g. Salari et al., 2020), it presents an opportunity to investigate changes in recreational fisher compliance. Compliance is essential for conservation measures to be successful, especially for spatial conservation areas (Arias et al., 2015; Bergseth et al., 2015; Bergseth et al., 2017; Iacarella et al., 2021). Given the increase in recreational fishing by local anglers in many locations (Gundelund and Skov, 2021; Howarth et al., 2021; Midway et al., 2021; Ryan et al., 2021), understanding whether and how compliance has been affected could help to inform monitoring and enforcement efforts. Several predictions seem plausible. There could be an increase in compliance if most fishers are local, and hence more likely to know the local rules. Alternatively, compliance might decrease if new entrants do not know the rules, or local fishers are less motivated to comply, and know when and where to avoid enforcement.
The purpose of this study was to assess changes in recreational fisher compliance during the COVID-19 pandemic, and to describe how the pandemic affected our community–academic partnership. Our focus was on Rockfish Conservation Areas (RCAs) around Galiano Island, British Columbia (BC), Canada (Figure 1). Rockfish (Sebastes spp.) have been a focus of sport fishing since the 1980s despite growing conservation concerns, and are also caught incidentally when targeting other species such as lingcod (Ophiodon elongatus) or salmon (Oncorhynchus spp.) (Beamish and McFarlane, 2014). RCAs were implemented along the coast of BC to protect and recover populations of rockfish, especially inshore rockfish (Yamanaka and Logan, 2010). Permitted recreational fishing activities within RCAs are invertebrates by hand picking or diving; crab by trap; shrimp/prawn by trap; and smelt by gillnet (Fisheries and Oceans Canada, 2005). Indigenous fishers are allowed to practice their constitutional right to fish for food, social, and ceremonial purposes within RCAs (Fisheries and Oceans Canada, 2005). We synthesized past non-compliance within RCAs around Galiano Island in Ban et al. (2020). Suspected illegal fishing incidents—mainly the use of hook-and-line gear—within RCAs declined from 42% of days monitored through trail cameras in 2014 to 14% in 2018 (Ban et al., 2020). Here, we extend the timeline through to 2021 to assess the potential effects of the pandemic on non-compliance.
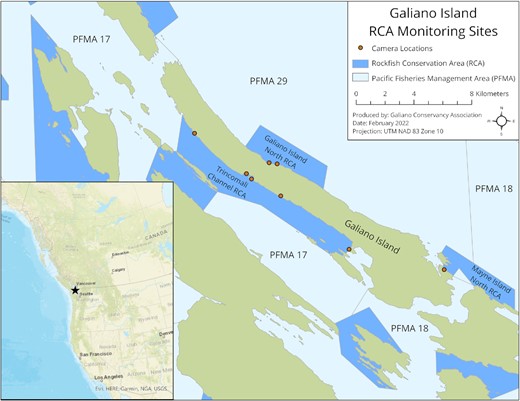
Map of the study region. Rockfish Conservation Areas labelled on the map were monitored with trail cameras (red circles). The numbered polygons in the water are Pacific Fisheries Management Areas (PFMA).
Methods
Background
This project is a partnership that started in 2014 between the Galiano Conservancy Association (GCA) and researchers at the University of Victoria’s School of Environmental Studies, with other partners subsequently joining. The main goal of our partnership is to carry out outreach and education (led by GCA), and measure the effectiveness of the outreach through surveys of recreational fishers and trail camera monitoring of recreational fishing activity within RCAs. We reported on our activities and data in Ban et al. (2020), and provide insights about changes that occurred during the pandemic in this update.
The COVID-19 pandemic started in BC in March 2020. One key restriction that affected recreational fisheries was the closure of the American–Canadian land and sea border from 21 March 2020 until 9 August 2021; subsequent COVID-19 testing requirements (still in effect at the time of writing) made travel to Canada and back to the United States much more complex. The Salish Sea, where Galiano Island is located, is a popular fishing destination for American boaters and other international visitors. Travel within Canada was also discouraged for much of 2020, and the summers of 2020 and 2021 thus had predominantly local recreational fishing activity. Recreational fishing continued as a popular activity during the pandemic, although effort did not seem as high as in some pre-pandemic years (Figure 2). We thus had data from a natural experiment in which the COVID-19 pandemic affected participation in the recreational fishery.
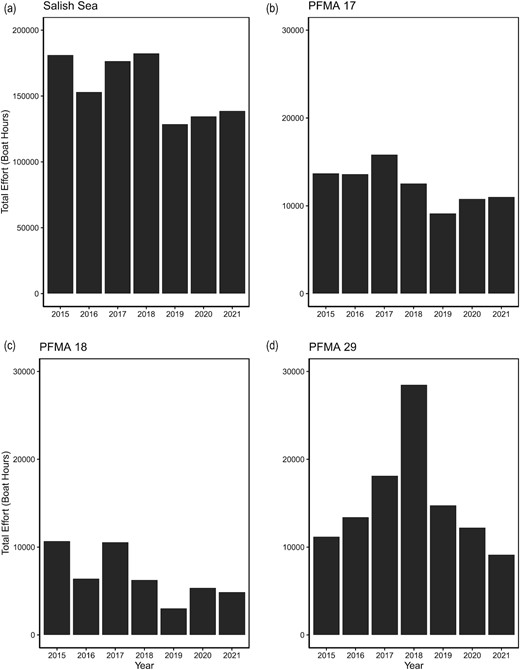
Recreational effort (boat hours) in (a) the whole Canadian Salish Sea, and the three main fishing areas around Galiano Island: (b) Pacific Fisheries Management Area (PFMA) 17, (c) 18, and (d) 29, as collected during creel surveys by Fisheries and Oceans Canada. COVID-19 restrictions were in place in 2020 and 2021.
Outreach and education
We developed a three-pronged outreach and education strategy, led by the GCA and Valdes Island Conservancy: (1) develop and distribute posters, maps, and signs about the location and rules related to RCAs; (2) in-person engagement at community events; and (3) other outreach. We describe details of these pre-pandemic activities in Ban et al. (2020). Briefly, we created and distributed RCA posters, signs, and newsletters. We also designed 46 permanent metal signs that display a map specific to each location with nearby RCA boundaries and rules, and installed them at marinas, boat launches, ferry terminals, and docks around Galiano Island and the Canadian southern Salish Sea. We attended various community events in person to educate interested members of the public about RCAs, and engaged in broader outreach (e.g. social media, articles in local newspapers). We were unable to continue the in-person activities when the pandemic began. Public events were cancelled, and social distancing rules made public engagement infeasible. The only public event we were able to attend regularly from August 2020 to September 2021 was the weekly public market on Galiano Island. We increased social media engagement during the pandemic, and participated in a few virtual events. It was, however, much harder to reach visitors to Galiano Island through virtual events because there is no centralized way to reach that target audience.
Camera monitoring of non-compliance in RCAs
We continued to assess changes in compliance on the water in RCAs. Lancaster et al. (2017) innovated a method of using land-based trail cameras to monitor RCA locations, and we continued to follow those protocols (Ban et al., 2020). We continued monitoring with six (2015–2018) or eight (2019–2021) Bushnell HD Trail Cameras overlooking RCAs around Galiano Island, located to maximize ocean coverage of RCAs. The exact locations shifted minimally year-to-year (a few to tens of meters) based on landholder permissions and local conditions. Cameras took pictures every 5 min during daylight hours. We labelled vessels that appeared in three consecutive frames or more, or with clearly identifiable fishing equipment, as “suspected angling”. When we could see fishing activity (i.e. visible use of hook-and-line gear in the picture) we labelled those events as “confirmed angling”. We then calculated the % of suspected and confirmed angling incidents, normalized to show the rate per 100 d monitored. We calculated odds ratios, with 95% confidence intervals, to ascertain whether there was a significant change prior to (2019) and during (2021) the pandemic. We used the fmsb package (version 0.7.2) (Nakazawa, 2022) in R (version 4.0.5) (R Core Team, 2021) to compute these statistics. Odds ratios are appropriate for dichotomous data (e.g. incidents of compliance versus non-compliance) (Vaske, 2002), and have been used in studies about fisheries compliance (e.g. Ryan et al., 2021) with similar sample sizes (e.g. Page and Radomski, 2006; Ban et al., 2020). We focused on 2019 as the pre-pandemic baseline because it was our most recent pre-pandemic data collection, and followed several years of improving compliance (Ban et al., 2020). Odds ratios below 1.0 indicate less non-compliance in 2021 compared to 2019 (i.e. fewer incidents of suspected non-compliance); CI that encompass 1.0 indicate no significant responses. We also repeated the odds ratio analysis with the sum of all pre-pandemic years of data (2015–2019) and both pandemic years (2020–2021).
Recreational fisher surveys
We used the survey developed by Lancaster et al. (2015) and subsequently adapted by Ban et al. (2020) to assess recreational fisher knowledge and compliance with RCAs. Every year, we used the same sampling approach for which we included data in our analysis. We conducted the in-person surveys on Galiano Island in 2015 (n = 25), 2017 (n = 31), 2018 (n = 30), 2019 (n = 30), and 2021 (n = 30) during July and August, the busiest times of the year for recreational fishing activity in the region. We carried out surveys at the boat ramp and fuel dock on Galiano Island in Montague Harbour. This is the busiest location for boaters on the island, and a popular anchorage and tourist spot. We approached potential participants in person, briefly explained the purpose of the survey, and asked if they were fishers. We invited all self-identified fishers to participate in our ∼5-min survey. Many visitors are pleasure boaters and sailors who are not fishing, so reaching the annual sample size of about 30 participants took many hours at this location. A notice of implied consent, printed at the top of the surveys, was shown to all participants (University of Victoria Ethics Protocol Number 14–142).
Questions included asking fishers if they felt confident of RCA boundary locations, and whether they had accidentally or intentionally fished inside RCAs with prohibited techniques in the past two years. We used direct questions to ask participants about non-compliance. We previously compared this direct questioning to using the randomized response technique, which is aimed at obtaining more honest answers by assuring respondent anonymity (Lancaster et al., 2015). We found that respondents in this region were comfortable talking about non-compliance, including their own intentional non-compliance, and that many participants found the randomized response technique confusing (Lancaster et al., 2015). We again used odds ratios to gauge whether responses changed before (2019) and during (2021) the pandemic, as well as the sum for all pre-pandemic and pandemic data (although the latter ignores the pre-pandemic declining trend), focusing on questions related to compliance (i.e. whether they had accidentally or intentionally fished inside RCAs with prohibited techniques, or know anyone who did). We applied the Haldane-Anscombe correction when there was at least one zero cell (i.e. added 0.5 to all cells) (Lawson, 2004). We did not carry out in-person surveys during most of the summer of 2020 because of pandemic restrictions, and efforts to reach recreational fishers visiting Galiano Island by putting printed surveys at the main dock for fishers were largely unsuccessful and potentially biased towards a different sample than those who might participate in in-person surveys. We obtained permission to carry out some in-person activities in August 2020, but were unable to survey sufficient respondents for analysis (n = 14). We excluded data from 2016 because we attempted online data collection that year, but were unable to obtain a sample equivalent to in-person surveys (see Ban et al., 2020 for details).
Results
The number of suspected or confirmed angling incidents that we observed on the trail cameras declined steadily from 2015 to 2019 (see Ban et al., 2020 for analysis of results to 2018), and then increased significantly during the pandemic to the highest levels seen during our eight years of data collection (Figure 3, Supplementary Table S1). There was a significant difference in non-compliance when comparing the most recent pandemic year (2021) to the pre-pandemic year (2019) (OR 19.23, 95% CI 11.51–32.13, p < 0.001). All of the sites monitored had higher non-compliance in 2021 than 2019 (Table 1), although there was variability at sites monitored through the years. The patterns were the same if we compared sites that had data for all years (Table 2: Cable Bay, Crystal Cove, Montague Harbour, Retreat Island) to all data. There was also a significant difference in non-compliance when comparing the sums of all pre-pandemic years (2015–2019) and all pandemic years (2020–2021) (OR 3.52, 95% CI 2.97–4.19, p < 0.001).
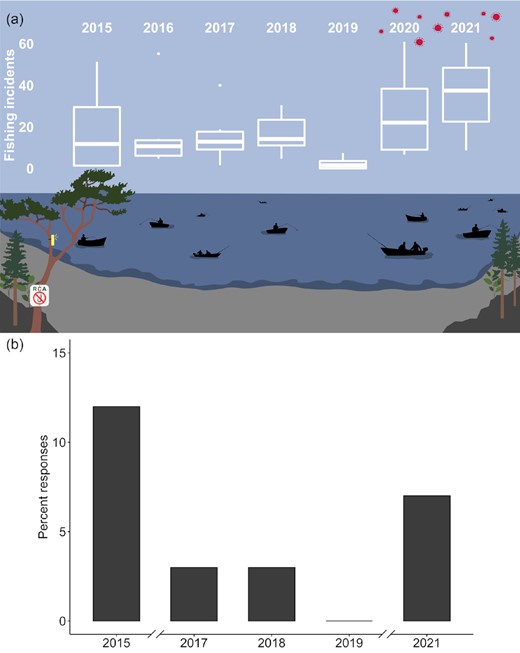
Results of trail camera monitoring of RCAs around Galiano Island during peak fishing season from 2015 to 2021, depicting (a) the number of suspected or confirmed angling incidents per 100 d of monitoring data, and (b) survey responses showing the proportion of respondents who personally know someone who intentionally fished illegally in RCAs in the past two years. The water in the infographic is a RCA, the boats illustrate approximate suspected non-compliance seen each year, and the red virus particles depict pandemic years. See Supplementary Table S1 for the camera data, and Table 2 for the survey data. Survey data was not available for 2016 and 2020.
The number of suspected or confirmed angling incidents per 100 monitoring days in RCAs around Galiano Island during peak fishing season by year and monitoring site.
| Year | Trincomali | Cable bay | Cain beach | Chrystal cove | Montague harbour | Pebble beach | Retreat cove | Retreat island |
|---|---|---|---|---|---|---|---|---|
| 2015 | – | 1.4 | – | 51.4 | 1.4 | – | – | 22.2 |
| 2016 | 4.9 | 4.8 | 55.2 | 14.2 | 9.8 | – | – | 11.7 |
| 2017 | – | 8.3 | 1.5 | 18.8 | 40.0 | – | 14.3 | 11.5 |
| 2018 | – | 14.1 | 26.5 | 14.2 | 30.4 | – | 4.7 | 10.0 |
| 2019 | 1.6 | 4.3 | 0 | 1.4 | 0 | 7.4 | 0 | 3.4 |
| 2020 | 9.2 | 6.6 | 60.9 | 31.3 | 29.7 | 8.3 | 14.4 | 59.6 |
| 2021 | 8.7 | 30.6 | 60.4 | 44.4 | 46.6 | 17.2 | 24.3 | 53.9 |
Sites without results were not monitored that year.
Responses from structured surveys (percentage of respondents) with recreational fishers around Galiano Island during peak fishing season during 2015 (n = 25), 2017 (n = 31), 2018 (n = 30), 2019 (n = 30), and 2021 (n = 30).
| Participants who… | 2015 (%) | 2017 (%) | 2018 (%) | 2019 (%) | 2021 (%) |
|---|---|---|---|---|---|
| Had heard of RCAs at the beginning of the survey | 80 | 97 | 90 | 90 | 93 |
| Had seen GCA rockfish outreach materials | 24 | 52 | 67 | 67 | 39 |
| Correctly identified legal rockfish catch per day in the Salish Sea | 60 | 35 | 30 | 17 | 13 |
| Responded with recreational fishing activities not permitted in RCAs | 68 | 58 | 37 | 37 | 27 |
| Were confident in their knowledge of RCA boundaries in the places they like to fish | 32 | 42 | 67 | 67 | 73 |
| Intentionally fished illegally in RCAs in the past 2 years | 12 | 3 | 3 | 0 | 0 |
| Accidentally fished illegally in RCAs in the past 2 years | 27 | 35 | 3 | 0 | 0 |
| Personally knows someone who intentionally fished illegally in RCAs in the past 2 years | 12 | 3 | 3 | 0 | 7 |
| Identified public education and outreach as effective tools for improving rockfish conservation | 32 | 35 | 50 | 35 | 23 |
| Identified lack of awareness as a primary reason for fishers to fish in RCAs | 76 | 45 | 80 | 53 | 47 |
| Released an accidentally caught rockfish using a purpose-built descender device 51–100% of the time | 0 | 6 | 10 | 7 | 27 |
Survey data did not consistently indicate the same increase in non-compliance as seen through the camera data for the questions of whether participants had intentionally or accidentally fished in RCAs. Responses from surveys with recreational fishers indicated that there was no association in the proportion of fishers who admitted to intentionally or accidentally fishing in RCAs with prohibited gear prior to and during the pandemic (OR 1, 95% CI 0.02–52, p = 1). Instead, those proportions were the lowest in the time series to date for both 2019 and 2021 (Table 2). The results were similar when we combined all pre-pandemic data for intentional non-compliance (OR 0.33, 95% CI 0.02–6.18, p = 0.440), although admitting to accidentally fishing inside RCAs was more likely to occur pre-pandemic (OR 0.08, 95% CI 0.005–1.39, p-value = 0.029). There was no significant increase in the number of respondents who personally knew someone who intentionally fished in RCAs with prohibited gears in the past two years (OR 5.35, 95% CI 0.25–116.31, p = 0.240), nor when including all pre-pandemic data (OR 1.66, 95% CI 0.31–9.00, p = 0.556).
Awareness of RCAs increased from 80% in 2015 to 93% in 2021, although it decreased from its peak in 2017 (97%). However, many participants still did not know many of the rules. For example, the proportions of participants that correctly identified legal rockfish catch per day in the Salish Sea decreased from 60% in 2015 to 13% in 2021, and identified recreational fishing activities not permitted in RCAs decreased from 68 to 27%.
Most survey respondents were from the Greater Vancouver area, except in 2018, when we surveyed many international visitors (Figure 4, Supplementary Table S2). During the pandemic (2021), an even larger proportion of survey respondents came from the Greater Vancouver area. Other places of residence (e.g. Gulf Islands, Greater Victoria) were variable throughout the survey years.
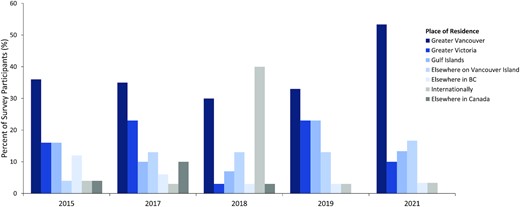
Survey participants’ places of residence shown as a percentage of the sample from 2015 (n = 25), 2017 (n = 31), 2018 (n = 30), 2019 (n = 30), and 2021 (n = 30).
Fewer respondents had seen RCA outreach materials during the pandemic (39%) compared to 2019 (67%) (Table 2); this is unsurprising because very little in-person outreach could occur during this time. Indeed, whereas we reached an estimated 920 people through outreach activities in 2019, we only reached 57 and 47 in 2020 and 2021, respectively.
Discussion
Our study corroborates other research that showed increases in illegal activities, including fishing, in response to pandemic lockdowns (Bates et al., 2021). We saw an increase in non-compliance within Rockfish Conservation Areas (RCAs) compared to pre-pandemic levels in our study area around Galiano Island, Canada. The COVID-19 pandemic has impacted people worldwide, and has changed how human activities and actions—including those related to recreational fisheries—have affected the environment (Bates et al., 2021; Gundelund and Skov, 2021; Howarth et al., 2021). A global review of the immediate responses to pandemic lockdowns indicated a mix of positive and negative effects on nature, including an increase in illegal activities (Bates et al., 2021).
The reasons for the increase in non-compliance in our study region are unclear. Other regions such as Denmark (Gundelund and Skov, 2021), Ontario (Howarth et al., 2021), and the United States (Midway et al., 2021) saw an increase in recreational fishing effort and new entrants. In our study region, creel surveys did not similarly indicate an increase in effort, with fishing areas around Galiano Island showing fairly consistent effort throughout this time. With the US border closed and effort stable, it is possible that there were quite a few new local recreational fishers, but we do not have data to confirm this hypothesis. New entrants may be less aware of the rules and therefore more likely to inadvertently fish with illegal gear inside RCAs. It is also possible that existing anglers might be reacting to a perceived reduction in enforcement by deliberately engaging in illegal fishing inside RCAs. Additionally, the lack of active outreach and education activities during the pandemic, compared to pre-pandemic efforts, may have influenced non-compliance, as awareness of RCAs, their locations, and illegal fishing gear might be reduced. If this was the case, then it highlights the importance of education—a component that is consistently called for by survey respondents (Ban et al., 2020), and that virtual events were not as effective as in-person engagement. Without further information about motivations for illegal fishing, we are unable to determine the extent to which these or other factors contributed to the increase in non-compliance. Future studies could explore the impact of residence and education on awareness of RCAs and non-compliance.
Another potential explanation for seeing increased fishing inside RCAs is that there was an increase in legal First Nations fishing for food, social, or ceremonial purposes inside RCAs, since these activities cannot be distinguished by our trail cameras from illegal RCA fishing by non-Indigenous people. Future research could be led by, or co-created by, Indigenous peoples to investigate any changes in their legal fishing inside RCAs through time.
In our pre-pandemic data, non-compliance as gauged through trail cameras and survey responses by recreational fishers showed similar trends for two survey questions: accidental or intentional fishing in RCAs (Ban et al., 2020). Our pandemic data, however, maintained pre-pandemic low responses for accidental or intentional fishing in RCAs, while trail camera data increased sharply. We do not know why this notable divergence from previous trends occurred, although the relatively small sample sizes of our annual surveys with fishers (∼30 per year) might not have enough statistical power to detect changes. Our trail camera data had robust sample sizes (ranging from 284 d monitored in 2015 to 841 in 2021), so we are confident that the significant difference between pre- and during-pandemic non-compliance was well-supported. We observed a similar increase in respondents who knew others who fished illegally in RCAs, but the trend was not significant—probably owing to small samples sizes (∼30 respondents/year).
In previous work (Lancaster et al., 2015), we also used the randomized response technique (Arias and Sutton, 2013), which allows respondents to answer sensitive questions while maintaining anonymity. However, many respondents found the technique confusing, and seemed willing to answer sensitive questions directly. Similar to Arias and Sutton (2013), our pandemic findings indicate that the question of whether participants knew anyone who had fished illegally in RCAs is more consistent with the trail camera data (although not statistically significant) than asking respondents to incriminate themselves by asking if they had fished illegally in RCAs themselves, intentionally or accidentally.
The effect that this non-compliance is having on rockfish is also currently unclear as we do not have catch or underwater monitoring data in our study region. Other studies have shown a mixed effect of the pandemic on wildlife. For example, a global review points to decreases in anthropogenic ocean noise and declines in commercial fishing as potential positive effects for wildlife, but increased illegal activities and human–wildlife conflict as negative effects (Bates et al., 2021). Increased non-compliance in our study region is likely to also increase rockfish mortality rates, even if fishers are targeting other species such as salmon and catching rockfish as bycatch. Most rockfish species are long-lived with limited home ranges, and thus are highly susceptible to localized overfishing (Haggarty et al., 2016). In addition, rockfish are prone to experiencing symptoms of barotrauma (injuries caused by the rapid change in pressure during capture), which contributes to high post-release mortality and overfishing (Haggarty, 2019). In 2019, the use of a descending device became mandatory when releasing rockfish that cannot be retained. While this requirement has led to improved rockfish survival, we found that only about one quarter of recreational fishers reported that accidentally caught rockfish were released with a descending device. Consequently, there may be multiple aspects of non-compliance influencing rockfish populations. Further monitoring of rockfish is needed in order to understand the effects of this shift in non-compliance on these valuable and vulnerable species.
High non-compliance highlights the ongoing need for education and outreach. Prior to the pandemic, the Galiano Conservancy Association had an extensive education and outreach campaign that reached hundreds of people each year (Ban et al., 2020). Despite efforts to host online events and increase social media sharing, there is no channel of communication to reach non-local recreational fishers who are visiting marine waters around Galiano Island, and this will continue to be a challenge into the future. As pandemic restrictions are lifted and in-person interactions are possible again, a renewed effort to reach recreational fishers at the docks and marinas might reduce non-compliance. Organizations on neighboring islands have also indicated an interest in similar monitoring and outreach efforts as those spearheaded by the partnership between the Galiano Conservancy Association and University of Victoria on Galiano Island. Recreational fishers have also called for a need to increase enforcement to discourage illegal fishing, and to develop an app that would make it easier for them to recognize RCA boundaries (Ban et al., 2020). Reducing non-compliance is urgent because, without compliance, RCAs are unlikely to be able to meet their objective of rebuilding rockfish populations (Haggarty et al., 2016).
Continuing research is also important for understanding and addressing non-compliance. In addition to continuing our trail camera and survey data collection, we have partnered with Angler’s Atlas, a company whose mission is “to create a resource centre for online anglers by providing detailed maps and related local content to our members” (Angler’s Atlas 2022, Goldstream Publishing Incorporated, https://www.anglersatlas.com/about-us, last accessed 25 July 2022), and where membership is free. They have expanded the capability of their app, MyCatch (Angler’s Atlas 2022, Goldstream Publishing Incorporate, https://mycatch.ca/, last accessed 25 July 2022), to include RCA boundaries and rules, and are working to create a notification system that will let users know when they have crossed into a RCA. Monitoring, such as our trail cameras and survey, and the MyCatch and other apps, can help to inform efforts by DFO to examine the efficacy of RCAs at a regional and individual scale (e.g. Dunham et al., 2020; Thornborough et al., 2020). Partnerships such as ours have shown the value of coupling outreach and education with research. Without our monitoring efforts since 2015, we would not have known that compliance had increased substantially, only to decrease again during the pandemic. Our expanded partnership now includes Angler’s Atlas, ecological researchers at the University of Victoria and DFO, and expertize in analysing app data (Ball State University). We are hopeful that future research, education and outreach, ongoing monitoring including our trail cameras and surveys, and the new MyCatch and other apps, ideally coupled with an increase in enforcement, can increase compliance again so that rockfish populations are able to recover.
Data availability statement
The data underlying this article are available in the article and in its online supplementary material.
Funding
This work was supported by the BC Salmon Restoration and Innovation Fund (BCSRIF_2019_006_2) as supported by Fisheries and Oceans Canada and the Province of British Columbia. NCB and FJ were supported by NSERC. HLD was supported by the University of Victoria.
Authors contribution statement
NCB: conceptualization, methodology, analyses, writing, and original draft preparation. CM, MA, SS: data collection, review, editing. HD, DH: visualization, review, editing. CM: data collection supervision, review, editing. PV, FJ: review, editing. All authors have read and agreed to the published version of the manuscript.
