


Abstract
Depression and anxiety are highly prevalent among individuals with inflammatory bowel disease (IBD); however, little is understood about how social determinants of health (SDOH) may impact mental health diagnoses in this population. The social vulnerability index (SVI) is a publicly available tool that can be used to study SDOH in IBD patients.
Home addresses from a retrospective cohort of IBD patients at a single center were used to geocode patients to their individual census tract and corresponding SVI. We used multivariable logistic regression to examine the relationship between SVI and comorbid mental health diagnoses in patients with IBD. Secondarily, data from standardized health questionnaires were then used to determine if patients were adequately screened for depression and anxiety.
In all, 9644 patients were included; 18% had a diagnosis of depression, 21% anxiety, and 32% had a composite of “any mental health diagnosis.” Depression (odds ratio [OR], 1.27; 95% confidence interval [CI], 1.02-1.56) but not anxiety (OR, 0.87; 95% CI, 0.71-1.06) nor “any mental health diagnosis” (OR, 1.09; 95% CI, 0.92-1.30) was associated with higher levels of social vulnerability. However, overall rates of screening for depression and anxiety were low (15% and 8%, respectively), with the lowest screening rates among the most socially vulnerable (depression 8.2%, anxiety 6.3%).
Disparities in the diagnoses of depression and anxiety for socially vulnerable patients with IBD exist. Awareness of these inequities is the first step toward developing interventions to improve mental health screening, eliminate barriers and bias, and promote referrals for appropriate mental health management.
Lay Summary
Socially vulnerable patients with inflammatory bowel disease are more likely to be diagnosed with depression but not anxiety. However, overall rates of screening for depression and anxiety are low, particularly among more socially vulnerable patients.
Depression and anxiety are highly prevalent among patients with inflammatory bowel disease and are associated with decreased quality of life and increased unplanned care.
Socially vulnerable patients with inflammatory bowel disease may be less likely to receive proper diagnoses of depression and anxiety, thereby preventing referral to appropriate management.
These results should encourage clinicians to screen all socially vulnerable patients with inflammatory bowel disease for depression and anxiety so that they can promote referral to appropriate management, improve quality of life, and ultimately provide more equitable mental health care to all patients with inflammatory bowel disease.
Introduction
Inflammatory bowel disease (IBD) is increasingly being diagnosed in diverse patient populations, potentially due to improved disease recognition by medical providers.1–3 While early disease detection is a positive step toward improving health-related disparities, research has been limited in evaluating the impact of the social determinants of health (SDOH), or the nonmedical social and environmental factors that influence health,4 on IBD outcomes in this increasingly diverse patient population.5,6 This knowledge gap may be in part due to the difficulty of gathering reliable community-level data on large populations of patients with IBD. One potential solution is the utilization of the publicly available social vulnerability index (SVI) from the Centers for Disease Control (CDC), which collects data on various social factors, such as housing, race, and employment, in all census tracts in the United States.7 While this data has traditionally been used to identify vulnerable communities in a public health crisis or natural disaster,8 it is increasingly being used to identify social factors that may influence health outcomes.9–11 Similarly, the SVI could be applied to populations of patients with IBD to better understand the relationship between SDOH and IBD outcomes.
Understanding the role of SDOH in the diagnosis and treatment of mental health conditions is of critical importance for patients with IBD. Similar to their other chronic disease counterparts, patients with IBD suffer from depression and anxiety at higher rates than the general population.12 Furthermore, these comorbid mental health diagnoses are associated with increased healthcare utilization, increased healthcare costs, and decreased quality of life.13,14 Outside of their IBD diagnosis, patients with high social vulnerability also deal with additional unique life stressors including systemic racism, discriminatory healthcare policies, and the religious and cultural consequences of seeking mental health resources.15 However, while the importance of making an early diagnosis of depression or anxiety in patients with IBD is well understood, there are limited data on which IBD patients are most at risk for these conditions.
Using the CDC SVI data, we aimed to identify the relationship between social vulnerability and comorbid mental health diagnoses in patients with IBD. Secondarily, we aimed to determine if disparities in mental health screening and severity exist for socially vulnerable patients with IBD. We hypothesized that more socially vulnerable patients would be more likely to be diagnosed with depression, anxiety, or any mental health diagnosis and they would experience more severe symptoms of depression and anxiety compared with their less vulnerable counterparts.
Materials and Methods
Study Design and Patient Population
We performed a retrospective review of all patients 18 years or older with IBD seen at the University of Michigan between January 1, 2015, and August 31, 2022. The diagnosis of IBD was based on International Classification of Diseases (ICD) codes for Crohn’s disease (CD) and ulcerative colitis (UC; Supplemental Table 1). For patients with diagnosis codes for both CD and UC, the most frequent diagnosis was used. Patients with an equal number of diagnoses for CD and UC were given a diagnosis of “unspecified.”
Social Vulnerability Index
Our independent variable of interest was the social vulnerability index and subthemes. The SVI was created by CDC to identify at-risk communities during natural disasters and public health emergencies, but it has been adapted by clinical researchers to predict populations at risk for a wide variety of poor health outcomes.9–11 The SVI takes into account 15 variables from the American Community Survey (ACS) and categorizes them into 4 subthemes: socioeconomic status; household composition and disability; minority status and language; and housing type and transportation.7 The SVI draws data from US census tracts, or subdivisions of counties, consisting of approximately 4000 individuals to separate populations based on geographic area. State-based percentile rankings are then used to score each census tract from 0 to 1 at the individual variable level, at the level of the 4 subthemes, and by the total SVI. Higher scores on this scale indicate higher social vulnerability or disadvantage (Figure 1).
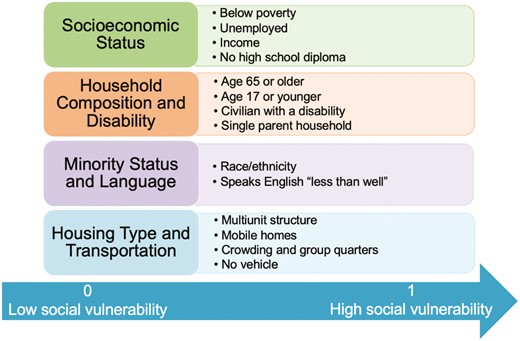
The Social Vulnerability Index. The SVI takes into account 15 area-level variables from the American Community Survey (ACS) and categorizes them into 4 themes: socioeconomic status, household composition and disability, minority status and language, and housing type and transportation. It uses United States census tracts, or subdivisions of counties consisting of approximately 4000 individuals, to separate populations based on geographic area. State-based percentile rankings are then used to score each census tract from 0-1 for each variable, for the each of the 4 subthemes, and for the total SVI. Higher scores indicate higher vulnerability. Image adapted from CDC SVI Documentation 2018, Place and Health, ATSDR.
Using the most recent address listed in the electronic medical record, we geocoded patients to their individual census tract and linked them to their corresponding SVI and subthemes. Our population spanned from 2015 to 2022; therefore, we chose the 2018 ACS estimates for the state of Michigan. Patients were excluded if SVI data were not available, if their address was located outside of Michigan, if their address was invalid (could not be geocoded to a census tract), or if a US Post Office box was listed.
As Michigan-based percentile rankings were used rather than national percentile rankings, it is important to understand how Michigan compares socioeconomically to the entire United States. According to the United Health Foundation’s “America’s Health Rankings,” which uses hundreds of health, environmental, and socioeconomic factors to rank each state on socioeconomic status, Michigan ranks 37th among the 50 states on social and economic factors.16
Outcomes Measures
Our primary outcome of interest was the diagnosis of comorbid mental health conditions in patients with IBD. We examined the diagnoses of depression and anxiety using ICD codes (Supplemental Table 2). We also examined a composite measure of “any mental health diagnosis,” which included ICD codes for depression, anxiety, bipolar disorder, post-traumatic stress disorder, body image disorder, obsessive compulsive disorder, stress, dysthymia, seasonal affective disorder, and panic disorder.
Our secondary outcomes of interest included the rates of screening for depression and anxiety, as well as the severity of these mental health conditions across the range of social vulnerability. After review of the available data at our institution, we found that the Patient Health Questionnaire-9 (PHQ-9) and the Generalized Anxiety Disorder-7 (GAD-7) were the most commonly used screening tools for depression and anxiety in routine clinical practice. As such, they were used to determine the prevalence of screening for depression and anxiety across the IBD population at our institution. The PHQ-9 is a 9-item survey tool that grades severity of depression on a 0 to 27 scale, with higher scores indicating more severe depression (Supplemental Table 3). Similarly, the GAD-7 is a 7-item survey tool that grades severity of anxiety on a scale from 0 to 21, with higher scores indicating more severe anxiety (Supplemental Table 4). Importantly, in our health system, PHQ-9 and GAD-7 screening typically occurs in a primary care setting but can be performed in any clinical encounter, including at gastroenterology clinic visits, mental health visits, or other specialty care.
Individuals were counted as “screened” for depression or anxiety if they had ever completed a PHQ-9 or GAD-7, respectively. The severity of depression and anxiety was measured by the highest PHQ-9 and GAD-7 scores recorded during the study period.
Covariates
Covariates of interest included IBD-type, age, sex, race, ethnicity, marital status, religious affiliation, preferred language, comorbidities, IBD medication type, and disease severity. All covariates were extracted from the electronic medical record (EMR) using the health system data warehouse. Religious affiliation was a dichotomous variable of “yes” if any religious affiliation was listed in the EMR (eg, Catholic, Protestant, Jewish, Muslim) vs “no” if no religious affiliation was listed (eg, atheist, agonistic, spiritual, or none). Preferred language was a dichotomous variable including “English” if English was listed as the preferred language in the EMR vs “other” if any other language was listed. Comorbidities were calculated using the highest Charlson Comorbidity Index recorded during the study period. Patients were considered to be prescribed biologic or immune therapy if they received any prescription for a biologic (infliximab, adalimumab, certolizumab, golimumab, vedolizumab, ustekinumab, risankizumab, natalizumab), immunomodulator (azathioprine, mercaptopurine, methotrexate), or small molecule (tofacitinib, upadacitinib, or ozanimod). Finally, we defined moderate to severe inflammatory bowel disease as having at least 1 IBD-related hospitalization, IBD-related surgery, or prolonged corticosteroid use (greater than 120 days) during the study period. While no validated measure or consensus guideline currently exists for defining IBD severity in retrospective studies, prior work has shown these factors to be associated with more severe disease and worse IBD-related outcomes.17,18
Statistical Analysis
Primary outcomes
Descriptive statistics were calculated using means and standard deviations (SD) for continuous variables and frequencies for categorical variables. Multivariable logistic regression was used to examine the relationship between SVI and comorbid depression, anxiety, and any mental health diagnosis while adjusting a priori for IBD type, age, sex, race, ethnicity, preferred language, marital status, religious affiliation, comorbidities, IBD-related medications, and disease severity. In a secondary analysis, multivariable logistic regression was then used to examine the relationship between each of the mental health diagnoses and SVI subthemes (socioeconomic status, household composition, minority status and language, and housing type and transportation).
While the SVI incorporates community-level racial/ethnic minority composition of the census tract, it does not account for specific race or ethnicity categories (eg, Black, white, Asian, American Indian, or Hispanic). Therefore, we included individual-level race/ethnicity data in our original model to better understand the nuanced differences between distinct racial, ethnic, and language categories (within the limitations of collecting reliable race and ethnicity data from the EMR).19 Given the potential for overcontrolling for these factors at both the community and individual level, we performed a sensitivity analysis excluding the individual race, ethnicity, and language factors from the analysis.
Secondary outcomes
For our secondary outcomes, we used Pearson’s χ2 test to determine if there was a significant difference in rates of mental health screening across the state-based quartile SVI rankings. Post hoc pairwise χ2 tests were used for between group comparisons, controlling for multiple comparisons with the Bonferroni correction. Similarly, we used the Kruskal-Wallis rank sum test to examine differences in severity of mental health disorders across state-based population quartiles of the SVI. The Dunn test was then used for pairwise comparisons, controlling for multiple comparisons with the Bonferroni correction.
Finally, we performed multivariable logistic regression examining the relationship between screening for depression and anxiety with multiple social and health factors, including IBD type, age, sex, race, ethnicity, marital status, preferred language, religious affiliation, comorbidities, IBD-related medications, and disease severity. We also performed linear regression examining the relationship between SVI and PHQ-9/GAD-7 scores, controlling a priori for these same social factors.
All analysis was performed in R version 4.2.2. P values of <0.05 were considered statistically significant. All materials are presented in accordance with STROBE guidelines for cohort studies.
Results
Cohort Characteristics
In all, 15 208 patients with IBD were identified via the EMR based on ICD codes. A total of 960 patients were excluded due to living outside of Michigan, and 543 were removed for due to being younger than 18 years old. Another 4 061 patients were removed for missing data. The main cohort included 9644 patients with IBD. However, due to missing data from the CDC website, the subgroup analyses from the housing type and transportation subtheme (mobile homes, crowding, vehicle access, group quarters, and multi-unit structures) included only 2287 patients. All other analyses included the 9644 patient cohort (Supplemental Figure 1).
Of the 9644 patient cohort, 18% (n = 1730) had a diagnosis of depression, 21% (n = 2041) anxiety, and 32% (n = 3106) any mental health diagnosis (Table 1). The cohort included approximately equal numbers of patients with Crohn’s disease (n = 4849) and ulcerative colitis (n = 4728), was 55% (n = 5327) female, and 88% (n = 8475) white. The average age was 50 years (SD, 18 years), the average Charlson Comorbidity Index (CCI) was 3.6 (SD, 5.1), and 55% (n = 5,340) of patients had moderate to severe IBD as previously defined.
Patient demographics by mental health diagnosis
| Total Cohort | Depression Diagnosis | Anxiety Diagnosis | Any Mental Health Diagnosis | ||||
|---|---|---|---|---|---|---|---|
| N = 9644 | No N = 7914 (88%) | Yes N = 1730 (18%) | No N = 7603 (79%) | Yes N = 2041 (21%) | No N = 6538 (68%) | Yes N = 3106 (32%) | |
| IBD Diagnosis | |||||||
| Crohn’s disease | 4849 (50%) | 3940 (50%) | 909 (53%) | 3795 (50%) | 1054 (52%) | 3237 (50%) | 1612 (52%) |
| Ulcerative colitis | 4728 (49%) | 3914 (49%) | 814 (47%) | 3752 (49%) | 976 (48%) | 3252 (50%) | 1476 (48%) |
| Unspecified | 67 (0.7%) | 60 (0.8%) | 7 (0.4%) | 56 (0.7%) | 11 (0.5%) | 49 (0.7%) | 18 (0.6%) |
| Age (mean, SD) | 50 (18) | 49 (19) | 51 (17) | 50 (19) | 48 (17) | 50 (19) | 49 (18) |
| Female Sex | 5327 (55%) | 4159 (53%) | 1168 (68%) | 3928 (52%) | 1399 (69%) | 3284 (50%) | 2043 (66%) |
| Race | |||||||
| White | 8475 (88%) | 7275 (87%) | 1552 (88%) | 6645 (87%) | 1830 (90%) | 5733 (88%) | 2742 (88%) |
| Black | 624 (6.5%) | 504 (6.4%) | 120 (6.9%) | 510 (6.7%) | 114 (5.6%) | 420 (6.4%) | 204 (6.6%) |
| Asian or Pacific Islander | 224 (2.5%) | 203 (2.6%) | 21 (1.2%) | 197 (2.6%) | 27 (1.3%) | 173 (2.6%) | 51 (1.6%) |
| Other | 321 (3.3%) | 261 (3.3%) | 60 (3.5%) | 251 (3.3%) | 70 (3.4%) | 212 (3.2%) | 109 (3.5%) |
| Non-Hispanic Ethnicity | 9460 (98%) | 7765 (98%) | 1695 (98%) | 7461 (98%) | 1999 (98%) | 6418 (98%) | 3042 (98%) |
| English Preferred | 9565 (99%) | 7843 (99%) | 1722 (100%) | 7530 (99%) | 2035 (100%) | 6472 (99%) | 3093 (100%) |
| Any Religious Affiliation | 5514 (57%) | 4516 (57%) | 998 (58%) | 4336 (57%) | 1178 (58%) | 3702 (57%) | 1812 (58%) |
| Charlson Comorbidity Index (mean, SD) | 3.6 (5.1) | 3.3 (5.0) | 4.7 (5.6 | 3.5 (5.1) | 4.0 (5.3) | 3.2 (4.9) | 4.3 (5.5) |
| Biologic or Immune Therapy | 5794 (60%) | 4807 (61%) | 987 (57%) | 4611 (61%) | 1183 (58%) | 3987 (61%) | 1807 (58%) |
| Moderate-to-Severe Disease | 5340 (55% | 4196 (53%) | 1144 (66%) | 4030 (53%) | 1310 (64%) | 3353 (51%) | 1987 (64%) |
| Depression Diagnosis | 1730 (18%) | - | - | 773 (10%) | 957 (47%) | 0 (0%) | 1730 (56%) |
| Anxiety Diagnosis | 2041 (21%) | 1084 (14%) | 957 (55%) | - | - | 0 (0%) | 2041 (66%) |
| Any Mental Health Diagnosis | 3106 (32%) | 1376 (17%) | 1730 (100%) | 1065 (14%) | 2041 (100%) | - | - |
| Social Vulnerability Index (mean, SD) | 0.37 (0.26) | 0.37 (0.26) | 0.39 (0.26) | 0.37 (0.26) | 0.37 (0.25) | 0.37 (0.26) | 0.38 (0.26) |
Columns include means and standard deviations (SD) for continuous variables and frequencies for categorical variables.
Any religious affiliation defined as having any religious preference listed in the electronic medical record (eg, Catholic, Jewish, Muslim)
Moderate to severe disease defined as having any IBD-related hospitalization, surgery, or >120 continuous days of corticosteroid exposure
Social Vulnerability and Mental Health Diagnoses
Total SVI
On multivariable logistic regression, higher social vulnerability was associated with increased odds of depression (odds ratio [OR], 1.27; 95% CI, 1.02-1.56; P = .03; Table 2). Anxiety (OR, 0.87; 95% CI, 0.71-1.06; P = .2) and any mental health diagnosis (OR, 1.09; 95% CI, 0.92-1.30; P = .3) were not associated with overall social vulnerability.
Adjusted relationship between high social vulnerability and mental health diagnoses.a
| Depression | Anxiety | Any Mental Health Diagnosis | |||||||
|---|---|---|---|---|---|---|---|---|---|
| Characteristic | aOR | 95% CI | P | aOR | 95% CI | P | aOR | 95% CI | P |
| IBD Diagnosis | |||||||||
| Crohn’s disease | - | - | - | - | - | - | |||
| Ulcerative colitis | 0.88 | 0.78, 0.98 | 0.021 | 0.92 | 0.83, 1.03 | 0.13 | 0.89 | 0.81, 0.98 | 0.015 |
| Unspecified | 0.48 | 0.20, 1.01 | 0.077 | 0.72 | 0.35, 1.34 | 0.3 | 0.74 | 0.41, 1.28 | 0.3 |
| Age | 1.00 | 1.00, 1.00 | 0.7 | 0.99 | 0.98, 0.99 | <0.001 | 0.99 | 0.99, 1.0 | <0.001 |
| Female | 1.89 | 1.69, 2.11 | <0.001 | 2.07 | 1.87, 2.31 | <0.001 | 1.94 | 1.77, 2.12 | <0.001 |
| Race | |||||||||
| White | - | - | - | - | - | - | |||
| Black | 0.89 | 0.71, 1.10 | 0.3 | 0.70 | 0.56, 0.86 | 0.001 | 0.85 | 0.70, 1.02 | 0.075 |
| Asian or Pacific Islander | 0.59 | 0.36, 0.91 | 0.024 | 0.55 | 0.36, 0.82 | 0.005 | 0.74 | 0.53, 1.02 | 0.074 |
| Other | 1.10 | 0.80, 1.50 | 0.5 | 1.04 | 0.77, 1.38 | 0.8 | 1.12 | 0.87, 1.45 | 0.4 |
| Non-Hispanic Ethnicity | 0.94 | 0.63, 1.42 | 0.8 | 0.95 | 0.65, 1.40 | 0.8 | 0.91 | 0.65, 1.28 | 0.6 |
| Marital Status | |||||||||
| Married | - | - | - | - | - | ||||
| Unmarried | 1.37 | 1.20, 1.55 | <0.001 | 1.21 | 1.07, 1.36 | 0.002 | 1.25 | 1.12, 1.39 | <0.001 |
| Other | 0.98 | 0.84, 1.14 | 0.8 | 1.00 | 0.87, 1.15 | >0.9 | 0.97 | 0.86, 1.10 | 0.7 |
| No Religious Affiliation | 1.10 | 0.99, 1.23 | 0.086 | 0.98 | 0.88, 1.09 | 0.7 | 1.00 | 0.91, 1.10 | >0.9 |
| Language other than English | 0.55 | 0.24, 1.10 | 0.12 | 0.36 | 0.14, 0.79 | 0.020 | 0.43 | 0.22, 0.78 | 0.008 |
| Charlson Comorbidity Index | 1.04 | 1.03, 1.06 | <0.001 | 1.03 | 1.02, 1.05 | <0.001 | 1.05 | 1.04, 1.06 | <0.001 |
| Biologic or Immune Therapy | 0.81 | 0.72, 0.91 | <0.001 | 0.76 | 0.68, 0.85 | <0.001 | 0.80 | 0.73, 0.89 | <0.001 |
| Moderate-to-Severe Disease | 1.66 | 1.48, 1.86 | <0.001 | 1.59 | 1.43, 1.77 | <0.001 | 1.63 | 1.49, 1.79 | <0.001 |
| Social Vulnerability Index | 1.27 | 1.02, 1.56 | 0.030 | 0.87 | 0.71, 1.06 | 0.2 | 1.09 | 0.92, 1.30 | 0.3 |
Abbreviations: aOR, odds ratio; CI, confidence interval
aAdjusted odds ratio: adjusted for IBD type, age, sex, race, ethnicity, language, marital status, religion, comorbidities, IBD medications, and disease severity
Religious affiliation defined as having any religious preference listed in the electronic medical record (eg, Catholic, Jewish, Muslim)
Moderate to severe disease defined as having any IBD-related hospitalization, surgery, or > 120 continuous days of corticosteroid exposure
When examining other covariates in this model, female sex, unmarried status, higher CCI, and moderate to severe disease were associated with an increased odds of depression, anxiety, and any mental health condition. We also identified several factors associated with decreased odds of mental health diagnoses. For example, ulcerative colitis (compared with Crohn’s disease) was associated with decreased odds of depression or any mental health diagnosis. Black race (compared with white race) was associated with lower odds of anxiety, while Asian race was associated with lower odds of depression and anxiety. Finally, use of a biologic and/or immunomodulator was associated with decreased odds of depression, anxiety, and any mental health diagnosis (Table 2).
SVI subthemes
Socioeconomic Status.
Higher vulnerability scores on the socioeconomic status subtheme were not associated with higher odds of depression (OR, 1.31; 95% CI, 0.97-1.78; P = .082), anxiety (OR, 0.80; 95% CI, 0.60-1.07; P = .14), nor any mental health diagnosis (OR, 1.09; 95% CI, 0.84-1.41; P = .5). Of the individual components of the socioeconomic status subtheme, only “no high school diploma” was associated with lower odds of depression (Table 3).
Adjusted relationship between subthemes of social vulnerability and mental health diagnoses.a
| Depression | Anxiety | Any Mental Health Diagnosis | |||||||
|---|---|---|---|---|---|---|---|---|---|
| SVI Subthemes | aOR | 95% CI | P | aOR | 95% CI | P | aOR | 95% CI | P |
| Socioeconomic Status | 1.31 | 0.97, 1.78 | 0.082 | 0.80 | 0.60, 1.07 | 0.14 | 1.09 | 0.84, 1.41 | 0.5 |
| Below Poverty | 1.10 | 0.77, 1.59 | 0.6 | 1.14 | 0.81, 1.20 | 0.6 | 1.37 | 1.02, 1.85 | 0.039 |
| Unemployed | 1.18 | 0.91, 1.53 | 0.2 | 0.94 | 0.73, 1.20 | 0.6 | 1.00 | 0.80, 1.24 | >0.9 |
| Income | 1.48 | 0.96, 2.28 | 0.077 | 0.82 | 0.54, 1.23 | 0.3 | 0.86 | 0.60, 1.23 | 0.4 |
| No High School Diploma | 0.70 | 0.49, 0.98 | 0.038 | 0.90 | 0.65, 1.28 | 0.5 | 0.96 | 0.72, 1.28 | 0.8 |
| Household Composition | 0.76 | 0.58, 0.99 | 0.045 | 0.85 | 0.66, 1.10 | 0.2 | 0.80 | 0.64, 0.99 | 0.043 |
| Aged 65 and Over | 0.57 | 0.44, 0.74 | <0.001 | 0.63 | 0.49, 0.81 | <0.001 | 0.51 | 0.41, 0.64 | <0.001 |
| Aged 17 and Younger | 0.70 | 0.55, 0.88 | 0.003 | 0.71 | 0.57, 0.89 | 0.002 | 0.73 | 0.60, 0.88 | 0.001 |
| Civilian with a Disability | 1.21 | 0.87, 1.69 | 0.3 | 0.98 | 0.71, 1.35 | >0.9 | 1.35 | 1.02, 1.78 | 0.036 |
| Single-Parent Households | 1.19 | 0.89, 1.58 | 0.2 | 1.52 | 1.16, 1.99 | 0.002 | 1.23 | 0.97, 1.56 | 0.087 |
| Minority and Language | 1.15 | 0.95, 1.40 | 0.2 | 1.45 | 1.20, 1.74 | <0.001 | 1.30 | 1.10, 1.53 | 0.002 |
| Minority | 1.43 | 1.10, 1.87 | 0.007 | 1.67 | 1.30, 2.15 | <0.001 | 1.49 | 1.20, 1.85 | <0.001 |
| English “Less than Well” | 0.92 | 0.77, 1.11 | 0.4 | 1.03 | 0.87, 1.23 | 0.7 | 1.01 | 0.87, 1.18 | 0.9 |
| Housing and Transportation | 1.24 | 1.00, 1.56 | 0.055 | 1.10 | 0.89, 1.36 | 0.4 | 1.16 | 0.96, 1.40 | 0.12 |
| Mobile Homesa | 0.50 | 0.24, 1.05 | 0.069 | 1.06 | 0.52, 2.17 | 0.9 | 0.81 | 0.44, 1.50 | 0.5 |
| Crowdinga | 0.78 | 0.44, 1.39 | 0.4 | 0.69 | 0.39, 1.20 | 0.2 | 0.87 | 0.54, 1.42 | 0.6 |
| No Vehiclea | 0.91 | 0.45, 1.85 | 0.8 | 1.12 | 0.57, 2.20 | 0.8 | 1.36 | 0.76, 2.46 | 0.3 |
| Group Quartersa | 0.91 | 0.55, 1.50 | 0.7 | 0.63 | 0.39, 1.02 | 0.061 | 0.70 | 0.46, 1.06 | 0.089 |
| Multi-Unit Structuresa | 1.22 | 0.62, 2.41 | 0.6 | 0.99 | 0.51, 1.91 | >0.9 | 0.94 | 0.53, 1.67 | 0.8 |
SVI, social vulnerability index; aOR, adjusted odds ratio; CI, confidence interval.
*Adjusted odds ratio; adjusted for IBD type, age, sex, race, ethnicity, language, religion, comorbidities, IBD medications, and disease severity.
aDue to missing data from the Centers for Disease control, these subgroups included only 2287 patients. All other groups included the total 9644 patients.
Household Composition and Disability.
Higher vulnerability scores on the household composition and disability subtheme were associated with lower odds of depression (OR, 0.76; 95% CI, 0.58-0.99; P = .045) and any mental health diagnosis (OR, 0.80; 95% CI, 0.64-0.99; P = .043) but not anxiety (OR, 0.85; 95% CI, 0.66-1.10, P = .2). When examining the individual components comprising household composition and disability, higher census-tract level proportions of individuals aged 65 and over or 17 and younger were associated with a lower odds of depression, anxiety, or any mental health diagnosis. Conversely, higher census-tract proportions of persons with a disability were associated with higher odds of any mental health diagnosis, and higher proportions of single parent households were associated with higher odds of anxiety (Table 3).
Minority Status and Language.
Higher vulnerability scores on the minority status and language subtheme were associated with higher odds of anxiety (OR, 1.45; 95% CI, 1.20-1.74; P < .001) and any mental health diagnosis (OR, 1.30; 95% CI, 1.10-1.53; P = .002) but not depression (OR, 1.15; 95% CI, 0.95-1.40; P = .2). When examining the individual components comprising minority status and language, higher vulnerability scores on minority status were associated with higher odds of depression, anxiety, and any mental health diagnosis, while speaking English “less than well” was not significantly associated with any of the mental health diagnoses studied.
Housing Type and Transportation.
None of the mental health diagnoses were significantly associated with the housing type and transportation or any of the individual factors comprising this subtheme.
Sensitivity Analyses
In our individual race, ethnicity, and language unadjusted models, results similarly showed an association between high social vulnerability with depression (OR, 1.24; 95% CI, 1.01-1.52; P = .043) but not any mental health diagnosis. Interestingly, high social vulnerability became associated with lower odds of anxiety after removing the individual race, ethnicity, and language variables (OR, 0.90; 95% CI, 0.66-0.97; P = .027. Several differences were also observed on examination of the subthemes. When unadjusted for individual race, ethnicity, and language, higher vulnerability scores on the socioeconomic status subtheme were associated with decreased odds of anxiety. Additionally, higher vulnerability scores on household composition were no longer associated with lower odds of depression or any mental health diagnosis (Supplemental Table 5).
Mental Health Screening and Severity
When separating patients by state-based population SVI quartiles, 40% (3817) of patients were from the least vulnerable quartile, 50% (4851) were from the middle 2 quartiles, and 10% (976) were from the most vulnerable quartile of vulnerability. Patients from the most socially vulnerable quartile were much less likely to be screened for depression with PHQ-9 surveys compared with patients from the least vulnerable quartile (8.4% vs 21%; P < .001; Figure 2A). Similarly, patients from the most vulnerable quartile were less likely to be screened for anxiety with GAD-7 surveys compared with patients from the least vulnerable quartile (6.4% vs 12%, P < .001; Figure 2B). See Supplemental Table 6 for a complete list of pairwise comparisons and associated P values.
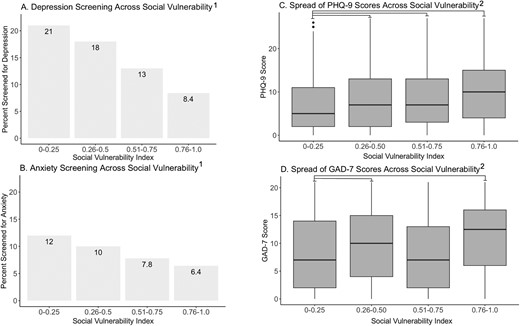
Screening and Severity of Depression and Anxiety Across Social Vulnerability. A, Percentage of patients screened with PHQ-9 per quartile of social vulnerability. B, Percent of patients screened with GAD-7 per quartile of social vulnerability. C, Median PHQ-9 score across quartiles of social vulnerability. D, Median GAD-7 score across quartiles of social vulnerability. PHQ-9 = Patient Health Questionnaire-9; scale measuring depression severity which ranges from 0-27, higher scores indicate more severe depression. GAD-7 = Generalized Anxiety Disorder-7; scale measuring anxiety severity which ranges from scale 0-21, higher scores indicate more severe anxiety. The social vulnerability index; derived from state-based percentile rankings of census tracts with 0-0.25 indicating the least vulnerable quartile and 0.76-1.0 indicating the most vulnerable quartile in the state of Michigan. 1P < .001 for both depression and anxiety using Pearson’s χ2 test. All pairwise comparisons for depression screening were statistically significant to P value of .05 or less, corrected for multiple comparisons with Bonferroni correction. All pairwise comparisons for anxiety screening were statistically significant to P value of 0.05 or less, except for comparisons between the 0-0.25 and 0.26-0.5 groups and the 0.51-0.75 and 0.76-1.0 groups. 2P < .001 for both PHQ-9 and GAD-7 using Kruskal Wallis rank sum test. All statically significant pairwise comparisons to a P value of .05 or less are indicated by horizontally connecting lines.
This decreased screening for depression and anxiety amongst more socially vulnerable patients persisted even after controlling for multiple social and health factors on multivariable analysis. Compared with those in the lowest quartile of social vulnerability, those in the second (OR, 0.76; 95% CI, 0.67-0.86; P < .001; OR, 0.82; 95% CI, 0.70-0.96; P = .015), third (OR, 0.54; 95% CI, 0.46-0.63; P < .001; OR, 0.60; 95% CI, 0.49-0.73; P < .001), and fourth (OR, 0.30; 95% CI, 0.23-0.39; P < .001; OR, 0.44; 95% CI, 0.33-0.59; P < .001) quartiles were less likely to be screened for depression and anxiety, respectively. Additionally, compared with white patients, Black (OR, 1.44; 95% CI, 1.14-1.81; P = .002; OR, 1.43; 95% CI, 1.09-1.86; P = .008) and Asian (OR, 2.31; 95% CI, 1.68-3.15; P < .001; OR, 1.82; 95% CI, 1.23-2.63; P = .002) patients were more likely to be screened for depression and anxiety, respectively. There was no association with depression or anxiety screening and preferred language other than English (OR, 0.91; 95% CI, 0.45-1.69; P = .6; OR, 0.94; 95% CI, 0.81-1.08; P = .4; Supplemental Table 7).
When examining severity of depression in those screened with PHQ-9, patients from the most socially vulnerable quartile had a median PHQ-9 score of 10, indicating moderate depression, compared with those from the least vulnerable quartile who had an median PHQ-9 score of 5, indicating mild depression (P < .001; Figure 2C). When examining severity of anxiety in those screened with GAD-7, patients from the most vulnerable quartile had a median GAD-7 score of 12, indicating moderate anxiety, compared with those from the least vulnerable quartile who had a median GAD-7 score of 7, indicating mild anxiety (P = .016; Figure 2D). See Supplemental Table 8 for a complete list of pairwise comparisons and associated P values.
Finally, on multivariable linear regression, higher total SVI was associated with higher scores on both the PHQ-9 (Beta = 2.7; 95% CI, 1.3-4.2; P < .001) and GAD-7 (Beta = 2.0; 95% CI, 0.22-3.7; P = .027; Figure 3). For a full list of covariates, refer to Supplemental Table 9.
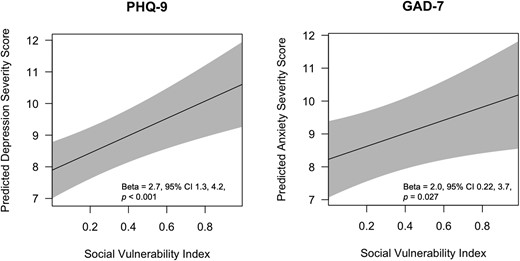
Predicted Mental Health Severity Scores Across Range of Social Vulnerability. PHQ-9 = Patient Health Questionnaire-9; scale measuring depression severity which ranges from 0-27, higher scores indicate more severe depression. GAD-7 = Generalized Anxiety Disorder-7; scale measuring anxiety severity which ranges from scale 0-21, higher scores indicate more severe anxiety. SVI = Social vulnerability index; derived from state-based percentile rankings of census tracts with 0-0.25 indicating the least vulnerable quartile and 0.76-1.0 indicating the most vulnerable quartile in the state of Michigan. *Adjusted a priori for IBD type, age, sex, race, ethnicity, preferred language, marital status, religious affiliation, comorbidities, medications, and disease severity
Discussion
Higher SVI was associated with a diagnosis of depression but not anxiety nor the composite of any mental health diagnosis in our IBD population. However, patients with high SVI were also less likely to be screened for depression or anxiety despite having higher scores on these measures, suggesting that patients with higher SVI may be less likely to receive proper mental health diagnosis and management. Despite underdiagnosis of mental health conditions in patients with higher social vulnerability, our analysis of SVI subthemes revealed that community-level socioeconomic and minority status were associated with a greater likelihood of mental health diagnoses, while household composition may play a protective role.
Higher levels of social vulnerability were not associated with increased risk of depression, anxiety, or any mental health diagnosis. These findings are contrary to prior research which has shown an association between low socioeconomic status and depression and anxiety in both the general population and in patients with IBD.20–23 These findings are likely due to the low rates of mental health screening in patients with high social vulnerability leading to underdiagnosis in our population. However, we were able to identify several other factors that were associated with mental health disorders (such as comorbidities, marital status of single, and moderate to severe disease), while other factors seemed to be protective (such as treatment with a biologic or immune therapy). These results suggest that the relationship between IBD and mental health is complex, but more screening of individuals with a higher SVI is needed to determine how SES fits into this model. With a known association between depression/anxiety and increased unplanned IBD care, IBD practitioners should be particularly mindful of screening patients across the socioeconomic spectrum so that all patients can be referred to appropriate management.
Higher vulnerability scores on the household composition and disability subtheme were associated with lower rates of depression or any mental health diagnosis. Specifically, living in a census tract with a higher portion of individuals 65 and older or 17 and younger was associated with lower rates of depression, anxiety, and any mental health diagnosis. These findings may highlight the importance of social support and the potentially positive influence of multigenerational homes. One survey-based study found that healthy individuals living in a 2-generational household had lower premature mortality than those in single-generation households.24 Specifically, multigenerational living was associated with less frequent mental distress in older adults and higher levels of cognitive functioning for children.25,26 This is thought to be due to less financial strain, a more socially enriched home environment, and stronger structural ties even in more socially vulnerable communities (eg, family members can travel together in less safe neighborhoods, and large, nutritious, cost-effective meals can be shared among many household members).24,26,27
While the effects of multigenerational living on mental health in IBD is an important topic for future work, adequate social support has been shown as a protective mediating factor against psychological challenges in IBD.28–30 Similar to our study, single-parent households have been associated with higher rates of anxiety and depression in both parents and children.31 In IBD, marital status, specifically being in a healthy marriage, has also been shown as an important positive quality of life metric impacting mental health.32,33 Similarly, our results also indicated that living in a census tract with a high proportion of single-parent households was associated with higher likelihood of anxiety.
Higher vulnerability scores on the minority status and language subtheme were associated with greater likelihood of mental health diagnoses. Specifically, individuals living in census tracts with a higher proportion of minorities were more likely to experience depression, anxiety, or any mental health diagnosis. Interestingly, when examining individual-level variables, we found that patients of Black or Asian race were more likely to be screened for depression and anxiety than those of white race. Despite this increased screening, Black and Asian patients did not have higher rates of depression or anxiety (and in fact were slightly less likely to carry these diagnoses). These individual-level findings seem to contradict the community-level findings and prior work which has demonstrated that racial minorities may suffer from more frequent and debilitating depression.34,35 However, other studies have demonstrated that racial minority individuals are less likely to receive mental health diagnoses despite suffering from high levels of psychological distress, often referred to as the “race paradox in mental health.”36,37 The reasoning for this is likely multifactorial, partially owing to atypical presentations of depression, provider bias, greater chronic disease burden, and cultural/religious consequences of seeking mental healthcare.34,38,39 The SVI further confuses these findings by grouping all racial and ethnic minority individuals into one non-white category, effectively erasing any social and cultural differences between minority groups. While we attempted to identify some of these issues in our sensitivity analysis, a more diverse patient population will ultimately be needed to better understand any racial or ethnic differences in mental health outcomes.
Finally, there were no associations found between depression, anxiety, or any mental health diagnosis and the housing type and transportation subtheme. However, the inaccessibility of the healthcare system due to lack of transportation is a known barrier for those with high social vulnerability.40 Racial and ethnic minority patients, for example, are less likely to obtain medical care than white patients due to transportation difficulties, even with controlling for SES.41 For patients with a chronic disease, maintaining appropriate chronic disease management depends on the ability to obtain medications and consistently attend outpatient clinic appointments to reduce their already increased risk of morbidity.42 While we did not find any differences in mental health diagnoses based on housing and transportation (potentially due to a significantly smaller n in this subgroup analysis), the literature suggests that this is still an important barrier for many patients to receiving appropriate care.
To our knowledge, this is the first study to evaluate the association between mental health outcomes and social vulnerability among the IBD patient population. However, the results of this study must be interpreted in the context of its limitations. One major limitation is the lack of racial and ethnic diversity in our patient population. Our population was 88% white, making it difficult to interpret results specific to any one racial or ethnic group. Furthermore, racial and ethnic information collected from the EMR may often conceal social and cultural differences.43 Another limitation of our study design is that we were unable to control for patients who moved during the study period, as only the most recent address could be used. While it is possible some patients may have moved between different census tracts, many economists have suggested that economic mobility in the United States has remained stagnant, making it less likely that individuals would move between census tracts with drastically different SVIs.44,45 An additional limitation is that PHQ-9 and GAD-7 surveys are typically performed by primary care physicians (PCPs) at our institution rather than at gastroenterology clinic visits, despite guideline recommendations for annual mental health screening for patients with IBD.46 Therefore, it is possible we underestimated the mental health screening for individuals who have PCPs outside of our institution. Finally, our population was highly skewed toward less socially vulnerable individuals, with 40% being from the least vulnerable state quartile for vulnerability and only 10% from the most vulnerable state quartile for vulnerability. Despite the smaller percentage, we were still able to detect disparities in mental health screening and diagnosis for socially vulnerable individuals given our robust sample size. However, this further emphasizes the need to replicate similar research in more socially diverse populations.
In summary, we demonstrated that higher levels of social vulnerability are associated with increased odds of depression in patients with IBD and that socioeconomic status, household composition, and minority status seem to play a role in the diagnosis of several mental health disorders. However, these findings may be underestimated, as overall screening rates for mental health disorders were low, particularly among individuals with high social vulnerability. To better understand the intersection of social vulnerability and racial and ethnic disparities, similar research needs to be replicated in more diverse communities with more vigorous screening for mental health disorders. Further prospective research with the use of other validated mental health and IBD-related questionnaires such as the Hospital Anxiety and Depression Scale, IBD Questionnaire, or the Work Productivity and Impairment Questionnaire are also needed to better understand the relationship of SDOH and severity of mental health symptoms and to allow for a more direct comparison to the currently available literature. Additionally, qualitative work is also needed to better understand the nuances of the lived experiences of individuals with mental illness across the spectrum of social vulnerability. Overall, awareness of inequities for socially vulnerable patients with IBD is the first step toward developing interventions that improve mental health screening, eliminate barriers and bias, and promote referrals for appropriate mental health management.
Supplementary Data
Supplementary data is available at Inflammatory Bowel Diseases online.
Abbreviations
- IBD
inflammatory bowel disease
- SDOH
social determinants of health
- SVI
social vulnerability index
- CDC
Centers for Disease Control
- ICD
International Classification of Diseases
- CD
Crohn’s disease
- UC
ulcerative colitis
- IC
indeterminant colitis
- ACS
American Community Survey
- PHQ-9
Patient Health Questionnaire-9
- GAD-7
Generalized Anxiety Disorder-7
- EMR
electronic medical record
- SES
socioeconomic status
- PCP
primary care provider
Author Contributions
Study concept and design: J.L.S., S.C.M., J.A.B. R.T., P.D.R.H.
Acquisition: J.L.S., L.A.J., P.D.R.H.
Figures: JLS, PDRH
Analysis of data, interpretation of data, drafting of the article, critical revision of the article, and final approval: all authors
Funding
J.L.S. is supported by T32 DK062708.
K.L.N. is supported by F32 DK134043.
R.T. is supported by R01AG075160, R01AG076437, R01AI170137, R01MD017093, Blue Cross Blue Shield of Michigan, Michigan Department of Health & Human Services, and The Commonwealth Fund.
P.D.R.H. is supported by T32 DK062708, R01 DK125687, R01 DK118154.
Conflicts of Interest
All authors report no relevant disclosures.
References
Author notes
Jessica L. Sheehan and Ariel A. Jordan Contributed equally to this article.

