


Abstract
While vitamin D (VitD) levels are negatively correlated with inflammatory bowel disease (IBD) activity, VitD supplementation does not reduce IBD severity. The probiotic Lactobacillus rhamnosus GG (LGG), which secretes p40, can upregulate colonic VitD receptor (VDR) expression. We therefore evaluated synergy between VitD3 and LGG/p40 in the treatment of mouse colitis.
A dextran sulfate sodium (DSS) colitis model was established in Vdr+/+ and Vdr-/- mice, and mice were treated with VitD3, LGG, or p40 alone or in combination for 7 to 14 days. Colitis severity was assessed by weight loss, disease activity index (DAI), colon length, histology, and inflammatory cytokine expression together with VDR expression, proliferation, and apoptosis. In vitro, VDR expression and cell viability were assessed in HCT116 cells after stimulation with p40.
Total and nuclear VDR protein expression were lower in DSS-treated Vdr+/+ mice compared with control mice (P < .05). Compared with the DSS group, VitD3 + LGG alleviated colitis as assessed by significantly improved DAI and histological scores, increased colon length, decreased colonic Tnf, and increased Il10 expression together with increased colonic VDR gene and protein expression and increased Ki-67 proliferation index (P < .05). In Vdr-/- mice, VitD3 + LGG had no effect on DSS colitis. In Vdr+/+ mice, VitD3 + p40 also reduced colitis severity according to clinicopathological and immunological metrics and increased VDR expression and epithelial proliferation (P < .05). In HCT116 cells, p40 stimulation increased VDR protein expression and viability (P < .05).
VitD3 and LGG/p40 synergistically improve the severity of colitis by increasing colonic VDR expression and promoting colonic epithelial proliferation.
Lay Summary
There is increasing evidence that vitamin D and its associated pathways may be a helpful adjunct to inflammatory bowel disease therapies. This experimental study shows that vitamin D may synergize with the probiotic Lactobacillus rhamnosus GG for enhanced therapeutic effect.
Vitamin D levels are correlated with inflammatory bowel disease activity, but vitamin D supplementation does not translate into clinical benefit.
Vitamin D synergizes with the probiotic Lactobacillus rhamnosus GG to not only raise circulating active vitamin D levels, but also increase vitamin D receptors on the colonic epithelium to improve the severity of experimental colitis.
Both vitamin D and probiotics are likely to be very safe to administer clinically, so finding optimal synergistic combinations of vitamins and probiotics that relieve the symptoms of colitis could be a relatively easy path to clinical translation.
Introduction
Inflammatory bowel disease (IBD) describes a group of chronic and immune-mediated intestinal diseases, mainly ulcerative colitis and Crohn’s disease. While the pathogenesis of IBD is still incompletely understood, it is thought to involve an abnormal immune response to intestinal commensal bacteria on a background of genetic susceptibility and environmental factors. Changes in social economics and the Westernization of lifestyles have contributed to a marked increase in IBD incidence in Asian countries, including in China. This disabling and incurable disease seriously affects young and middle-aged patients and incurs a huge burden on the individual and society.
In addition to its classical regulation of calcium and phosphorus metabolism, the vitamin D (VitD)/VitD receptor (VDR) signaling pathway has important anti-infection, immune regulation, and antitumor effects. We previously showed that IBD patients are prone to VitD insufficiency and deficiency, with serum total 25-hydroxyvitamin D [T-25(OH)D] levels negatively correlated with disease activity.1 It has also recently been shown that low serum 25(OH)D predicts primary and secondary failure to vedolizumab (an anti-integrin α4β7 therapy) in IBD patients, further suggesting a disease-modifying effect.2 While VitD supplementation alleviates acute colitis in mice by enhancing intestinal mucosal barrier function and regulating innate immunity,3,4 this finding has so far not successfully been translated to the clinic. Indeed, our previous study found that supplementation with regular-dose VitD effectively treated hypovitaminosis D but failed to reduce disease activity in IBD patients.5 However, super high-dose VitD was recently shown to reduce the need for infliximab dose escalation and decrease inflammatory markers in Crohn’s disease patients,6 with decreased VDR expression in colonic epithelium proposed as the main cause. Intestine-specific VDR knockout mice were more sensitive to dextran sulfate sodium (DSS)–induced colitis, and upregulation of VDR expression effectively relieved this acute colitis.7 Furthermore, IBD patients have significantly decreased colonic VDR expression, which was negatively correlated with the histopathological colonic injury score.8,9 Therefore, both VitD levels and VDR expression seem to be important for achieving efficacy with VitD treatment in IBD patients. The question now remains how to best activate this signaling axis to achieve therapeutic benefit.
Lactobacillus rhamnosus GG (LGG), a popular probiotic, can upregulate VDR expression in the colonic epithelium.10 However, IBD patients have significant gut microbiota disorders, especially a decreased relative abundance of probiotics such as Lactobacillus, Bifidobacterium, and butyrate-producing bacteria.11,12 Therefore, increasing the abundance of LGG might be expected to increase VDR expression, thereby promoting the protective effect of VitD in IBD patients. As the main LGG secretory protein, p40 inhibits apoptosis and promotes epithelial cell proliferation, enhances mucosal barrier function, and exerts an anti-inflammatory effect.13-16
It has been shown that VitD combined with L. reuteri effectively reduces bronchial inflammation without toxicity in children with allergic asthma. There are little data on whether this combination therapy similarly reduces intestinal inflammation. One study has shown that combined VitD and L. reuteri plus krill oil reduces gut inflammation in vitro and in vivo.17 However, the degree of intestinal protection afforded by VitD combined with Lactobacillus and the specific underlying mechanisms remain unclear. We therefore hypothesized that the combination of VitD with LGG or p40, the main protein effector of LGG, has a synergistic protective effect in IBD by raising circulating VitD levels and promoting colonic VDR expression. To test this hypothesis, we first verified the protective effect of combined VitD and LGG in DSS-induced colitis in mice and then interrogated the specific protective effects of p40 to further explore the underlying mechanism.
Methods
Mice and Interventions
Male Vdr+/+ and Vdr-/- mice (6-8 weeks of age) on a C57BL/6 background were fed a standard laboratory diet (VitD 2.2 IU/g, calcium 1%, phosphorus 0.67%, lactose 0%) and high-lactose diet (VitD 2.2 IU/g, calcium 2%, phosphorus 1.25%, lactose 20%), respectively. Both feeds were purchased from Beijing Keao Xieli Feed Co, Ltd, who specifically manufactured the high-lactose formulation.
Vdr+/+ mice were randomly divided into 5 groups (n = 5): control, DSS, DSS + VitD3, DSS + LGG, and DSS + VitD3 + LGG. Vdr-/- mice were randomly divided into 3 groups (n = 3-5): control, DSS, and DSS + VitD3 + LGG. Mice were treated with 2.5% (w/v) DSS (MP Biomedicals) in their drinking water for 5 days to establish the acute colitis model. Then, VitD3 (Ddrops) 100 IU or 1.95 × 10⁸ colony-forming units LGG (BNCC 136673M; American Type Culture Collection 53103) were gavaged according to group from 7 days pre-DSS modeling to 6 days post-DSS modeling. Likewise, Vdr+/+ mice were also randomly divided into 5 groups (n = 4-5): control, DSS, DSS + VitD3, DSS + p40, and DSS + VitD3 + p40. VitD3 100 IU by gavage or p40 20 μg by enema were administered according to group from the day 1 of DSS modeling to 1 day after DSS modeling. p40 was synthesized and identified by Huatai Yikang Company.
All mice were euthanized and the distal colons and rectums were harvested. The distal 1 cm of rectum was embedded for tissue sections for histopathological assessment, and the next 2 cm of distal colon was split into 2 pieces along the longitudinal axis for quantitative real-time polymerase chain reaction (qRT-PCR) and Western blot analysis, respectively. The disease activity index (DAI)18 or histological score was evaluated by an independent investigator.19
The Experimental Animal Ethics Committee of the Peking Union Medical College Hospital (XHDW-2019-035) approved the study protocol.
Cell Line and Interventions
The HCT116 human colon cancer cell line was purchased from the American Type Culture Collection and maintained in RPMI-1640 (Hyclone Laboratories Inc) supplemented with 10% fetal bovine serum (Invitrogen) and 1% penicillin-streptomycin. To assess the effects of p40 on total VDR protein expression, 5 × 10⁵ cells were seeded onto 6-well plates and incubated for 24 hours to attach, before being treated with different concentrations of p40 (0, 10, 20, 50, 100, and 200 ng/mL) for 48 hours or with p40 100 ng/mL for different durations (0, 6, 12, 24, 36, and 48 hours). To test the effects of p40 on nuclear and cytoplasmic VDR expression, 1 × 10⁶ cells were seeded onto a 6-cm cell culture dish and incubated for 24 hours to attach before being treated with p40 100 ng/mL for 48 hours.
MTT Assay
The MTT assay was used to evaluate cell viability in vitro. In 96-well plates, 2 × 10³ cells were seeded and the medium was replaced with serial dilutions of p40 (0-100 ng/mL)-containing medium after 24 hours. Then, the cells were incubated at 37°C for an additional 24, 48, and 72 hours before adding 100 μL MTT (1.0 mg/mL) to each well for 4 hours and measuring the absorbance at 490 nm with a microplate reader 10 minutes after the MTT was replaced with dimethyl sulfoxide.
Serum T-25(OH)D Levels
Retro-orbital blood was collected, and serum T-25(OH)D levels were measured with a Roche E601 automatic chemiluminescence analyzer at the Department of Clinical Laboratory, Peking Union Medical College Hospital.
Quantitative RT-PCR
Total RNA was isolated from colonic tissue with TRIzol reagent (Invitrogen) and reverse transcribed into complementary DNA using the Maxima first strand complementary DNA synthesis kit (Thermo Fisher Scientific). qRT-PCR was performed in triplicate with a S1000 PCR thermocycler (Bio-Rad). The results were presented as the ratio of the relative absorbance of target gene/glyceraldehyde-3-phosphate dehydrogenase (GAPDH) (2-∆∆CT). Primer sequences are presented in Supplementary Table 1.
Western Blotting
Total protein was extracted from mouse colonic tissue and HCT116 cells with RIPA lysis buffer containing proteinase and phosphatase inhibitors. Nuclear and cytoplasmic protein were extracted with the nucleoprotein-cytoplasmic protein extraction kit (Thermo Fisher Scientific). The protein concentration was determined with the bicinchoninic acid protein assay kit (Applygen). Equal amounts of protein were separated on 10% sodium dodecyl sulfate–polyacrylamide gel electrophoresis gels and transferred to polyvinylidene fluoride membranes. The membranes were blocked with 5% bull serum albumin or nonfat milk for 1 hour before incubation with primary antibodies targeting VDR (1:500, sc-13133; Santa Cruz Biotechnology), β-actin (1:10 000, ab6276M; Abcam), GAPDH (1:1000, TA-08; ZSGB BIO), lamin A/C (1:2000, #4777; Cell Signaling Technology), and α-tubulin (1:10000, 66031-1-1g; ProteinTech) overnight at 4°C. Then, the membrane was incubated with horseradish peroxidase–linked secondary antibodies and proteins were visualized using enhanced chemiluminescence (Thermo Fisher Scientific) on a LAS-4000 fluorescent chemiluminescence imager (Fujifilm). The housekeeping genes β-actin or GAPDH, lamin A/C, and α-tubulin were used as internal controls for total VDR, nuclear VDR, and cytoplasmic VDR proteins, respectively.
Immunohistochemistry
Slides were incubated with primary antibodies targeting VDR (1:100, sc-13133; Santa Cruz Biotechnology) and Ki-67 (1:200, #12202; Cell Signaling Technology) at 4°C overnight, incubated with Polymer Detection System reagents (PV-9000; ZSGB BIO), visualized with DAB (ZLI-9019; ZSGB BIO), and counterstained with hematoxylin. The positively stained cells were counted in 10 randomized fields (×40) under a light microscope by 2 experienced pathologists. The VDR immunohistochemistry (IHC) score was calculated as the mean positive cell percentage and degree of staining, while the Ki-67 index was the mean Ki-67-positive colonic epithelial cells per crypt.
Terminal Deoxynucleotidyl Transferase Mediated dUTP Nick End Labeling Assay
Apoptotic cells were detected with the terminal deoxynucleotidyl transferase mediated dUTP nick end labeling (TUNEL) BrightGreen Apoptosis Detection Kit (Vazyme Biotech Co, Ltd) following the manufacturer’s guidelines. Apoptotic cells were labeled with FITC-12-dUTP. Slides were counterstained with DAPI and the cells were observed by fluorescence microscopy. The TUNEL index was the average number of TUNEL-positive colonic epithelial cells in 3 random high-power fields.
Statistical Analyses
All data are expressed as mean ± SEM. The independent-sample t test was performed for comparisons between 2 groups. Analysis of variance was used for comparisons between multiple groups, and the least significant difference and Games-Howell tests were used to further compare intergroup variables with consistent or inconsistent homogeneity of variance, respectively. The outlier detection was performed by the ROUT method with maximum desired false discovery rate (Q) equal to 1%. All P values were 2-sided, and a P < .05 was considered statistically significant. Statistical analyses were performed using GraphPad Prism 8.0.2 (GraphPad Software). Gel Pro analyzer (Media Cybernetics) was used for semi-quantitative optical density analysis of Western blot bands.
Results
VitD3 and LGG Synergize to Alleviate DSS-Induced Colitis in Vdr+/+ Mice
We first compared the protective effects of VitD3 and LGG alone or in combination on DSS-induced colitis in Vdr+/+ mice. The relative body weights of control, DSS, DSS + VitD3, DSS + LGG, and DSS + VitD3 + LGG mice were 104.5 ± 1.0%, 87.9 ± 2.0%, 86.0 ± 1.9%, 94.6 ± 2.3%, and 88.2 ± 1.9%, respectively. DSS mice were significantly lighter than control mice (P < .001), and administration of LGG (but not VitD3 and VitD3 + LGG; all P > .05) significantly restored the body weight compared with DSS mice (P = .019) (Figure 1A). The DAI scores were 0.0 ± 0.0 points, 3.7 ± 0.2 points, 3.4 ± 0.2 points, 2.7 ± 0.4 points, and 2.8 ± 0.3 points, respectively. Compared with the control group, the DSS group had a higher DAI score (P < .001), and compared with the DSS group, the DAI score decreased in the DSS + LGG group (P = .004) and DSS + VitD3 + LGG group (P = .01) but not in the DSS + VitD3 group (P > .05) (Figure 1B).
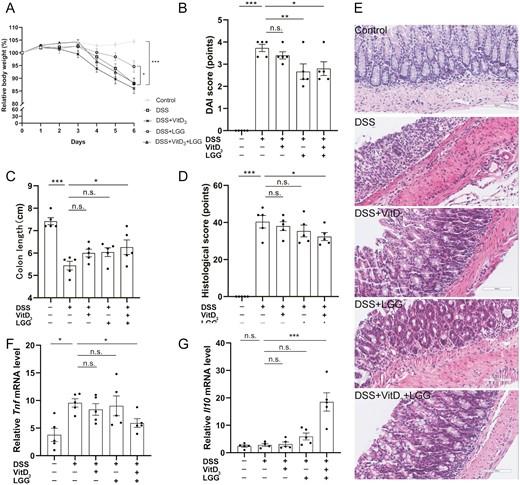
Comparison of colitis severity in Vdr+/+ mice treated with vitamin D3 (VitD3) or Lactobacillus rhamnosus GG (LGG). A, Relative body weight change from baseline to day 6. B, Disease activity index (DAI) scores on day 6. C, Colon length. D, Histological scoring of colon tissue. E, Hematoxylin and eosin–stained colon tissue sections from mice (×200). F and G, Colonic Tnf messenger RNA (mRNA) levels and colonic Il10 mRNA levels by quantitative real-time polymerase chain reaction with Gapdh as the internal reference. Data shown are mean ± SEM. P > .05 was considered nonsignificant (n.s.). *P < .05, **P < .01, ***P < .001. n = 5. DSS, dextran sulfate sodium.
Colon lengths were 7.4 ± 0.2 cm, 5.4 ± 0.2 cm, 6.0 ± 0.2 cm, 6.0 ± 0.2 cm, and 6.3 ± 0.3 cm, respectively. Compared with the control group, colons were significantly shorter in the DSS group (P < .001), and VitD3 + LGG (P = .014) (but not VitD3 and LGG alone; P > .05) significantly increased colon length compared with the DSS group (Figure 1C; Supplementary Figure 1D).
The histological scores were 0.0 ± 0.0 points, 40.4 ± 3.4 points, 38.0 ± 2.4 points, 35.4 ± 3.2 points, and 32.4 ± 2.2 points, respectively. Histological scores were significantly higher in the DSS group than the control group (P < .001), and, compared with the DSS group, the histological score was significantly decreased by VitD3 + LGG (P = .036) but not by VitD3 or LGG alone (P > .05) (Figure 1D, E).
Colonic cytokine expression was next measured by qRT-PCR. Colonic Tnf messenger RNA (mRNA) levels were 3.8 ± 1.2, 9.6 ± 0.8, 8.4 ± 1.1, 9.0 ± 1.8, and 5.9 ± 0.8, respectively. Compared with the control group, colonic Tnf mRNA levels were significantly increased by DSS treatment (P = .016), and VitD3 + LGG (but not by VitD3 and LGG alone; P > .05) significantly decreased colonic Tnf mRNA levels compared with the DSS group (P = .028) (Figure 1F). Colonic Il10 mRNA levels were 2.4 ± 0.4, 2.8 ± 0.5, 3.2 ± 0.8, 5.9 ± 1.3 and 18.5 ± 3.3, respectively. Compared with the DSS group, colonic Il10 mRNA levels were significantly higher in the DSS + VitD3 + LGG group (P < .001) but not in the DSS + VitD3 and DSS + LGG groups (P > .05) (Figure 1G). There were no significance differences in colonic Il1b mRNA (Supplementary Figure 1A) or Il6 mRNA levels (Supplementary Figure 1B) in the DSS + VitD3, DSS + LGG, and DSS + VitD3 + LGG groups compared with the DSS group (all P > .05).
VitD3 and LGG Synergistically Promote Colonic Epithelium VDR Expression in Vdr+/+ Mice
We next explored the mechanism by which VitD3 and LGG synergistically exert their protective effects. In Vdr+/+ mice, serum T-25(OH)D levels were 39.1 ± 1.0 ng/mL, 35.9 ± 2.8 ng/mL, 78.8 ± 4.1 ng/mL, 38.9 ± 4.2 ng/mL, and 92.0 ± 8.7 ng/mL in the control, DSS, DSS + VitD3, DSS + LGG, and DSS + VitD3 + LGG groups, respectively. There was no significant difference in serum T-25(OH)D levels between control and DSS mice (P = .646). Unsurprisingly, compared with DSS mice, serum T-25(OH)D levels were significantly higher in the VitD3 group (P < .001) and the VitD3 + LGG group (P < .001) (Supplementary Figure 1C).
Relative colonic Vdr mRNA levels were 0.5 ± 0.3, 0.2 ± 0.1, 0.4 ± 0.2, 0.1 ± 0.1, and 1.0 ± 0.6, respectively. There was no difference in relative colonic Vdr mRNA levels between the control and DSS groups (P > .05). However, compared with the DSS group, colonic Vdr mRNA levels were significantly increased in mice treated with VitD3 + LGG (P < .001), with no significant changes observed in the groups treated with VitD3 or LGG alone (P > .05) (Figure 2A). In the control group, VDR protein was highly expressed and widely distributed in the nucleus, cytoplasm, and cell membrane of colonic epithelial cells (Figure 2D). Relative expression of total colonic VDR protein was 2.6 ± 0.2, 0.9 ± 0.1, 1.1 ± 0.1, 0.8 ± 0.2, and 1.4 ± 0.1, respectively. Compared with the control group, the relative expression of total colonic VDR protein was significantly lower in the DSS group (P < .001). Compared with the DSS group, total colonic VDR protein was significantly increased in mice treated with VitD3 + LGG (P = .037) but not in those treated with VitD3 or LGG alone (P > .05) (Figure 2B, C).
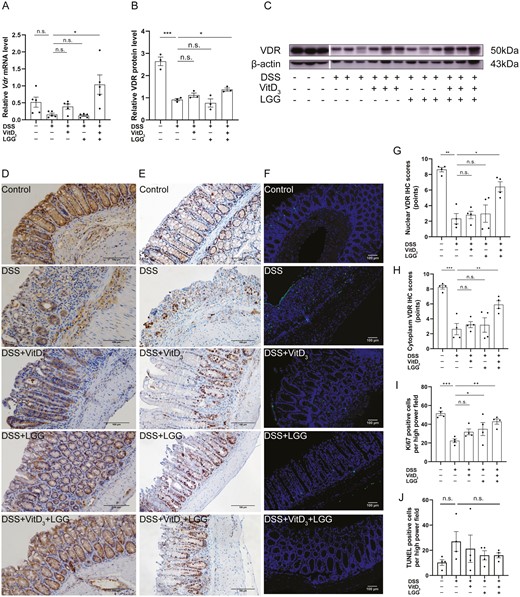
Comparison of vitamin D receptor (VDR) expression, proliferation, and apoptosis in the colonic epithelia of Vdr+/+ mice treated with vitamin D3 (VitD3) or Lactobacillus rhamnosus GG (LGG). A, Colonic Vdr messenger RNA (mRNA) levels by quantitative real-time polymerase chain reaction (qRT-PCR) with Gapdh as the internal reference, n = 5. B, Quantitative analysis of relative colonic VDR protein levels with β-actin as an internal reference, n = 3. C, Colonic VDR protein expression by Western blotting, n = 3. D, Colonic VDR protein expression by immunohistochemistry (IHC) (×200). E, Colonic Ki-67 expression by IHC (×200). F, Colonic apoptotic cells were stained using the terminal deoxynucleotidyl transferase mediated dUTP nick end labeling (TUNEL) assay (×40; TUNEL staining, green; and DAPI staining, blue). Semi-quantitative analysis of (G) colonic epithelial nuclear VDR protein expression, (H) colonic epithelial cytoplasmic VDR protein expression, (I) Ki-67 expression, and (J) TUNEL-positive cells (n = 4). Data shown are mean ± SEM. P > .05 was considered nonsignificant (n.s.). *P < .05, **P < .01, ***P < .001. DSS, dextran sulfate sodium.
Nuclear VDR IHC scores were 8.6 ± 0.3 points, 2.3 ± 0.7 points, 2.8 ± 0.5 points, 3.0 ± 1.1 points, and 6.4 ± 0.6 points, respectively. Cytoplasmic VDR IHC scores were 8.3 ± 0.3 points, 2.6 ± 0.8 points, 3.2 ± 0.4 points, 3.2 ± 1.0 points, and 5.9 ± 0.5 points, respectively. DSS significantly reduced the relative expression of nuclear (P = .004) and cytoplasmic (P < .001) VDR compared with control mice. Compared with the DSS group, the relative expression of nuclear (P = .024) and cytoplasmic (P = .002) VDR were significantly higher in mice treated with VitD3 + LGG but not in those treated with VitD3 or LGG alone (P > .05) (Figure 2D, G, H).
VitD3 and LGG Synergistically Promote Colonic Epithelium Proliferation in Vdr+/+ Mice
In addition to the VDR expression, we also explored whether VitD3 and LGG synergistically exert protective effects by regulating colonic epithelial cell proliferation or apoptosis. In Vdr+/+ mice, the colonic Ki-67 proliferation indices were 51.6 ± 2.3%, 22.4 ± 2.0%, 31.8 ± 3.1%, 34.9 ± 7.0%, and 42.9 ± 2.8% in the control, DSS, DSS + VitD3, DSS + LGG, and DSS + VitD3 + LGG groups, respectively. Compared with control mice, DSS significantly decreased the colonic Ki-67 index (P < .001). Compared with DSS-treated mice, LGG (P = .038) and VitD3 + LGG (P = .002), but not VitD3 alone (P > .05), significantly increased the colonic Ki-67 index (Figure 2E, I).
The average TUNEL indices were 10.3 ± 2.3, 27.0 ± 7.9, 21.3 ± 10.9, 16.0 ± 3.7, and 16.0 ± 2.0 in control, DSS, DSS + VitD3, DSS + LGG, and DSS + VitD3 + LGG groups, respectively. The average TUNEL index was not significantly different between the control and DSS groups (P > .05). Similarly, compared with the DSS group, the average TUNEL index was not significantly different in mice treated with VitD3, LGG, and VitD3 + LGG (P > .05) (Figure 2F, J).
The Synergistic Protective Effect of VitD3 and LGG on DSS-Induced Colitis is Lost in Vdr-/- Mice
Because VitD3 and LGG acted synergistically to exert a protective effect by upregulating VDR expression, we next asked whether VDR knockout would abrogate this protective effect. In Vdr-/- mice, the relative body weights of control, DSS, and DSS + VitD3 + LGG mice were 102.5 ± 0.9%, 83.9 ± 3.6%, and 83.3 ± 1.6%, respectively. DSS mice were significantly lighter than control mice (P < .001), and there was no difference in relative body weight between DSS and DSS + VitD3 + LGG mice (Figure 3A).
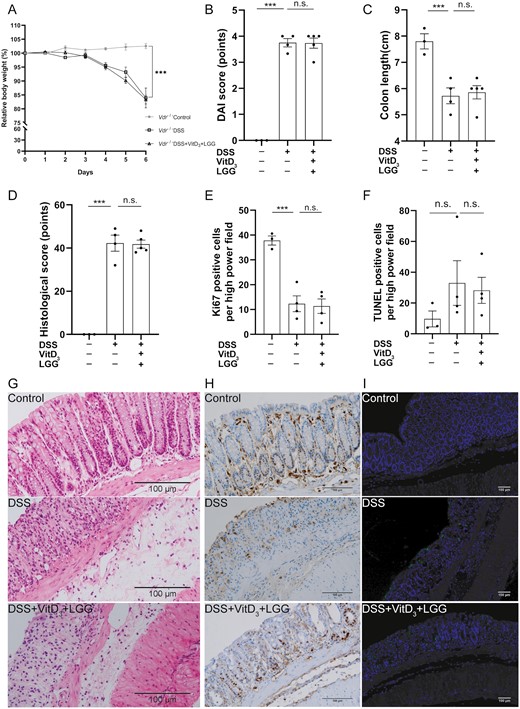
Comparison of colitis severity, proliferation, and apoptosis in the colonic epithelia of Vdr-/- colitis treated with or without vitamin D3 (VitD3) and Lactobacillus rhamnosus GG (LGG). A, Relative body weight change from baseline to day 6. B, Disease activity index (DAI) scores on day 6. C, Colon length. D, Histological score of colon tissue. Semi-quantitative analysis of (E) Ki-67 levels and (F) terminal deoxynucleotidyl transferase mediated dUTP nick end labeling (TUNEL)–positive cells. G, Hematoxylin and eosin–stained colon tissue sections from mice (×200). H, Colonic Ki-67 expression by immunohistochemistry (×200). I, Colonic apoptotic cells were stained using TUNEL assays (×40; TUNEL staining, green; and DAPI staining, blue). Data shown are mean ± SEM. P > .05 was considered nonsignificant (n.s.). ***P < .001. n = 3-5. DSS, dextran sulfate sodium.
DAI scores were 0.0 ± 0.0 points, 3.8 ± 0.2 points, and 3.8 ± 0.2 points in the control, DSS, and DSS + VitD3 + LGG mice, respectively, and the DAI was significantly higher in the DSS group compared with the control group (P < .001) but with no difference between DSS and DSS + VitD3 + LGG mice (P > .05) (Figure 3B).
Colon lengths were 7.8 ± 0.3 cm, 5.7 ± 0.3 cm, and 5.9 ± 0.3 cm in the control, DSS, and DSS + VitD3 + LGG mice, respectively. Colons were significantly shorter in DSS than control mice (P < .001), but there was no difference in colon length between DSS and DSS + VitD3 + LGG mice (P > .05) (Figure 3C).
Histological scores were 0.0 ± 0.0 points, 42.3 ± 3.8 points, and 41.8 ± 1.9 points in the control, DSS, and DSS + VitD3 + LGG mice, respectively, significantly higher in the DSS group compared with the control group (P < .001) but with no difference between DSS and DSS + VitD3 + LGG mice (P > .05) (Figure 3D, G).
Colonic Ki-67 indices were 37.8 ± 1.8%, 12.3 ± 3.2%, and 11.4 ± 2.9%, respectively, significantly lower in DSS mice than control mice (P < .001) but with no difference between DSS and DSS + VitD3 + LGG mice (P > .05) (Figure 3E, H).
There were no significant differences in Tnf, Il1b, Il6, or Il10 mRNA levels (Supplementary Figure 2A-D) or TUNEL indices (Figure 3F, I) between the 3 groups (P > .05).
VitD3 and p40 Synergistically Alleviate DSS-Induced Colitis in Vdr+/+ Mice
Having observed a protective effect of VitD3 combined with LGG against colitis, and because p40 is the main LGG protein, we further explore the protective effect of VitD3 and p40 alone or in combination on DSS-induced colitis in Vdr+/+ mice. The relative body weights of control, DSS, DSS + VitD3, DSS + p40, and DSS + VitD3 + p40 groups were 100.3 ± 0.9%, 75.1 ± 1.6%, 80.2 ± 1.9%, 79.2 ± 1.9%, and 81.4 ± 1.4%, respectively. Compared with the DSS group, the DSS + VitD3 group (P = .036) and DSS + VitD3 + p40 group (P = .012) had significantly higher body weights (Figure 4A).
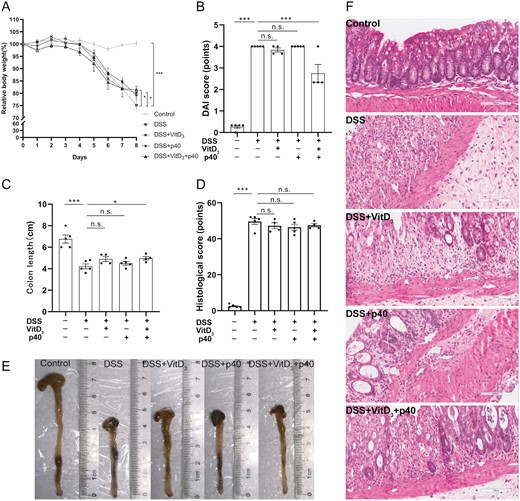
Comparison of colitis severity in Vdr+/+ mice treated with vitamin D3 (VitD3) or p40. A, Relative body weight change from baseline to day 8. B, Disease activity index (DAI) scores on day 8. C, Colon length. D, Histological score from colon tissue. E, Macroscopic appearance of the colon in each group. F, Hematoxylin and eosin–stained colon tissue sections from mice (×200). Data shown are mean ± SEM. P > .05 was considered nonsignificant (n.s.). *P < .05, ***P < .001. n = 4-5. DSS, dextran sulfate sodium.
DAI scores were 0.3 ± 0.1 points, 4.0 ± 0.0 points, 3.8 ± 0.1 points, 4.0 ± 0.0 points, and 2.7 ± 0.4 points in the control, DSS, DSS + VitD3, DSS + p40, and DSS + VitD3 + p40 groups, respectively. Compared with the DSS group, the DSS + VitD3 + p40 group had lower DAI scores (P < .001) (Figure 4B).
Colon lengths were 6.8 ± 0.4 cm, 4.2 ± 0.2 cm, 4.9 ± 0.2 cm, 4.5 ± 0.2 cm, and 5.0 ± 0.3 cm in the control, DSS, DSS + VitD3, DSS + p40, and DSS + VitD3 + p40 groups, respectively. Compared with the DSS group, the colons of DSS + VitD3 + p40 mice were significantly longer (P = .046) (Figure 4C, E).
There was no difference in histological scores (Figure 4D, F) or colonic cytokine mRNA levels (Tnf, Il6, Il1b, and Il10) (Supplementary Figure 3A-D) between the DSS group and the 3 intervention groups (P > .05).
VitD3 and p40 Synergistically Promote Colonic Epithelium VDR Expression in Vdr+/+ Mice
We next explored whether VitD3 and p40 exert their protective effect by upregulating VDR. In Vdr+/+ mice, serum T-25(OH)D levels were 39.2 ± 1.9 ng/mL, 34.5 ± 4.6 ng/mL, 72.7 ± 4.6 ng/mL, 28.1 ± 4.1 ng/mL, and 80.8 ± 5.9 ng/mL in control, DSS, DSS + VitD3, DSS + p40, and DSS + VitD3 + p40 mice, respectively. Compared with the DSS group, serum T-25(OH)D levels were significantly higher in the VitD3 (P < .001) and VitD3 + p40 groups (P < .001) (Supplementary Figure 3E).
Relative colonic Vdr mRNA levels were 1.1 ± 0.3, 0.9 ± 0.2, 4.3 ± 2.9, 4.8 ± 1.3, and 9.9 ± 5 in control, DSS, DSS + VitD3, DSS + p40, and DSS + VitD3 + p40 mice, respectively. There was no difference in relative colonic Vdr mRNA levels between the control and DSS groups (P > .05). Compared with the DSS group, colonic Vdr mRNA levels were significantly increased in the DSS + VitD3 + p40 group (P = .022) but not in mice treated with VitD3 or p40 alone (P > .05) (Figure 5A).
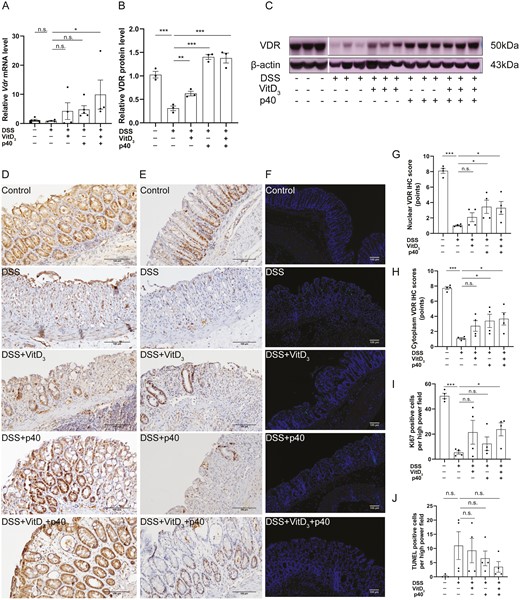
Comparison of vitamin D receptor (VDR) expression, proliferation, and apoptosis in the colonic epithelia of Vdr+/+ mice treated with vitamin D3 (VitD3) or p40. A, Colonic Vdr messenger RNA (mRNA) expression by quantitative real-time polymerase chain reaction (qRT-PCR) with Gapdh as the internal reference, n = 4-5. B, Quantitative analysis of relative colonic VDR protein levels with β-actin as an internal reference, n = 3. C, Colonic VDR protein expression by Western blotting, n = 3. D, VDR protein expression in mouse colonic epithelium by immunohistochemistry (IHC) (×200). E, Ki-67 expression in mouse colonic epithelium by IHC (×200). F, Apoptotic cells were determined using terminal deoxynucleotidyl transferase mediated dUTP nick end labeling (TUNEL) assays (×40; TUNEL staining, green; and DAPI staining, blue). Semi-quantitative analysis of (G) colonic epithelial nuclear VDR protein expression, (H) colonic epithelial cytoplasmic VDR protein expression, (I) Ki-67 expression, and (J) TUNEL-positive cells (n = 4). Data shown are mean ± SEM. P > .05 was considered nonsignificant (n.s.). *P < .05, **P < .01, ***P < .001. DSS, dextran sulfate sodium.
The relative expression of total colonic VDR protein was 1.0 ± 0.1, 0.3 ± 0.1, 0.6 ± 0.1, 1.4 ± 0.1, and 1.4 ± 0.1 in control, DSS, DSS + VitD3, DSS + p40, and DSS + VitD3 + p40 mice, respectively. Compared with the control group, the relative expression of total colonic VDR protein was significantly decreased in the DSS group (P < .001). Compared with the DSS group, total colonic VDR protein expression was significantly increased in DSS + VitD3 group (P = .009), DSS + p40 (P < .001) group, and DSS + VitD3 + p40 group (P < .001). (Figure 5B, C).
Nuclear VDR IHC scores were 8.1 ± 0.3 points, 1.0 ± 0.1 points, 2.1 ± 0.6 points, 3.5 ± 0.9 points, and 3.3 ± 0.8 points in control, DSS, DSS + VitD3, DSS + p40, and DSS + VitD3 + p40 mice, respectively. Cytoplasmic VDR IHC scores were 7.7 ± 0.2 points, 1.1 ± 0.1 points, 2.7 ± 0.7 points, 3.4 ± 0.9 points, and 3.7 ± 0.8 points, respectively. Compared with the DSS group, nuclear and cytoplasmic VDR expression were significantly increased in the DSS + p40 (P = .013 and P = .020, respectively) and DSS + VitD3 + p40 (P = .019 and P = .011, respectively) groups, with no significant change observed in the group treated with VitD3 alone (P > .05) (Figure 5D, G, H).
VitD3 and p40 Synergistically Promote Colonic Epithelium Proliferation in Vdr+/+ Mice
Likewise, we explored whether VitD3 and p40 exert their protective effect by regulating colonic epithelial cell proliferation or apoptosis. In Vdr+/+ mice, colonic Ki-67 indices were 50.4 ± 2.1%, 5.4 ± 1.3%, 21.5 ± 9.5%, 12.3 ± 5.4%, and 23.8 ± 5.2% in control, DSS, DSS + VitD3, DSS + p40, and DSS + VitD3 + p40 mice, respectively. Compared with the DSS group, the colonic Ki-67 index was significantly higher in the VitD3 + p40 group (P = .032) but in not the VitD3 and p40-treated groups (P > .05) (Figure 5E, I).
The average TUNEL indices were 0.3 ± 0.3%, 11.0 ± 4.9%, 9.3 ± 4.3%, 6.5 ± 2.6%, and 3.5 ± 1.9%, respectively. There were no significant differences between control and DSS mice (P > .05). Likewise, compared with DSS mice, the average TUNEL index was not significantly different in the VitD3, p40, and VitD3 + p40 groups (P > .05) (Figure 5F, J).
p40 Promotes Colonic VDR Expression and Colonic Epithelial Proliferation In Vitro
Finally, we attempted to demonstrate the effect of p40 on VDR expression and colonic epithelial cell proliferation in vitro. In the HCT116 cell line, compared with the control cell line, relative VDR protein expression increased after 48 hours of stimulation with p40 50 ng/mL (3.0 ± 1.5 vs 1.0 ± 0.0; P = .037), 100 ng/mL (4.4 ± 1.5 vs 1.0 ± 0.0; P = .037), and 200 ng/mL (3.1 ± 1.1 vs 1.0 ± 0.0; P = .037) (Figure 6A, B), as well as 36 hours (2.4 ± 0.7 vs 1.0 ± 0.0; P = .037), and 48 hours (1.6 ± 0.2 vs 1.0 ± 0.0; P = .037) after stimulation with p40 100 ng/mL (Figure 6C, D). Cell viability as assessed by the MTT assay revealed that HCT116 viability increased after 24 hours of stimulation with 20 ng/mL of p40, 48 hours of stimulation with 1 to 50 ng/mL of p40, and 72 hours of stimulation with 1 to 100 ng/mL of p40 (P < .05) (Supplementary Figure 4).
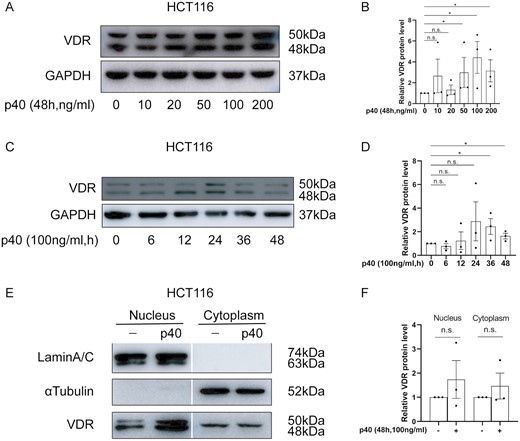
The effect of p40 stimulation on vitamin D receptor (VDR) expression in HCT116 cells. A, VDR protein expression stimulation with after 0 to 200 ng/mL of p40 for 48 hours, B, Semi-quantitative analysis of relative VDR protein levels after stimulation with 0 to 200 ng/mL of p40 for 48 hours, C, VDR protein expression after stimulation with 100 ng/mL of p40 for 0 to 48 hours, D, Semi-quantitative analysis of relative VDR protein levels after stimulation with 100 ng/mL of p40 for 0 to 48 hours, E, Nuclear and cytoplasmic VDR expression by stimulation with 100 ng/mL of p40 for 48 hours with α-tubulin and lamin A/C as the internal references for the nuclear and cytoplasmic fractions of HCT116 cells, respectively. F, Semi-quantitative analysis of relative nuclear and cytoplasmic VDR levels after stimulation with 100 ng/mL of p40 for 48 hours. All analyses were by Western blotting. Data shown are mean ± SEM. P > .05 was considered nonsignificant (n.s.). *P < .05. n = 3.
Discussion
Here we show that (1) colonic VDR expression decreases in DSS colitis in Vdr+/+ mice; (2) the combination of VitD3 and LGG but not VitD3 and LGG monotherapy significantly relieves the symptoms, histology, and inflammatory cytokine levels related to the severity of colitis in Vdr+/+ mice; and (3) as the main secretory protein of LGG, p40 also exerts a similar synergistic anti-inflammatory effect on DSS colitis in combination with VitD3 in Vdr+/+ mice. In exploring the possible mechanisms underlying the synergistic protective effect of VitD3 and LGG/p40, we observed that the combination of VitD3 and LGG/p40 significantly upregulates serum 25(OH)D levels and colonic VDR expression in Vdr+/+ mice, but the protective effect completely disappeared in Vdr-/- mice, suggesting that the anti-inflammatory effects of VitD3 with LGG/p40 depend on the VitD/VDR axis. However, VitD3 and LGG/p40 synergistically increased proliferation and had no effect on apoptosis in Vdr+/+ mice, suggesting that the promotion of colonic epithelial proliferation, rather than protection from apoptosis, is the main mechanism underlying the anticolitis phenotype.
The VitD/VDR pathway plays an important role in maintaining intestinal mucosal homeostasis. However, the VitD/VDR pathway was impaired in mice with DSS colitis, which manifested as decreased serum T-25(OH)D levels and colonic VDR expression. This might be because, as an important enzyme in the VitD3 metabolic pathway during inflammation, CYP24A1 expression increases to consequently degrade 25(OH)D.20 Furthermore, the proinflammatory cytokine tumor necrosis factor α (TNF-α) is also highly expressed in colitis, and it can promote expression of the microRNA miR346, which binds to the VDR mRNA 3ʹUTR, leading to its degradation.21,22 Interestingly, only the combination of VitD3 and LGG synergistically improved DSS colitis by promoting colonic VDR expression. One possible reason for this is that both VitD and LGG can directly enhance VDR expression.10,23,24 VDR is widely expressed in colonic epithelial cells and distributed in the nucleus, cytoplasm, and cell membrane. As a transcription factor, nuclear VDR regulates the transcription of downstream target genes, thereby contributing to the maintenance of intestinal epithelial homeostasis, and VitD3 and LGG synergistically upregulated nuclear VDR expression in the colon. 1,25(OH)2D is the active form of vitamin D which, after binding to VitD response elements on the VDR enhancer, not only promotes VDR transcription, but also prolongs the half-life and increases VDR stability by inhibiting VDR acidification and degradation.23,24Lactobacillus strains have been shown to upregulate VDR levels in cell lines and zebrafish17,25,26 and promote colonic epithelium VDR expression via its soluble secretory protein.10 Another possible reason for synergy is that the combination of VitD3 and LGG indirectly restores VDR expression even in inflammatory states by inhibiting TNF-α expression.22 Although VitD3 monotherapy also increased serum T-25(OH)D, the severely impaired colonic VDR expression in the inflammatory state limited its anti-inflammatory effect. Hence, both increasing serum T-25(OH)D levels and restoring colonic VDR expression play important and synergistic roles in the anti-inflammatory effect through combined VitD3 and LGG treatment.
The combination of VitD3 and LGG was also protective of colonic epithelial cells by promoting their proliferation. Lactobacillus strains can stimulate intestinal epithelial proliferation and induce differentiation,27,28 especially LGG, which increases gut epithelial proliferation via JAK-STAT signaling in a Nox1, leptin, and leptin receptor–dependent manner.29L. acidophilus also supports the regeneration of the intestinal mucosa by rescuing the loss of Lgr5 + stem cells.30 The VDR is highly expressed in Lgr5 + intestinal stem cells and is important for maintaining their proliferation and differentiation.31 In addition, VDR is also widely expressed in immune cells such as macrophages and dendritic cells,32 and 1,25(OH)2D can inhibit the secretion of TNF-α by macrophages and promote the secretion of IL-10 by dendritic cells.33,34 All of these pathways may therefore contribute to the positive effects of combined treatment, and further work is required to dissect their relative contributions.
p40 is the main, 412-amino acid, 42-kDa soluble protein secreted by LGG.14 p40 is presumed to be the active component of LGG that promotes colonic VDR expression. Recently, Lu et al35 found that 5 Lactobacillus strains could promote colonic VDR expression in vivo, and p40 restored VDR expression in murine ileal organoids after TNF-α stimulation. Our study not only confirmed the effect of upregulating VDR expression and promoting cell proliferation in vitro, but also verified a synergistic protective effect for p40 combined with VitD3 in vivo. Immunoprecipitation and mass spectrometry analyses have shown that secreted LGG proteins can bind to human colonic VDR.10 Colonic VDR expression undergoes complex regulation at the transcriptional, translational, and post-translational levels, and our study effectively showed that nuclear VDR expression was upregulated by p40. As a transcription factor, VDR nuclear localization is critical to transcriptional regulation, hence the mechanism by which p40 promotes VDR nuclear localization is worthy of further study. In addition, p40 also can activate EGFR/Akt signaling, promote proliferation, and inhibit apoptosis of colonic epithelial cells, all of which might contribute to the protective effect.14,36
To our knowledge, this is the first attempt to combine VitD and probiotics to treat colitis in mice, and we successfully demonstrate their synergistic protection by promoting colonic VDR expression and colonic epithelial cell proliferation in DSS colitis. We also provide proof that p40 is the active component of probiotic LGG. Our study provides the basis for further clinical studies of combined VitD and LGG in IBD patients. Furthermore, the use p40 instead of probiotics might maximize the beneficial effects if dose-optimized and simultaneously avoid the risk of bacteremia from live probiotics, especially in the context of the impaired intestinal mucosal barrier in IBD patients.
Compared with the standard diet of VitD 2.2 IU/g, calcium 1%, phosphorus 0.67%, and lactose 0% for Vdr+/+ mice, Vdr-/- mice were fed VitD 2.2 IU/g plus a diet high in calcium (2%), phosphorus (1.25%), and lactose (20%) to maintain normocalcemia and normophosphatemia without an effect on serum 25(OH)D and 1,25(OH)2D3 levels. In this way, mice were not susceptible to hyperparathyroidism, osteomalacia, or rickets induced by the mutation, and the body weight and bone formation were normalized.37-39
There are several limitations to our study. There is no “ideal” mouse model of IBD, but the 5-day DSS-related acute colitis mice model is widely used in IBD research. Nevertheless, we accept that our results require further verification in chronic/heterogeneous mouse models or in clinical trials based on the excellent safety of VitD and LGG. The efficacy seen in our experiments may represent both prevention and treatment effects, as the intervention was from 7 days premodeling to 6 days postmodeling, a protocol chosen to avoid the risk of bacteremia caused by simultaneous LGG and DSS administration. While we used the HCT116 colon cancer cell line for in vitro assessment of epithelial proliferation and apoptosis, it would also be useful to conduct further mechanistic experiments using authentic in vitro models of IBD, such as patient-derived colonic organoids.
Conclusions
We combined VitD3 and the probiotic LGG and found that they exert a synergistic protective effect to alleviate DSS colitis in mice by promoting colonic VDR expression and colonic epithelial cell proliferation. p40, as the main effector protein of LGG, is likely to be the real protagonist protecting the colon in this probiotic treatment. VitD and probiotics are likely to be acceptable to both patients and medics as an additional therapy, so verification of their synergy in a clinical trial in parallel with standard care could now be considered.
Acknowledgments
We are grateful to Xu Han, MD (Division of Gastroenterology, Department of Internal Medicine, Michigan Medicine, University of Michigan, Ann Arbor, Michigan, USA; now working at the Department of Gastroenterology, Shanghai Ninth People’s Hospital, Shanghai Jiaotong University School of Medicine, Shanghai, China), for her guidance with respect to research of LGG/p40.
Author Contribution
DC conducted the experiments, was involved in data collection and analysis, and drafted the article. HT was involved in data collection and analysis and drafted the article. YL was involved in data collection and analysis and revised the article. HY was involved in study design and data analysis and interpretation and revised the article. HW was involved in study design and data analysis and interpretation and revised the article. BT was involved in study design and data analysis and interpretation, drafted and revised the article, and was involved in funding support. JQ was involved in study design and data analysis and interpretation, revised the article, and was involved in funding support. All authors read and approved the final article.
Funding
This study was supported by the General Program of Natural Science Foundation of Beijing Municipality (No.7192172), the Youth Program of National Natural Science Foundation of China (No.82000526), and the Health Research & Special Projects Grant of China (No.201002020, No.201502005). The funders played no role in study design, data collection and analysis, decision to publish, or preparation of the manuscript.
Conflicts of Interest
All authors declare no conflicts of interest.
Data Availability
The data underlying this article are available in the article and supplementary material. Specific data underlying this article are available on request to the corresponding author.

