


Abstract
Surgery rates in patients with Crohn’s disease have decreased during the last few decades, and use of antitumor necrosis agents (anti-TNF) has increased. Whether these changes correlate with a decreased probability of stoma is unknown. The objective of this study was to investigate the incidence of stoma in patients with Crohn’s disease over time.
Through linkage of national registers, we identified patients who were diagnosed with Crohn’s disease in 2003–2014 and were followed through 2019. We compared formation and closure of stomas over the calendar periods of diagnosis (2003–2006, 2007–2010, and 2011–2014).
In a nationwide cohort of 18,815 incident patients with a minimum 5 years of follow-up, 652 (3.5%) underwent formation of a stoma. This was mostly performed in conjunction with ileocolic resection (39%). The 5-year cumulative incidence of stoma formation was 2.5%, with no differences between calendar periods (P = .61). Less than half of the patients (44%) had their stoma reversed. Stomas were more common in elderly-onset compared with pediatric-onset disease: 5-year cumulative incidence 3.6% vs 1.3%. Ileostomies were most common (64%), and 24.5% of the patients who underwent stoma surgery had perianal disease at end of follow-up. Within 5 years of diagnosis, 0.8% of the incident patients had a permanent stoma, and 0.05% had undergone proctectomy. The time from diagnosis to start of anti-TNF treatment decreased over calendar periods (P < .001).
Despite increasing use of anti-TNF and a low rate of proctectomy, the cumulative incidence of stoma formation within 5 years of Crohn’s disease diagnosis has not decreased from 2003 to 2019.
Introduction
Crohn’s disease (CD) is a chronic inflammatory disorder of the digestive tract that can lead to stricturing and penetrating complications requiring surgical treatment.1 Over the past few decades, the pharmacological treatment of CD has evolved with increasing use of immunomodulators (IMM) and biologic agents, and among them mainly antitumor necrosis factor agents (anti-TNF), paralleled with decreasing rates of abdominal surgery.2–4 To what extent the new treatment regimens have influenced patients’ risk of getting a stoma has been less investigated in incident population-based cohorts. Studies including data on temporal trends regarding stoma in patients with CD have reported conflicting results with deceasing,5–9 increasing,10–12 and unchanged13,14 stoma rates over time.
Temporary stomas are formed to alleviate symptoms while waiting for the effect of new medication or in conjunction with surgery to reduce the risk of intra-abdominal septic complications, whereas a permanent stoma often is related to severe perianal CD. In the past, the cumulative incidence of permanent stoma has been reported to be 10% for all CD patients and 30% to 50% for patients with complex perianal CD.15–17 The use of anti-TNF could potentially decrease the risk of stoma by inducing remission and thereby obviating the need for a stoma. On the other hand, postponing surgery while trying different medical regimens may increase the risk of surgical complications, as disease refractory to therapy progresses and becomes more complex underway, thereby inducing a need of formation of a temporary stoma.10,18
Decreasing stoma rates would implicate an important disease-modifying effect of modern therapeutic strategy, which is especially important as the fear of getting a stoma is one of the main worries for patients with CD.19 We aimed to investigate if the more active pharmacologic treatment of patients with CD during the beginning of the 21st century has been accompanied by a decrease in incidence of stoma.
Methods
Study Design
In this cohort study, we estimated occurrence of stoma in incident patients with CD by year of first CD diagnosis.
Setting
In Sweden, health care is tax-funded with universal access to care.20 Patients with CD are cared for at hospital-based outpatient and inpatient facilities and have access to modern drugs used in inflammatory bowel disease.21,22
Data Sources
The personal identity number assigned to all residents allows for linkage of registers containing national data on demographics, morbidity, and histopathology. We used data from the Total Population Register,23 the Swedish National Patient Register,24 the ESPRESSO pathology Database,25 the Prescribed Drug Register,26 and the Swedish Quality Register for Inflammatory Bowel Disease (SWIBREG).27
Participants
We used diagnostic coding K50 to identify incident cases with CD January 1, 2003, to December 31, 2014. We requested either ≥2 records of CD in the National Patient Register (NPR)27 or ≥1 record of CD in NPR plus a colorectal biopsy record from the Swedish ESPRESSO Biopsy cohort showing inflammation (D6216/M41/M42/M43/M44/M47/M463 combined with topography code T67/T68), or a first record of CD in conjunction with intestinal surgery. In order to restrict the study population to incident cases of CD, we excluded individuals with any inflammatory bowel disease diagnosis (including ulcerative colitis or inflammatory bowel disease unclassified, [IBD-U]) before the first diagnosis of CD28 and patients with previous intestinal surgery (except appendectomy).
Variables
We used surgical procedure codes from the NPR to define formation of ileostomy, colostomy, or stoma of unknown location (Table S1). Other procedures performed in association with stoma formation were classified as (1) small bowel resection, (2) ileocolic resections (encompassing procedures coded as ileocecal, ileocolic resection, or right-sided hemicolectomy, (3) segmental resection of colon or rectum, (4) colectomy, (5) proctectomy, and (6) other procedures listing stoma formation as only procedure.4 We defined permanent stoma as either stoma in combination with proctectomy or nonclosure within 2 years of formation of stoma.
Crohn’s disease with or without perianal manifestations was determined by both diagnostic ICD-codes for perianal manifestations of the disease (positive predictive value [PPV] of 83%29) and proctological procedure codes (PPV of 100%30) in the NPR. Other subcategories of CD according to the Montreal classification cannot be ascertained with enough precision by coding in NPR.
Information on drug use was taken from the Swedish Quality Register for Inflammatory Bowel Disease and from Anatomic Therapeutic Chemical (ATC) classification system codes in the Prescribed Drug Register (PDR) from 2005, which was the year both these registers started, and in the NPR from 2007, which was the year infusions of infliximab started to be registered in NPR in Stockholm County (representing 20% of the Swedish population).31
Supplementary Analysis
In a separate analysis of time to first stoma surgery from 1990 to 2017, we used the NPR to identify patients with CD by date of first intestinal surgery (ie, a diagnostic code for CD in combination with a diagnostic code for intestinal surgery). This is thus a subpopulation of CD patients with a disease more prone to complications warranting abdominal surgery.
Statistical Methods
Follow-up started at fulfilment of diagnostic inclusion criteria. Stratification for age (younger than 17 years, 17 to 39 years, 40 to 59 years, and 60 years and older) and calendar year of CD onset (2003–2006, 2007–2010, and 2011–2014) were based on the date of the first diagnostic record. Follow-up ended at death, emigration, or December 31, 2019, whichever came first.
We compared characteristics of patients diagnosed during different calendar periods using Student t test, χ 2 test, or Wilcoxon rank-sum test, as appropriate. We describe occurrence of stoma during follow-up as cumulative incidence within 1, 3, and 5 years of diagnosis.
We used a Cox proportional hazards model to estimate univariable and multivariable hazard ratios for (1) stoma construction within 5 years of CD diagnosis and (2) nonreversal of stoma within 2 years of creation, adjusted for sex, age, year of disease onset, and perianal disease (yes or no). Use of anti-TNF during follow-up was included as a time-varying covariate. Univariable and multivariable hazard ratios (HRs) are presented with 95% confidence intervals (CIs).
We compared time to stoma and stoma reversal between calendar periods in a Kaplan Meier model with stratification for age of disease onset and perianal manifestations. Unadjusted differences between calendar periods were compared with the log-rank test. In estimations of time to stoma closure, follow-up started at the date of formation of stoma. In estimations of time to start of anti-TNF treatment, the patients were grouped by calendar years: 2007–2009, 2010–2011, and 2012–2014, due to reduced availability of data regarding therapies given as infusions prior to year 2007.
We also assessed time to first stoma surgery using NPR data only from 1990 and onward. In these estimations, follow-up started at date of first intestinal surgery (due to lack of information on date of first CD diagnosis as outpatient visit).
All statistical tests were 2-sided, and P < .05 was considered statistically significant. We used statistical software from SAS (version 9.4; SAS Institute Inc., Cary, NC, USA) and STATA (version 16; StataCorp LP, College Station, TX, USA).
Ethics
The regional ethics committee in Stockholm approved the study (DNR 2007/785-31/5; 2011/1509-32; 2012/601-32; 2015/0004-31; 2015/615-32; 2014/1287-31/4). Because this was a register study, consent from the patients was not necessary.
Results
Characteristics of the Study Population
We identified 18,815 patients with incident CD and no previous abdominal surgery from 2003 to 2014 (Figure S1). The median age at diagnosis was 39 years, 53% were women, and 12% were children (Table 1). Median follow-up was 9.6 years (minimum to maximum: 0–17). At end of follow-up, 9.5% had perianal disease as tracked by diagnostic ICD codes or proctological procedure codes; 36% had been treated with immunomodulators, and 17% with anti-TNF. In the whole cohort, 652 (3.5%) of the patients underwent stoma surgery, and 0.05% underwent proctectomy (data not shown).
Characteristics of incident patients with Crohn’s disease 2003–2014, followed through 2019.
| Variable | All Patients With Incident Crohn’s Disease | Patients With Stoma During Follow-Up | Pa |
|---|---|---|---|
| N | 18,815 | 652 | |
| Calendar period of Crohn’s disease diagnosis | |||
| 2003–2006 | 6 238 (33.2%) | 254 (39.0%) | <0.001 |
| 2007–2010 | 6 309 (33.5%) | 228 (35.0%) | |
| 2011–2014 | 6 268 (33.3%) | 170 (26.1%) | |
| Sex, n (%) | |||
| Females | 9 906 (52.6%) | 310 (47.5%) | 0.01 |
| Males | 8 909 (47.4%) | 342 (52.5%) | |
| Age at diagnosis, years | |||
| Mean (SD) | 41.9 (21.7) | 44.5 (21.5) | 0.003 |
| Median (IQR) | 39.0 (23.4–59.3) | 46.8 (24.1–61.6) | 0.003 |
| Categories, n (%) | |||
| <17y | 2 176 (11.6%) | 74 (11.3%) | <0.001 |
| 17–<40y | 7 496 (39.8%) | 204 (31.3%) | |
| 40–<60y | 4 583 (24.4%) | 190 (29.1%) | |
| ≥60y | 4 560 (24.2%) | 184 (28.2%) | |
| Perianal disease at diagnosis, n (%) | 939 (5.0%) | 82 (12.6%) | <0.001 |
| Perianal disease at end of follow-up, n (%) | 1 783 (9.5%) | 160 (24.5%) | <0.001 |
| Pharmacological treatment at end of follow-upb n (%) | |||
| Immunomodulators | 6 855 (36.4%) | 278 (42.6%) | 0.001 |
| TNF inhibitors | 3 200 (17.0%) | 172 (26.4%) | <0.001 |
| Follow-up time (first of death, emigration, first stoma surgery, or Dec 31, 2019), years | |||
| Mean (SD) | 9.6 (4.3) | 3.7 (4.0) | <0.001 |
| Median (IQR) | 9.6 (6.5–13.1) | 2.4 (0.2–5.9) | <0.001 |
| Range, min-max | 0.0–17.0 | 0.0–16.2 | NA |
Abbreviations: IQR, interquartile range; N, number; SD, standard deviation
aStudent t test, χ 2 test, or Wilcoxon rank-sum test, as appropriate
bInformation on drug use was abstracted from the Swedish quality register for inflammatory bowel disease SWIBREG (from 2005), and from Anatomic Therapeutic Chemical classification system (ATC) codes in the Prescribed Drug register (from 2005) and the National Patient Register (from 2007). Information available only from 2005 and onward.
Characteristics of Patients Undergoing Stoma Surgery
Among the patients who received a stoma during follow-up, median time to first stoma was 2.4 years, 53% were men, and the median age at diagnosis was 47 years. At end of follow-up, 24.5% had perianal disease, 43% had been treated with immunomodulators, and 26% had been treated with anti-TNF. Ileostomies were more frequent than colostomies, encompassing 64% of all stomas. The most common procedures associated with formation of a stoma were ileocolic resection (39%), followed by colectomy (29%), and resection of colon or rectum (26%); proctectomy was uncommon (1.5%; data not shown). Of all patients receiving a stoma, 44% later had their bowel continuity restored afterward (median, 0.6 years). The absolute majority (88%) of the reversal procedures were performed within 2 years of stoma creation (Figure 2).
Incidence of Stoma
The cumulative incidence of stoma was similar across calendar periods (log rank test, P = .61; Figure 1). The 1-, 3-, and 5-year cumulative incidence of any stoma was 1.3%, 1.9%, and 2.5%, respectively (Table 2). The cumulative incidence of stoma at 5 years was higher in patients with elderly-onset (60 years and older) than in pediatric-onset disease (younger than 17 years): 3.6% vs 1.3%. Formation of a stoma was more common in patients with perianal manifestations at time of diagnosis: 5.9% had a stoma within 5 years compared with 2.3% of patients without perianal disease (Table 2).
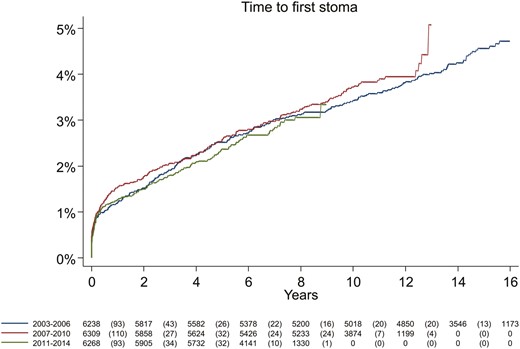
Cumulative incidence of first ever stoma in incident patients with Crohn’s disease, by year of diagnosis (log rank test, P = .61).
Cumulative incidence (95% ci) of patients with Crohn’s disease having a stoma within 1 year, 3 years, and 5 years after diagnosis, and permanenta stoma within 5 years after diagnosis, stratified by year of diagnosis.
| Variable | Overall | 2003–2006 | 2007–2010 | 2011–2014 |
|---|---|---|---|---|
| N | 18,815 | 6 238 | 6 309 | 6 268 |
| Stoma within 1 year of diagnosis | 1.3% (1.2–1.5) | 1.2% (1.0–1.5) | 1.5% (1.2–1.9) | 1.3% (1.0–1.6) |
| Age at diagnosis, years | ||||
| <17y | 0.3% (0.1–0.6) | 0.4% (0.1–1.2) | 0.3% (0.1–1.1) | 0.1% (0.0–1.1) |
| 17–<40y | 0.9% (0.7–1.2) | 0.7% (0.4–1.1) | 1.2% (0.8–1.7) | 0.9% (0.6–1.3) |
| 40–<60y | 1.5% (1.2–1.9) | 1.7% (1.2–2.5) | 1.7% (1.2–2.5) | 1.1% (0.7–1.8) |
| ≥60y | 2.3% (1.9–2.8) | 1.9% (1.3–2.8) | 2.4% (1.8–3.3) | 2.6% (1.9–3.6) |
| Perianal disease at diagnosis | ||||
| Yes | 2.8% (1.9–4.1) | 2.8% (1.3–5.7) | 3.4% (1.9–6.0) | 2.3% (1.1–4.5) |
| No | 1.3% (1.1–1.4) | 1.1% (0.9–1.4) | 1.4% (1.1–1.8) | 1.2% (1.0–1.5) |
| Stoma within 3 years of diagnosis | 1.9% (1.7–2.1) | 1.9% (1.6–2.3) | 2.1% (1.7–2.4) | 1.8% (1.5–2.2) |
| Age at diagnosis, years | ||||
| <17y | 0.9% (0.6–1.4) | 0.8% (0.3–1.7) | 1.4% (0.7–2.6) | 0.4% (0.1–1.4) |
| 17–<40y | 1.4% (1.2–1.7) | 1.3% (0.9–1.9) | 1.6% (1.1–2.2) | 1.3% (0.9–1.8) |
| 40–<60y | 2.2% (1.8–2.7) | 2.7% (2.0–3.6) | 2.0% (1.4–2.9) | 1.8% (1.2–2.6) |
| ≥60y | 3.1% (2.6–3.6) | 2.7% (1.9–3.7) | 3.1% (2.4–4.2) | 3.4% (2.6–4.5) |
| Perianal disease at diagnosis | ||||
| Yes | 4.2% (3.1–5.7) | 5.2% (3.1–8.8) | 3.7% (2.1–6.4) | 4.0% (2.4–6.6) |
| No | 1.8% (1.6–2.0) | 1.8% (1.5–2.1) | 2.0% (1.6–2.4) | 1.7% (1.4–2.0) |
| Stoma within 5 years of diagnosis | 2.5% (2.3–2.7) | 2.5% (2.2–3.0) | 2.6% (2.2–3.0) | 2.4% (2.0–2.8) |
| Age at diagnosis, years | ||||
| <17y | 1.3% (0.9–1.9) | 1.2% (0.6–2.2) | 1.8% (1.1–3.1) | 1.0% (0.5–2.2) |
| 17–<40y | 2.0% (1.7–2.3) | 1.8% (1.4–2.5) | 2.2% (1.7–2.9) | 1.8% (1.4–2.4) |
| 40–<60y | 2.9% (2.4–3.4) | 3.5% (2.7–4.6) | 2.5% (1.8–3.4) | 2.5% (1.8–3.5) |
| ≥60y | 3.6% (3.0–4.2) | 3.3% (2.4–4.4) | 3.6% (2.7–4.7) | 3.9% (3.0–5.0) |
| Perianal disease at diagnosis | ||||
| Yes | 5.9% (4.5–7.6) | 6.4% (4.0–10.3) | 5.0% (3.1–8.0) | 6.3% (4.2–9.4) |
| No | 2.3% (2.1–2.5) | 2.4% (2.0–2.8) | 2.5% (2.1–2.9) | 2.1% (1.8–2.5) |
| Permanent stoma within 5 years of diagnosis | 0.8% (0.7–1.0) | 0.8% (0.6–1.0) | 0.9% (0.7–1.1) | 0.9% (0.7–1.1) |
| Age at diagnosis, years | ||||
| <17y | 0.3% (0.2–0.7) | 0.4% (0.1–1.2) | 0.6% (0.2–1.5) | 0.0% (0.0–0.0) |
| 17–<40y | 0.5% (0.3–0.6) | 0.3% (0.2–0.7) | 0.5% (0.3–0.9) | 0.5% (0.3–0.9) |
| 40–<60y | 1.1% (0.9–1.5) | 1.3% (0.8–2.0) | 1.2% (0.8–1.9) | 0.9% (0.5–1.5) |
| ≥60y | 1.5% (1.2–2.0) | 1.2% (0.7–2.1) | 1.3% (0.8–2.1) | 2.0% (1.4–3.0) |
| Perianal disease at diagnosis | ||||
| Yes | 2.4% (1.6–3.7) | 2.5% (1.1–5.4) | 2.2% (1.1–4.5) | 2.6% (1.4–4.9) |
| No | 0.7% (0.6–0.9) | 0.7% (0.5–1.0) | 0.8% (0.6–1.1) | 0.8% (0.6–1.0) |
aStoma in conjunction with proctectomy or nonreversal of stoma after 2 years
Prevalence, Stoma Closure, and Second Stoma
The prevalence of stoma at 1, 3, and 5 years was 1.3%, 1.9%, and 2.4%, respectively (Table S2), similar to the cumulative incidence. At 5 years from diagnosis, 0.8% of the patients had either undergone proctectomy or had not reversed the stoma after more than 2 years. Time to stoma closure was similar between patients diagnosed during different calendar periods (P = .66; Figure 2).
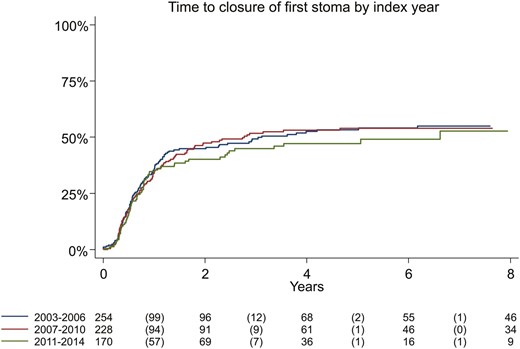
Cumulative incidence of stoma reversal from first ever stoma in incident patients with Crohn’s disease, by year of surgery (log rank test, P = .66).
Use of Anti-TNF and Incidence of Stoma 2007–2015
The cumulative ever-use of anti-TNF increased by calendar period of CD diagnosis between 2007–2009, 2010–2011, and 2012–2014 (P < .001) but with no significant difference between these groups in cumulative incidence of stoma (P = .07; Figure 3).
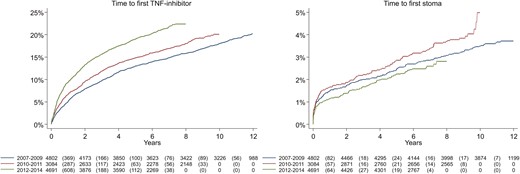
Cumulative use of TNF-inhibitors (log rank test, P-value < .001) and cumulative incidence of stoma (log rank test, P = .07) in incident patients with Crohn’s disease, stratified by year of diagnosis: 2007–2009, 2010–2011, and 2012–2014.
Incidence of Stoma in Patients Undergoing Surgery 1990–2017
When investigating time from first surgery to first formation of a stoma in patients with CD undergoing surgery from 1990 onward, the patients undergoing first surgery from 1990 to 1997 had shorter time to first stoma than patients operated during later years (P < .001; Figure S2).
Factors Associated With Stoma Formation and Nonreversal
In a multivariable Cox regression model including sex, age, year of CD diagnosis, perianal disease at diagnosis, and anti-TNF use, the probability of receiving a stoma within 5 years of CD diagnosis was increased for patients diagnosed at 40 to 59 years of age (HR 1.64, [1.30–2.09]) and 60 years and older (HR 2.38, [1.89–3.01]) compared with patients diagnosed between 17 to 39 years old. For patients with perianal disease at diagnosis, the HR was 2.39 (1.77–3.24) compared with patients without perianal disease. Patients with anti-TNF use during follow-up had an HR for stoma surgery of 4.52 (3.41–5.99) compared with patients without anti-TNF. There were, however, no statistically significant differences between calendar periods (Table 3).
Univariable and multivariable Cox proportional hazard regression models for the probability of stoma within 5 years after diagnosis of Crohn’s disease 2003–2014.
| Variable | Univariable model | Multivariable modela |
|---|---|---|
| HR (95%CI) | HR (95%CI) | |
| Sex | ||
| Females (reference) | 1.00 | 1.00 |
| Males | 1.22 (1.02–1.47) | 1.18 (0.97–1.42) |
| Age at Crohn’s disease diagnosis | ||
| <17 years | 0.68 (0.46–1.01) | 0.65 (0.44–0.98) |
| 17–<40 years (reference) | 1.00 | 1.00 |
| 40–<60 years | 1.47 (1.16–1.87) | 1.64 (1.30–2.09) |
| ≥60 years | 1.91 (1.52–2.39) | 2.38 (1.89–3.01) |
| Year of Crohn’s disease diagnosis | ||
| 2003–2006 (reference) | 1.00 | 1.00 |
| 2007–2010 | 1.03 (0.82–1.29) | 0.92 (0.73–1.15) |
| 2011–2014 | 0.94 (0.75–1.18) | 0.80 (0.63–1.01) |
| Perianal disease at diagnosis | ||
| No (reference) | 1.00 | 1.00 |
| Yes | 2.58 (1.94–3.42) | 2.39 (1.77–3.24) |
| Anti-TNF use (as time-varying covariate) | ||
| No (reference) | 1.00 | 1.00 |
| Yes | 3.97 (3.07–5.13) | 4.52 (3.41–5.99) |
aAdjusted for all variables
Similarly, the HR for nonreversal of stoma within 2 years was increased for older patients compared with patients diagnosed at the age of 17 to 39 years for patients with perianal disease and for patients with anti-TNF use, but there were no differences between calendar periods (Table 4).
Univariable and multivariable Cox proportional hazard regression models for the probability of nonreversal of stoma within 2 years of creation in incident patients with Crohn’s disease 2003–2014.
| Variable | Univariable Model | Multivariable Modela |
|---|---|---|
| HR (95%CI) | HR (95%CI) | |
| Sex | ||
| Females (reference) | 1.00 | 1.00 |
| Males | 0.84 (0.69–1.01) | 0.83 (0.69–1.00) |
| Age at Crohn’s disease diagnosis | ||
| <17 years | 0.97 (0.69–1.35) | 0.89 (0.65–1.22) |
| 17–<40 years (reference) | 1.00 | 1.00 |
| 40–<60 years | 1.12 (0.88–1.43) | 1.30 (1.02–1.65) |
| ≥60 years | 1.29 (1.01–1.65) | 1.64 (1.27–2.13) |
| Year of stoma creation | ||
| 2003–2006 (reference) | 1.00 | 1.00 |
| 2007–2010 | 1.09 (0.87–1.36) | 1.05 (0.85–1.30) |
| 2011–2014 | 1.15 (0.91–1.46) | 1.13 (0.89–1.42) |
| Perianal disease at diagnosis | ||
| No (reference) | 1.00 | 1.00 |
| Yes | 1.64 (1.37–1.95) | 1.82 (1.51–2.20) |
| Anti-TNF use (as time-varying covariate) | ||
| No (reference) | 1.00 | 1.00 |
| Yes | 1.19 (0.99–1.44) | 1.25 (1.02–1.52) |
aAdjusted for all variables
Discussion
In this nationwide cohort of 18,815 patients diagnosed with CD from 2003 to 2014 and followed through 2019, the time from diagnosis to start of treatment with anti-TNF decreased over calendar periods, but the cumulative incidence of stoma formation remained unchanged. The more active and early use of anti-TNF, in combination with the decreasing incidence of abdominal surgery in general for CD,2,4 has raised hopes of decreased incidence of stoma formation, but this was not observed in the present study. However, the cumulative incidence of receiving a stoma was lower in this study compared with previous reports.15 Five years after diagnosis, 2.5% of the patients had undergone stoma surgery, and the incidence of a permanent stoma at the same time point was 0.8%—which should be reassuring for the patients.
A temporary stoma can be used as to decrease the risk of complications after abdominal surgery in patients with abdominal abscesses or fistulas who are immunocompromised or malnourished, or when trying to delay or avoid colectomy or proctectomy.32 For patients in the first category, the benefit is proven and reversal is usually accomplished. A dysfunctioning stoma does, however, lead to another panorama of risk of stoma-specific complications such as prolapse, hernia, and renal insufficiency caused by high output.
The fear of getting a stoma is consistently described as one of the main worries for patients with CD19 due to risk of changes in body image, reproduction, and expected impairment in quality of life. But the formation of a stoma can enable the patient to have a transition from a life controlled by the disease (ie, the bowel symptoms necessitating frequent visits to toilet facilities) to a life with more social activities and work. In a qualitative exploration of patients and clinicians’ perspectives on stoma surgery, both groups agreed that outcomes often were better than expected and that support of other IBD patients with stomas were of great importance.33 Early discussion about formation of a stoma as a treatment option and avoidance of phrases such as “the last resort” are recommended.
In our study, ileostomies were more common (64%) than colostomies (33%), and the most common surgical procedure accompanying the stoma procedure was an ileocolic resection (39%); therefore, it is reasonable to assume that the intention was temporary diversion.
Of the patients that underwent formation of stoma, 12.6% had perianal disease at time of diagnosis; this increased to 24.5%% at the end of follow-up. In previous reports, the response rate of a deviating stoma in Crohn’s colitis has been around 40% to 50% (somewhat lower in the biologic era), and only 31% in complex perianal CD, possibly due to less support for choosing this strategy in perianal CD.32,34 In a recent systematic review encompassing 556 patients with perianal CD refractory to medical treatment, diversion improved symptoms for two thirds of the patients. Restoration was attempted for one third of the patients but was only successful in half of these, with no difference between the prebiological and biological era.35
Among studies investigating the incidence of stoma formation in patients with CD are selected cohorts from referral centers including patients with severe disease such as colitis,5,7 perforated ileitis10 requiring hospitalization,12 surgery in general,11 or perianal disease requiring ostomy formation.8 There are only a few population-based studies with known prevalence of CD.6,9,14 The incidence of temporary stomas decreased from 2002 to 2011 in prevalent CD patients admitted to hospital in the Calgary Health Zone, but with no difference in permanent stomas. The mean rate of stoma formation was 1.80 (95% CI, 1.62–1.91) stomas per 100 person-years.9 A decreasing incidence of stoma within 5 years of diagnosis was also reported in the population-based studies of CD patients in Cardiff, Wales, 1986–2003,6 and in Örebro County, Sweden, 1963–2005,14 but both these studies were small, with 341 and 472 patients, respectively, included.
In randomized controlled trials, anti-TNF has been shown to reduce abdominal surgery in CD during up to 2 years of follow-up36 and to achieve a decrease in drainage from anal fistulas and even closure as long as medication is maintained.37,38 In patients receiving a diverting stoma due to perianal CD, approximately 17% have restored bowel continuity long-term, regardless of concomitant anti-TNF therapy.35 During the investigated period, the use of anti-TNF has continuously increased in Sweden. Despite this, we did not observe a decrease in rates of stoma procedures, consistent with other reports stating that pharmacological therapy may, in some cases, only delay necessary surgery.10,18 In our study, anti-TNF treatment was more common in patients undergoing stoma surgery and in patients not closing the stoma within 2 years of creation, reflecting more severe disease in these patients.
Our results also comply with previous reports stating that the main reduction in surgery rates for CD occurred before the introduction of anti-TNF.2–4 The Swedish NPR includes only data from inpatient care prior to 2001, but when comparing time from first surgery to first stoma (allowing for comparison of patients admitted to hospital for surgery from 1990 onward), there was a significant decrease in stoma use already after the period of 1994 to 1997. In Sweden, infliximab was approved in 1999 and adalimumab in 2007. No decrease in stoma formation was seen during the 2000s.
Strengths and Limitations
This is, to our knowledge, the largest population-based study of incidence and prevalence of stomas in an incident cohort of patients with CD. The nationwide, population-based design and large size of the study population are the main strengths of the study. We mainly used the NPR as data source, and this register has been validated in its entirety,24 in addition to its identification of cases with CD27 and surgery in inflammatory bowel disease.30
Limitations include lack of data on detailed patient characteristics. We chose not to stratify patients according to Montreal classification scheme inasmuch as a recent validation study showed low PPV values for the phenotype regarding location and disease behavior. The exception was CD with perianal manifestations, fo which the PPV was 83% (78–87).29 Due to the same lack of details, we do not know the indication for stoma creation. Some of the stomas classified as temporary may well be meant as permanent stomas already at time of surgery, possibly in part explaining why only 44% of the stomas were reversed within 2 years. A potential reason for nonreversal is colorectal manifestations of CD, and the significant likelihood of nonreversal of stoma must be openly discussed with patients who are considering formation of a stoma due to colonic CD.
Another limitation is the relatively short follow-up for the patients diagnosed from 2011 to 2014. A longer period of study could possibly show different outcomes regarding incidence of stoma in this group in comparison with the previous cohorts, as our data show that use of anti-TNF was more frequent and earlier after diagnosis in this last cohort.
As we excluded all patients with any diagnosis of inflammatory bowel disease unclassified before the first diagnosis of CD, we have probably excluded some “true” CD patients who had colitis as the only manifestation of the disease. There has been an increase in colonic location of CD in Sweden,39 reaching similar incidence as ileal location.39,40 In a recent study of ICD coding in Swedish NPR from 2002 to 2014, IBD subtype changed during follow-up in 18% of the patients, and most changes were to CD.28
The proportion of patients with perianal disease was smaller than expected: only 9.5% at end of follow-up in the entire cohort. This can be explained by underreporting of perianal disease among patients not requiring surgical intervention and some developing this complication later. With a longer disease course, the proportion of patients with perianal fistulas is expected to be at least a quarter of the population.41,42 Follow-up time in this study was in median 9.6 years, altogether possibly overestimating the risk of stoma in patients with perianal CD in the present study.
Conclusions
Despite increasing use of TNF inhibitors and a low rate of proctectomy, the cumulative incidence of stoma formation has remained constant from 2003 onward. The probability of any stoma formation within 5 years of diagnosis was, however, only 2.5% and the probability of permanent stoma 0.8%.
Author Contributions
Guarantor of article: O.O.
Conception and design: A.H.E., T.D.K., O.O., and P.M.
Acquisition of data. O.O.
Statistical analysis. J.S.
Interpretation of data. All authors
Drafting the manuscript. A.H.E., T.D.K.
Critical revision for intellectual content. All authors
Final approval. All authors
Accountable for all aspects of the work in ensuring that questions related to the accuracy or integrity of any part of the work are appropriately investigated and resolved: All authors
Funding
This project was supported by grants from Karolinska Institutet (KI SÖS), Bengt Ihre Research Foundation, Bengt Ihre Research Fellowship, the Swedish Research Council, the Young Scholar Award from the Strategic Research Area Epidemiology program at Karolinska Institutet, the Regional Agreement on Medical Training and Clinical Research between Stockholm County Council and Karolinska Institutet (ALF), and the Regional Agreement on Medical Training and Clinical Research between Östergötland County Council and Linköping University (ALF). None of the funding organizations had any role in the design and conduct of the study; in the collection, management, and analysis of the data; or in the preparation, review, and approval of the manuscript.
Conflicts of Interest
Å.H.E. and J.S. have worked on projects at Karolinska Institutet and SWIBREG partly financed by grants from Ferring and Janssen.
J.F.L. coordinates a study on behalf of the Swedish IBD quality register (SWIBREG), which has received funding from Janssen corporation.
O.O. has been PI on projects at Karolinska Institutet, partly financed by investigator-initiated grants from Janssen and Ferring, and Karolinska Institutet has received fees for lectures and participation on advisory boards from Janssen, Ferring, Takeda, and Pfizer. O.O. also reports a grant from Pfizer in the context of a national safety monitoring program. J.H. served as speaker and/or advisory board member for AbbVie, Celgene, Celltrion, Dr. Falk Pharma and the Falk Foundation, Ferring, Hospira, Janssen, MEDA, Medivir, MSD, Olink Proteomics, Novartis, Pfizer, Prometheus Laboratories, Sandoz, Shire, Takeda, Thermo Fisher Scientific, Tillotts Pharma, Vifor Pharma, and UCB and received grant support from Janssen, MSD, and Takeda. P.M. served as speaker and/or advisory board member for AbbVie, Ferring, Janssen, Takeda, and Tillotts Pharma and received grant support from Janssen, MSD, and Takeda. C.N., T.K., and A.E. have no disclosures.
References
Author notes
Authors contributed equally

