


Abstract
The loss of response to infliximab is a challenge for clinicians in the management of inflammatory bowel disease (IBD). Mounting evidence suggests that therapeutic drug monitoring at induction may predict remission during maintenance. The aim of the study was to improve predictive models of remission by exploring new peak and intermediate infliximab measurements during induction.
This was a prospective multicenter study evaluating the pharmacokinetics of infliximab during induction in a pioneer cohort of 63 patients with IBD. Pharmacokinetics data including peak, intermediate, and trough levels were combined with clinical and biological parameters and were subsequently fed into tailored logistic regression and tree-based techniques to predict remission at week 30.
Infliximab peak levels at week 2, intermediate levels at week 3, and trough levels at week 6 were correlated with remission at week 30. Predictive models exhibited an increased accuracy over the successive timepoints of the induction with key inputs such as albumin, C-reactive protein, eosinophils, neutrophils, lymphocytes, intermediate level at week 3, trough level at week 6, and age at diagnosis. Our predictive model of remission at week 30 was obtained with an area under the receiver operating characteristic curve of 0.9 ± 0.12, a sensitivity of 89%, and a specificity of 75%.
This study showed the clinical relevance of measuring new infliximab levels to predict remission in patients with IBD. These findings lay the foundation for a personalized medicine in which biotherapies could be monitored at an early stage, thereby improving patients’ clinical management.
INTRODUCTION
The loss of response to infliximab and its biosimilars is a therapeutic challenge in patients with Crohn disease (CD) and ulcerative colitis (UC).1 Although new molecules are being developed to offer alternative therapeutic options, it important to fully leverage the potential of each treatment. In this context, reactive therapeutic drug monitoring (TDM) during anti-tumor necrosis factor α treatment has been largely studied and is currently used for both managing the loss of response and stopping the therapy in case of quiescent disease.2, 3 Current TDM algorithms are based on trough level measurements, which are easily obtained in clinical practice because they reflect the minimum steady-state drug concentration that is measured just before the next drug infusion.4 Several cutoffs of infliximab trough levels have been reported to indicate therapeutic effectiveness.5 Although the majority of cutoffs are related to the maintenance period,5 several studies have highlighted the interest of early TDM. For example, infliximab trough levels at week 66, 7 and even at week 28 have shown potential in predicting remission during the maintenance treatment period. Despite the clinical relevance of exploring these infliximab trough levels in practice, current studies fail to provide compelling sensitivity and specificity levels.3, 9 In this context, recent studies have reported that enriching trough levels with other pharmacokinetic measurements such as intermediate or peak levels may provide more insight in pharmacokinetics while improving outcome predictions.10-13 However, the benefit of these additional measurements remains unclear.11-13 Furthermore, the full predictive value of combining these pharmacokinetic values with other clinical and biological data has not yet been explored.
We therefore designed a prospective multicenter study that provided a careful scrutiny of infliximab pharmacokinetics during induction to predict which patients would achieve remission at week 30. In particular, we exploited the early pharmacokinetics of infliximab, in combination with phenotypic data and inflammatory biomarkers, with the goal of developing a predictive model of remission in patients with inflammatory bowel disease (IBD), using both logistic regression and machine learning approaches.
MATERIALS AND METHODS
Study Design and Population
This proof-of-concept project was based on a prospective and multicenter study. The protocol was developed by the Belgian IBD Research and Development group, approved by the ethics committee of the Erasme Hospital in Brussels, Belgium (EC P2015/508, approved April 19, 2016), and registered with the European Medicines Agency (EudraCT: 2015-004618-10). Sixty-three patients were included between April 2016 and April 2019 in 8 Belgian centers. Eligible patients had a documented history of IBD, either CD or UC, as assessed by colonoscopy and supported by histology. The disease activity was evaluated based on the presence of both mucosal inflammation (confirmed by colonoscopy during screening) and clinical score activity. The latter was defined as a Harvey-Bradshaw Index (HBI) score ≥8 (or HBI score >5 in patients with CD elevated C-reactive protein [CRP]) and as a total Mayo score ≥6 in patients with UC. Other criteria of eligibility and protocol details are described in the Supplementary Methods. Full inclusion and exclusion criteria are reported in Supplementary Table 1.
Procedures
Patients were assessed during screening, at baseline, and at predefined intervals throughout the study as depicted in Supplementary Fig. 1. Assessments included recording of HBI and partial Mayo scores; the monitoring of laboratory data including CRP, blood count, and liver and renal functions; and the collection of stool samples for fecal calprotectin (FC) evaluation. A colonoscopy was performed at the screening stage for both patients with CD and patients with UC and a left colonoscopy at week 10 for patients with UC. An ileocolonoscopy was done at week 30 for patients with CD at physician discretion. The induction treatment was the same for all patients (5 mg/kg at weeks 0, 2, and 6). An optimization was authorized only after the induction period according to clinical and biological data. In patients with optimization, the visit program was adapted according to the optimization protocol.
Outcomes and Definitions
The primary outcome was to develop models predicting remission at week 30 by using infliximab levels during induction and both phenotypic data and inflammatory biomarkers. Remission was defined as the combination of an HBI score ≤4 and CRP ≤5 mg/L for CD and as the combination of a partial Mayo score ≤2 and FC <250 µg/g for UC. The response was defined as an HBI reduction of 3 with a 50% CRP drop for CD, and as a partial Mayo score ≤2 with a 50% FC drop for UC. Primary nonresponse was defined as the absence of drug efficacy that required a change of treatment before week 10. The secondary outcome of the study included detailed analyses of the infliximab drug exposure-response during induction and the resulting correlation with remission at week 30, along with the impact of immunogenicity on pharmacokinetics.
Infliximab Measurements
Serum samples were collected at 14 timepoints across the 30 weeks of study (Supplementary Methods) leading to a total of 751 sera, representing 538 sera from baseline to week 6 and 213 sera from week 10 to week 30. Infliximab serum concentrations were determined by using enzyme-linked immunosorbent assay (ApDia, Turnhout, Belgium) and were expressed as µg/mL. For all patients, antibodies to infliximab (ATI) were determined by using a drug-tolerant affinity-capture elution anti-infliximab assay14 at weeks 6, 22, and 30.
Statistical Methods
Mann-Whitney U tests were used for nonparametric, continuous, non-paired variables. Results were expressed as median with interquartile range (25-75). A Pearson χ 2 test was used to compare categorical variables. A receiver operating characteristic (ROC) curve analysis was performed to compute the Youden index (which maximizes both the sensitivity and the specificity of the ROC curve), thereby identifying the infliximab serum concentration threshold that related to remission. The difference between outcomes was considered to be significant for P < 0.05. These statistical analyses were performed with SPSS version 20.0 (SPSS Inc., Chicago, IL).
Logistic Regression and Machine Learning Models
With the objective of developing predictive models of remission in patients with IBD, 2 different approaches, logistic regression and tree-based models, were investigated. Both were formulated as binary classification problems providing the probability of remission of both patients in remission and patients not in remission at week 30 (the respective probabilities summed up to 100%).
For both approaches, the predictive models were designed at 5 different timepoints, respectively using the information available at baseline, week 1, week 2, week 3, and week 6. The performance of the models was evaluated using the area under the ROC curve (AUC) with SD, Nagelkerke R2, sensitivity, specificity, predictive positive value, and predictive negative value.
Regarding logistic regression (LR), the input selection was based on univariate analysis, which selected only variables with P < 0.3 to build the subsequent multivariate model.15 In general, LR models have shown promising prediction abilities and offer the advantage of easily evaluating the influence of different input variables.
Because of the increasing interest of machine learning in medicine,16 we supplemented our LR models in an innovative and exploratory way using tree-based techniques, ie, random forests (RF) and gradient-boosting decision trees (GBDT).17, 18 Such models have been selected based on their ability to leverage complex interactions among variables and on their flexibility and robustness with small datasets, in comparison to other techniques such as neural networks that require large datasets to ensure good generalization capabilities.19
The determination of an optimal set of predictors (which avoids redundancy and collinearity) among the available input variables is a complex task. To that end, we first ranked the importance of all inputs. Based on this information, different relevant combinations of inputs were explored with the goal of identifying the best solution. For each input combination, the prediction model was trained within a robust environment, which consisted in averaging the AUC outcomes from 10 different runs of a nested cross-validation framework to get an unbiased estimate of a generalization performance metric (defined by a mean AUC). This efficient regularization procedure was selected to avoid bias and overfitting when evaluating the model quality with regard to the limited size of the studied cohort.20 More details regarding the data preprocessing (including details on the management of missing data), the logistic regression (including details on regularization), and machine learning methodologies (including details on the model calibration and the hyperparameter selection) are presented in the Supplementary Methods. These analyses were performed with Python 3.6 using the packages statsmodels and Scikit-learn.
RESULTS
Demography and Clinical Outcomes
Patient demographics and clinical, biological and endoscopic characteristics at baseline are shown in Table 1 for the overall cohort. Fifteen patients had a prior exposure to biologics, but all of them were naïve to infliximab. At week 14, 39.7% of patients were in remission (n = 25/63) and 36.5% were in steroid-free remission (n = 23/63), 61.9% experienced a response (n = 39/63), and 55.5% experienced a steroid-free response (n = 35/63). By week 30, 38.1% (n = 24/63) of all patients were in remission. In particular, remission was obtained in 38.2% (n = 13/34) of patients with CD and in 37.9% (n = 11/29) of patients with UC (Supplementary Figure 2). Of those patients in remission, optimization was required for 3 patients with CD and 4 patients with UC. Note that the follow-up was slightly shorter for these optimized patients in remissiom (26 weeks instead of 30 weeks) in accordance with the study protocol. A steroid-free remission was achieved in 34.9% of patients (n = 22/63). Overall, 24 patients (38.1%) required an optimization, among whom 11 had a shortened interval, 13 had an increased dose, and 5 had both optimization types. Nine patients (14.3%) stopped the drug treatment for different reasons, including primary nonresponse (n = 3), secondary loss of response (n = 3), adverse event (n = 1), and loss of follow-up (n = 2).
Demographic and Baseline Data
| Patients at Baseline (n = 63; female, 30 [47.6%]) | |
|---|---|
| Age (y), minimum-maximum | 40.5 (21-77) |
| CD | 34 (54) |
| UC | 29 (46) |
| Female features, median (IQR) | |
| Body weight (kg) | 61.2 (52.7-70) |
| Body mass index (kg/m2) | 22 (20.5-25.5) |
| Body surface area (m2) | 1.68 (1.5-1.8) |
| Lean body weight (kg) | 44.5 (39.1-47.8) |
| Male features, median (IQR) | |
| Body weight (kg) | 77 (70-86.5) |
| Body mass index (kg/m2) | 24 (21.5-27.9) |
| Body surface area (m2) | 1.95 (1.8-2.1) |
| Lean body weight (kg) | 57.2 (56.1-62.9) |
| Disease features, CD (%) | |
| Age at diagnosis (y), minimum-maximum | 27 (11-66) |
| A1 (<17) | 4 (11.7) |
| A2 (17-40) | 22 (64.7) |
| A3 (>40) | 8 (23.5) |
| L1 | 10 (29.4) |
| L2 | 7 (20.6) |
| L3 | 17 (50) |
| +L4 | 1 (2.9) |
| B1 | 16 (47.1) |
| B2 | 8 (23.5) |
| B3 | 10 (20.4) |
| Perianal disease | 6 (17.6) |
| Previous surgery | 12 (35.3) |
| Disease features, UC (%) | |
| Age at diagnosis (y), minimum-maximum | 34 (12-65) |
| E1 | 1 (3.4) |
| E2 | 5 (17.2) |
| E3 | 14 (48.3) |
| E4 | 9 (31.1) |
| Smoking status (%) | |
| Current | 15 (23.8) |
| Former | 7 (11.1) |
| Never | 41 (64.1) |
| Previous exposure to biologics (%) | |
| Yes/no | 15 (23.8)/48 (76.2) |
| Adalimumab | 9 (14.3) |
| Vedolizumab | 4 (6.3) |
| Golimumab | 4 (6.3) |
| Concomitant medications at baseline (%) | |
| Systemic steroids | 7 (11.1) |
| Oral controlled-release formulation | 14 (22.2) |
| Azathioprine/6-mercaptopurine | 28 (44.4) |
| Methotrexate | 9 (14.3) |
| None | 19 (30.2) |
| Clinical and biological data at baseline CD, median (IQR) | |
| HBI | 8 (7-10) |
| CRP (mg/L) | 14 (5.9-24) |
| FC (µg/g) | 484 (123-1800)* |
| Endoscopy (Simple Endoscopic Score for Crohn Disease) | 12 (7-20) |
| Clinical and biological data at baseline UC, median (IQR) | |
| Partial Mayo score | 7 (6-9) |
| CRP (mg/L) | 5 (1.6-29.5) |
| FC (µg/g)* | 1698 (226-1800)* |
| Endoscopy (Mayo) | 3 (2-3) |
| Biological baseline data, median (IQR) | |
| Albumin (g/dL) | 40.7 (30.7-44) |
| Total protein (g/dL) | 74 (70-77) |
| Leukocytes (mm3) | 7800 (6720-9770) |
| Platelets (mm3) | 340,000 (275,000-417,000) |
*FC upper limit detection.
Relationship Between Drug Exposure and Remission at Week 30
Among the 751 sera dedicated to infliximab pharmacokinetic analyses, a measurable concentration of infliximab was present in all samples before week 10 but was undetectable in 8.4% (n = 18/213) of samples (belonging to 9 patients) between weeks 10 and 30. Median infliximab levels at the different timepoints during induction for the overall population are presented in Table 2. As expected, median trough levels at week 6 were significantly higher among patients in remission than for patients not in remission (P = 0.01) (Fig. 1A). Even with the removal of optimized patients in remission (n = 7), median trough levels at week 6 remained significantly higher among patients in remissiom than for those not in remission (P = 0.02). Interestingly, peak levels at week 2 and intermediate levels at week 3 were also significantly higher among patients in remission, at P = 0.02 and P = 0.04, respectively (Figs. 1B, C). In the same vein, an overrepresentation of patients not in remission was observed in the lowest quartile for intermediate levels at week 3 (Supplementary Fig. 3).
Infliximab Levels at Different Timepoints During Induction for the Overall Population
| Measurement | Peak Level | Intermediate Level | Intermediate Level | Trough Level | Peak Level | Intermediate Level | Intermediate Level | Trough Level | Peak Level |
|---|---|---|---|---|---|---|---|---|---|
| Timepoint | Day 0 | Day 3 | Day 7 | Week 2 | Week 2 | Day 17 | Week 3 | Week 6 | Week 6 |
| Median (IQR, 25-75) | 110.4 (95.7-141.6) | 65.6 (52.1-83.6) | 43.9 (33.1-52.4) | 23.7 (14.9-32.6) | 148.5 (120.3-170.2) | 83.35 (66.3-107) | 56.3 (40.5-76.2) | 13.62 (7.5-21.5) | 124.5 (104.7-146.3) |

A, Median trough level of infliximab at week 6 between patients in remission and patients not in remission at week 30: 17.4 µg/mL (IQR, 9.8-26.7 µg/mL) in patients in remission and 10.5 µg/mL (IQR, 6.4-14.9 µg/mL) in patients not in remission (P = 0.011). B, Median peak level of infliximab at week 2 between patients in remission and patients not in remission at week 30: 155.7 µg/mL (IQR, 142.9-179 µg/mL) in patients in remission and 134 µg/mL (IQR, 115.4-156.7 µg/mL) in patients not in remission (P = 0.015). C, Median intermediate level of infliximab at week 3 between patients in remission and patients not in remission at week 30: 62 µg/mL (IQR, 51.2-81.4 µg/mL) in patients in remission and 46.7 µg/mL (IQR, 36.9-77.1 µg/mL) in patients not in remission (P = 0.04). IQR indicates interquartile ratio.
Influence of Immunogenicity
We detected ATI in 14.3% (n = 9/63) patients, the earliest at week 6. Among patients who developed ATI, more were treated with monotherapy than combination therapy (7 vs 2, respectively; P = 0.03). We found that ATI did not statistically influence the remission rate at week 30. Patients with ATI displayed significantly lower infliximab levels at several early timepoints, including day 14 and day 17 (Fig. 2). The areas under the ROC curve for trough level at day 14 and intermediate level at day 17 were 0.78 and 0.81, respectively, and the resulting optimal cutoffs for the absence of further immunogenicity, based on the Youden index, were respectively defined at 18.6 µg/mL (sensitivity 72%, specificity 89%) and 76 µg/mL (sensitivity 73%, specificity 87%). The same observation was made for trough level at week 6 (area under ROC curve, 0.82) with an optimal cutoff of 8 µg/mL (sensitivity 83%, specificity 78%).
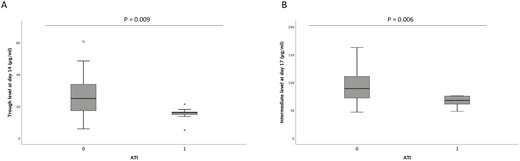
A, Median trough level of infliximab at day 14 (week 2) between patients with ATI and those without ATI: 25 µg/mL (IQR, 14.8-33.9 µg/mL) in patients without ATI and 16.1 µg/mL (IQR, 14-17.7 µg/mL) in patients with ATI (P = 0.009). B, Median intermediate level of infliximab at day 17 between patients with ATI and those without ATI: 89.6 µg/mL (IQR, 74.3-112.9 µg/mL) in patients without ATI and 67.9 µg/mL (IQR, 60.4-75.7 µg/mL) in patients with ATI (P = 0.006). IQR indicates interquartile ratio.
Models for Predicting Remission at Week 30
To avoid potential bias related to optimization during maintenance, optimized patients in remission (n = 7) were removed from the dataset before we built the predictive models. Fifty-six patients were therefore used, 39 patients not in remission and 17 patients in remission.
Predictive Models at Baseline
At baseline, a multivariate LR model fed with 6 input variables allowed us to predict remission at week 30 with an AUC of 0.74 (SD ± 0.14), a sensitivity of 76.5%, a specificity of 61%, a predictive positive value of 54.5%, and a predictive negative value of 80.5% (Table 3A). Those results reflect that the predictive model achieved a better performance in confirming the status of patients not in remission (ie, the probability of truly predicting negative outcomes). In particular, the 6 most informative explanatory variables were the use of immunomodulators, albumin level, height, and the eosinophil, lymphocyte, and monocyte counts. It was observed that a higher level of eosinophils at baseline as associated with a lower probability of remission at week 30, whereas the use of an immunomodulator at baseline and a high level of lymphocytes and monocytes positively affected the probability of remission.
Performance of Predictive Models and Input Variables Selected at Different Timepoints for LR, RF, and GBDT
| Performance of Predictive Models for LR, RF, and GBDT at Different Timepoints* | |||||
|---|---|---|---|---|---|
| Baseline | Week 1 | Week 2 | Week 3 | Week 6 | |
| LR | AUC, 0.74 ± 0.14 | AUC, 0.79 ± 0.17 | AUC, 0.77 ± 0.15 | AUC, 0.77 ± 0.15 | AUC, 0.83 ± 0.14 |
| Se, 76.5% | Se, 74% | Se, 71% | Se, 71% | Se, 79% | |
| Sp, 61% | Sp, 71% | Sp, 71% | Sp, 71% | Sp, 71% | |
| PPV, 54.5% | PPV, 61.1% | PPV, 60.1% | PPV, 60.1% | PPV, 62.6% | |
| NPV, 80.5% | NPV, 81.6% | NPV, 79.9% | NPV, 79.9% | NPV, 84.6% | |
| Nagelkerke R2, 0.43 | Nagelkerke R2, 0.59 | Nagelkerke R2, 0.49 | Nagelkerke R2, 0.49 | Nagelkerke R2, 0.46 | |
| Number input, 6 | Number input, 9 | Number input, 6 | Number input, 6 | Number input, 2 | |
| RF | AUC, 0.77 ± 0.13 | AUC, 0.84 ± 0.14 | AUC, 0.84 ± 0.16 | AUC, 0.86 ± 0.14 | AUC, 0.9 ± 0.12 |
| Se, 78 % | Se, 81% | Se, 81% | Se, 87% | Se, 89% | |
| Sp, 62 % | Sp, 71% | Sp, 71% | Sp, 71% | Sp, 75% | |
| PPV, 55.8% | PPV, 63.2% | PPV, 63.2% | PPV, 64.9% | PPV, 68.7% | |
| NPV, 82.1% | NPV, 85.9% | NPV, 85.9% | NPV, 89.9% | NPV, 91.7% | |
| Number input, 7 | Number input, 2 | Number input, 4 | Number input, 5 | Number input, 3 | |
| GBDT | AUC, 0.74 ± 0.16 | AUC, 0.81 ± 0.14 | AUC, 0.81 ± 0.14 | AUC, 0.83 ± 0.15 | AUC, 0.88 ± 0.1 |
| Se, 72 % | Se, 78% | Se, 79% | Se, 87% | Se, 86% | |
| Sp, 70 % | Sp, 74% | Sp, 72% | Sp, 62% | Sp, 75% | |
| PPV, 59.6% | PPV, 64.9% | PPV, 63.5% | PPV, 58.5% | PPV, 67.9% | |
| NPV, 80.2% | NPV, 84.5% | NPV, 84.8% | NPV, 88.5% | NPV, 89.7% | |
| Number input, 2 | Number input, 2 | Number input, 2 | Number input, 3 | Number input, 3 | |
| Input Variables Selected at Different Timepoints for LR, RF, and GBDT | |||||
| Baseline | Week 1 | Week 2 | Week 3 | Week 6 | |
| LR | Use of IMM | Eosinophil count at baseline | CRP level at week 1 | CRP level at week 1 | Neutrophil count at week 1 |
| Eosinophil count | Lymphocyte count at baseline | Neutrophil count at week 1 | Neutrophil count at week 1 | IFX trough level at week 6† | |
| Lymphocyte count | CRP level at week 1 | Monocyte count at week 1 | Monocyte count at week 1 | ||
| Monocyte count | Neutrophil count at week 1 | Eosinophil count at week 1 | Eosinophil count at week 1 | ||
| Albumin level | Leukocyte count at week 1 | Leukocyte count at week 1 | Leukocyte count at week 1 | ||
| Height | Eosinophil count at week 1 | Albumin level at baseline | Albumin level at baseline | ||
| Monocyte count at week 1 | |||||
| Albumin level at baseline | |||||
| Height | |||||
| RF | Neutrophil count | Neutrophil count at week 1 | Lymphocyte count at baseline | Neutrophil count at week 1 | Neutrophil count at week 1 |
| Lymphocyte count | Lymphocyte count at baseline | Neutrophil count at week 1 | Lymphocyte count at baseline | Lymphocyte count at baseline | |
| Eosinophil count | Platelet count at week 2 | FC level at week 2 | IFX trough level at week 6† | ||
| Albumin level | Age at diagnosis | Eosinophil count at week 1 | |||
| Age at diagnosis | IFX level at week 3† | ||||
| Age at IFX start | |||||
| GBDT | Lymphocyte count | Neutrophil count at week 1 | Lymphocyte count at baseline | Neutrophil count at week 1 | Neutrophil count at week 1 |
| Albumin level | Lymphocyte at baseline | Neutrophil count at week 1 | Lymphocyte count at baseline | Lymphocyte count at baseline | |
| FC level at week 2 | IFX trough level at week 6† |
*Nagelkerke R2 (for LR) is a measure between 0 and 1, with 0 meaning that the model does not predict anything and 1 meaning that it perfectly predicts the remission. AUC values (for both LR and tree-based models) between 0.5 and 1.0, with 0.5 meaning that the model does not predict remission and 1.0 meaning that it perfectly predicts remission. PPV and NPV calculated using remission prevalence of 38.1% at week 30.
†Infliximab measurements.
IFX indicates infliximab; IMM, immunomodulators; NPV, negative predictive value; PPV, positive predictive value; SE, sensitivity; Sp, specificity.
The RF and GBDT models showed performance similar to that of the LR model (Table 3A). Interestingly, in comparison with the LR model, input variables were selected differently in the tree-based models (Table 3B). Complementary to findings from the LR model, the RF model also revealed that a higher count of lymphocytes and neutrophils at baseline was associated with a higher probability of remission at week 30. Starting infliximab at an older age also appeared as a favorable factor leading to a higher probability of remission. Conversely, a younger age at IBD diagnosis reduced the probability of remission at week 30 (Fig. 3).
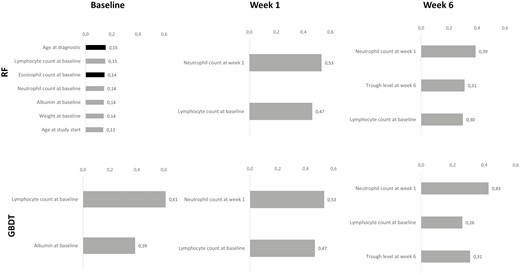
Ranking of selected input variables by the RF and GBDT models at baseline, week 1, and week 6. Ranking was calculated using the Gini index for each input variable, which can be used as a general indicator of feature relevance obtained for the RF and GBDT models. For the grey bars, the higher the value of the input variable, the higher the probability of remission. For the black bars, the higher the value of the input variable, the lower the probability of remission.
Predictive Models at Different Timepoints During Induction
The forecasting performance of the 3 models increased with the additional information provided at week 1, which was associated with better positive and negative predicted values. The timepoints at weeks 2 and 3 did not seem to bring valuable information to improve the forecasting performances of both the LR and tree-based models. Interestingly, the accuracy of the predicted remission using the LR model further increased, up to an AUC of 0.83 (SD ± 0.14) at week 6 with only 2 inputs: the neutrophil count at week 1 and infliximab trough levels at week 6 (Table 3A). Likewise, the AUC obtained by the RF and GBDT models achieved a maximum accuracy at week 6 with an AUC of 0.90 (SD ± 0.12) and 0.88 (SD ± 0.1), respectively. Interestingly, considering our specific cohort, this finding could be translated into a negative predictive value of 91.7% and 89.7%, respectively, for the RF and GBDT models (Table 3A). The input features used to achieve this performance included the lymphocyte count at baseline, the neutrophil count at week 1, and the infliximab trough levels at week 6.
Overall, although we observed a valuable improvement in the prediction performance over the induction period (with the new data gathered over time), the results of the infliximab pharmacokinetic measurements were quite mixed. One the hand, the infliximab intermediate level at week 3 fed only the RF model but without dramatically improving the prediction performance. On the other hand, the infliximab trough levels at week 6 clearly brought valuable information and contributed to improve the predictive models while reducing the variability around the predicted outcome (Table 3A). These results highlight the importance of combining pharmacokinetic data with clinical and biological parameters. Fig. 4 summarizes the ROC curves obtained from both the LR and the tree-based models at baseline, week 1, and week 6.

ROC curves for the LR, RF, and GBDT models at baseline, week 1, and week 6. Each model was trained 20-fold with 20 resulting ROC curves. The blue line reflects the mean ROC curve for each model. The dashed red line reflects the random predictor. The grey zone depicts the standard deviation around the mean.
DISCUSSION
This prospective multicenter study is a proof-of-concept study, based on a unique and original cohort, which emphasizes 2 main contributions. First, we reported new findings on infliximab pharmacokinetics such as the relationship between infliximab peak level at week 2 and intermediate level at week 3, and patient remission at week 30. We also confirmed the relationship between infliximab trough levels at week 6 and the subsequent probability of remission, along with the early influence of immunogenicity on infliximab pharmacokinetics. Second, we developed a new and robust methodology using different machine learning techniques, and we observed that the tree-based model can supplement the LR model to predict remission, especially in restricted-size cohorts.
Several studies have highlighted the interest of an early TDM based on infliximab trough levels at week 66, 7 to predict remission during maintenance. We confirmed this relationship regarding trough levels at week 6. Despite the obvious interest of these infliximab trough levels in practice, these measurements lack both sensitivity and specificity.3,9 In this context, recent studies have reported the use of other pharmacokinetic measurements such as intermediate or peak levels to gain insight into pharmacokinetics and try to improve outcome predictions.10-13 However, the benefit of these additional measurements was not obvious in our study.11-13 In contrast, we found that both peak levels at week 2 and intermediate levels at week 3 were significantly associated with remission status at week 30. These novel findings may revive the debate on whether treatment algorithms should be exclusively based on trough levels,21 in that we observed that other early measurements offered some useful information. Interestingly, these results were supported by outcomes from predictive models that confirmed that intermediate levels at week 3 and trough level at week 6 are key variables to predict midterm remission.
With regard to immunogenicity, it remains difficult to measure ATI at very early timepoints when circulating levels of infliximab are high, even when using a drug-tolerant assay. This situation likely leads to an underestimation of the ATI-related clearance and to difficulties in identifying the onset of ATI production.22 However, we observed that infliximab levels at early timepoints, as soon as day 14, were significantly lower among patients with immunogenicity. This observation, which is aligned with those in previous studies,8, 13 suggests that ATI, even not directly detected, could impact infliximab pharmacokinetics as soon as early induction. However, at this point, this correlation between low infliximab levels and immunogenicity does not allow us to determine whether low infliximab levels precede and induce immunogenicity. Furthermore, our data also confirmed the importance of using infliximab in combination therapy to reduce the risk of ATI development.23
The methodology used to select the optimal set of input variables, which relied on a robust exploration strategy (presented in Supplementary Methods), uncovered unexpected valuable predictors. In that regard, monitoring the early evolution of leukocyte counts (including neutrophils, lymphocytes, and eosinophils) during the first week of an infliximab treatment seemed to be of interest for patient follow-up. This observation is associated with a biological explanation because leukocyte counts reflect the inflammatory burden related to IBD activity; until this study, their influence had not been pinpointed.24 Both the LR and RF models highlighted that higher values of eosinophils were associated with a lower probability of remission at week 30. Although this feature may be unexpected, recent literature reported that higher levels of peripheral eosinophils were related to more aggressive disease.25-27 Moreover, eosinophilic infiltration of the mucosa was also found to be predictive of nonresponse to vedolizumab.28 Taken together, the evolution of both peripheral and mucosal eosinophils should be further explored for predicting drug response. Note that the influence of the eosinophil count was already observed at baseline, which tends to rule out any influence of infliximab on this observation.
Because of the pioneering and innovative study design that included numerous infliximab measurements during induction, the size of this original countrywide cohort was limited to 63 patients with IBD. This restricted size inevitably complicated the calibration of our prediction models, but this issue was significantly mitigated by relying on dedicated learning approaches that were specifically designed for small datasets.20 In particular, the combination of tree-based models with a powerful regularization strategy, consisting of training the models in a rigorous nested cross-validation framework, allowed us to reduce the variance of the outcomes while providing a confidence interval around the prediction. Furthermore, the prospective design and the intense collection of serum samples improved both the quality and quantity of data. In addition, an endoscopy in the follow-up was not mandatory for all patients, which precluded obtaining any data on mucosal healing. However, the FC collection at almost all timepoints is a good surrogate marker for mucosal healing, especially for patients with UC. In addition, our remission endpoint was strongly defined by including both the clinical score and objective markers of disease activity.
Overall, by considering the complex multidimensional interactions among biological inputs, we found that the tree-based models yielded an accurate prediction of remission and highlighted some new biologic parameters of interest. However, the use of such algorithms complicated the determination of unique cutoffs for each individualized input. Nonetheless, after prior validation of these models in larger external cohorts, emerging clinical applications or a website,29 which allows one to easily insert input variables (and to generate the associated prediction of remission), offers a promising perspective for clinical practice.
CONCLUSIONS
This proof-of-concept study featured several important novelties for the task of predicting remission in patients with IBD treated with infliximab, highlighting the clinical relevance of early infliximab measurements and the value of applying tree-based models on top of logistic regression for predictive models. These interesting results represent a new step toward studies for personalized medicine in which biotherapies could be monitored at early stages, hence improving clinical practice in IBD.
Abbreviations
- ATI
antibodies to infliximab
- AUC
area under the curve
- CD
Crohn disease
- CRP
C-reactive protein
- FC
fecal calprotectin
- GBDT
gradient-boosting decision trees
- HBI
Harvey-Bradshaw Index
- IBD
inflammatory bowel disease
- LR
logistic regression
- RF
random forests
- ROC
receiver operating characteristic
- TDM
therapeutic drug monitoring
- UC
ulcerative colitis
ACKNOWLEDGMENTS
The authors thank Saskia Appelmans, Marjan Steppe, Linda Evrard, Layla Boutaffala, Julie Thijs, Elien De Cock, Lien Decaesteker, Emilie Collet, Ils Van de Schoot, Louise Vandenbroucke, Nina Van Heddegem, D’Hondt Ann, Valerie Wambacq, Charlotte Minsart, Eric Quertinmont, Vjola Tafçiu, and Anneline Cremer.
Supported by: This work was supported by an educational grant from Mundipharma.
Conflicts of interest: C. Liefferinckx is supported by the Belgian National Fund of Scientific Research; received grants from Fonds Erasme (Erasme Hospital, Belgium); and received honoraria fees for lectures or consultancy from AbbVie, Janssen, Takeda, and Sandoz. D. Franchimont is research director of the Belgian National Fund of Scientific Research; has received educational grants from AbbVie, Takeda, MSD, and Janssen; and has received honoraria fees for lectures or consultancy from Ferring, Falk, Chiesi, AbbVie, MSD, Centocor, Pfizer, Amgen, Janssen, Mundipharma, Takeda, and Hospira.
S. Vermeire received grants/research support from MSD, AbbVie, Takeda, Janssen, and Pfizer; honoraria or consultation fees from AbbVie, MSD, Takeda, Ferring, Genentech/Roche, Shire, Pfizer Inc, Galapagos, Mundipharma, Hospira, Celgene, Second Genome, Progenity, Lilly, Arena, Gilead, and Janssen; and participated in a company-sponsored speaker’s bureau for AbbVie, MSD, Takeda, Ferring, Hospira, Pfizer, Janssen, and Tillots. P. Bossuyt has received financial support for research from AbbVie, Mundipharma, Pfizer, Janssen, and Mylan; lecture fees from AbbVie, Takeda, Pfizer, and Janssen; and advisory board fees from AbbVie, Takeda, Hospira, Janssen, MSD, BMS, Mundipharma, Roche, Pfizer, Sandoz, and Pentax. J-F. Rahier has received speaker fees from AbbVie, MSD, Takeda, Pfizer, Ferring, and Falk; consultancy fees from AbbVie, MSD, Takeda, Pfizer, Janssen, Mundipharma, and Glaxosk; and research grants from Takeda and AbbVie. F. Baert received grants/research support from AbbVie, Amgen, Takeda, and Janssen; honoraria or consultation fees from AbbVie, Arena, MSD, Celgene, Takeda, Ferring, Pfizer, Norgine, and Janssen; and participated in a company-sponsored speaker’s bureau for AbbVie, MSD, Takeda, Ferring, Pfizer, and Janssen. L. Pouillon received advisory board fees from Takeda and Janssen; presentation fees from AbbVie and Ferring; and travel fees from AbbVie, Ferring, Norgine, and Takeda. E. Louis has received fees for research grants from Takeda and Pfizer; educational grants from AbbVie, Takeda, and Janssen; speaker fees from AbbVie, Ferring, MSD, Falk, Takeda, Hospira, Janssen, Pfizer, and Celgene; advisory board fees from AbbVie, Ferring, MSD, Takeda, Celgene, Hospira, and Janssen; and consultancy fees from AbbVie. P. Dewint received research support from Biogen and Mundipharma, speaker fees from Janssen, and consultancy fees from Samsung Bioepis.
REFERENCES

