


Abstract
The recurrent and debilitating nature of Inflammatory Bowel Disease (IBD) makes affected patients ideal candidates to assess the therapeutic potential of a digital intervention for long-term patient management. HealthPROMISE is an innovative software platform designed to improve health outcomes by increasing patient engagement, self-management skills and communication transparency.
The study aims to understand the impact of the use of a mobile based remote app on improving quality of care (QOC), health outcomes and quality of life (QOL) in IBD patients.
Demographic information and baseline e-PROs (Patient-Reported Outcomes) were measured using online questionnaires delivered through the mobile based monitoring app. In the app, patients update their information and receive a disease summary of QOC metrics and IBD-specific QOL trends. Patient data was monitored in real-time and communicated with the care team and patients as needed.
•320 patients were enrolled and randomized to intervention (162) and control (158) group (Fig.1)
•IBD-QOL significantly improved among HealthPROMISE patients over a follow-up of 575 days (25.2 ± 11.3 vs. 30.3 ± 11.3 baseline, p<0.001).
•Uncontrolled anxiety and fatigue were major drivers of poor QOL.
•Patients with a college education reported significantly less symptom burden (29.3vs 36.8, range 10–70; P<0.001).
•After a follow-up of 575 ± 135 days, more significant increase in QOC was observed among HealthPROMISE users (+34 ppt vs. +15 ppt, p<0.01) (Fig.2).
A significant improvement in QOC was observed among patients using the mobile based app, who also reported more equitable participation in their care decision-making process and improved health outcomes. Digital health interventions and IBD remote monitoring can address gaps in QOC, increase patient engagement, improve QOL and health outcomes. This is one of the first randomized controlled trials of app-based PRO in IBD patients.
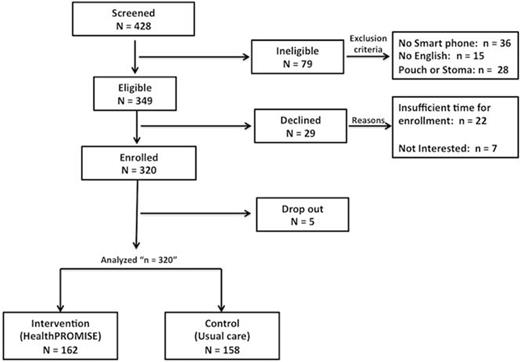
Study inclusion/exclusion criteria flowchart.
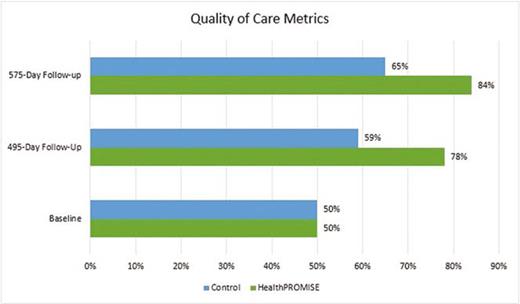
Change in percentage of patients meeting eligible qoc metrics at 495 days from baseline (+9 pp control vs. +28 Pp healthpromise, p<0.01) And at 575 days from baseline (+15 ppt control vs. +34 Ppt healthpromise, p<0.01).


