


Although anti–tumor necrosis factor (TNF) agents are effective in patients with inflammatory bowel disease (IBD), many patients either do not respond to anti-TNF treatment or lose response over time. The aim of this study was to determine factors associated with response to anti-TNF therapy in IBD.
Patients with Crohn's disease (CD) or ulcerative colitis who had consented to participate in a genetics registry and been treated with anti-TNF agents were evaluated retrospectively and categorized as primary nonresponders or secondary nonresponders. We evaluated clinical, serological, and genetic characteristics associated with primary nonresponse or time to loss of response to anti-TNF agents.
We included 314 CD (51 [16.2%] primary nonresponders and 179 [57.0%] secondary nonresponders) and 145 subjects with ulcerative colitis (43 [29.7%] primary nonresponders and 74 [51.0%] secondary nonresponders). Colonic involvement (P = 0.017; odds ratio = 8.0) and anti-TNF monotherapy (P = 0.017; odds ratio = 4.9) were associated in a multivariate analysis with primary nonresponse to anti-TNF agents in CD. In addition, higher anti–nuclear cytoplasmic antibody levels (P = 0.019; hazard ratio = 1.01) in CD, anti–nuclear cytoplasmic antibody positivity (P = 0.038; hazard ratio = 1.6) in ulcerative colitis, and a positive family history of IBD (P = 0.044; hazard ratio = 1.3) in all patients with IBD were associated with time to loss of response to anti-TNF agents. Furthermore, various known IBD susceptibility single-nucleotide polymorphisms and additional variants in immune-mediated genes were shown to be associated with primary nonresponse or time to loss of response.
Our results may help to optimize the use of anti-TNF agents in clinical practice and position these therapies appropriately as clinicians strive for a more personalized approach to managing IBD.
Inflammatory bowel diseases (IBDs), chronic inflammatory diseases of the gastrointestinal tract that include Crohn's disease (CD) and ulcerative colitis (UC), can effectively be treated with anti–tumor necrosis factor (TNF) agents that have shown clear benefits over conventional treatments for inducing and maintaining clinical remission in both CD and UC.1,–4 Currently, infliximab, adalimumab, and certolizumab pegol have proven to be effective in patients with CD, whereas infliximab, adalimumab, and golimumab are effective in the treatment of UC.5,6 However, multiple studies have shown that response to these agents is highly heterogeneous and a high proportion of patients either fail initial induction therapy (primary nonresponse) or lose response (secondary loss of response) during maintenance therapy.7,8 In addition, new therapeutic strategies including anti–leukocyte adhesion molecules and others are either available or in development for the treatment of IBD.9,10 Therefore, the identification of factors associated with response to anti-TNF therapy will facilitate optimal use of anti-TNF agents in clinical practice and position these therapies appropriately as clinicians strive for a more personalized approach to managing IBD. In addition, identifying pathways/processes involved in nonresponse to anti-TNFs will shed light on the underlying biology in these difficult-to-manage patients and potentially identify opportunities for novel therapeutic development or even repurposing of existing drugs to address this significant unmet medical need.
In this study, we aimed to determine clinical, serologic, and genetic factors associated with failure to respond to induction therapy with anti-TNF agents in patients with IBD. We also examined these factors and their relationship with time to loss of response during maintenance therapy in patients with IBD with an initial response to treatment.
Methods
Patient Population
The medical records of all patients seen at the IBD Center and Pediatric IBD Center at Cedars-Sinai Medical Center (CSMC) were reviewed to identify patients with IBD exposed to anti-TNF therapies. Diagnosis of IBD was determined by clinical, endoscopic, radiological, and histological criteria.11,12 We selected patients with IBD who had consented to participate in a genetics registry and had been treated with anti-TNF agents (infliximab, adalimumab, and certolizumab pegol for CD; infliximab, adalimumab, and golimumab for UC). The clinical notes of these patients were reviewed. Patients with insufficient information or unclear medical records were excluded from this study.
We only included patients with first exposure to anti-TNF agents and patients who had a standard regimen in terms of dose and interval. Initial doses of each of the anti-TNF agents for patients were 5 mg/kg for infliximab, 160 mg for adalimumab, 400 mg for certolizumab pegol, and 200 mg for golimumab. Among baseline steroid users at the time of anti-TNF initiation, those classified as responders to anti-TNF had discontinued or tapered off steroid use during the induction period. We did not classify continuing steroid users as responders to anti-TNF. Patients who had not tapered off or discontinued steroid use during induction were classified as nonresponders. Patients on combination therapy were defined as receiving immunomodulators at the time of anti-TNF initiation and continuing immunomodulator use for more than 6 months. We excluded patients who discontinued anti-TNF treatment immediately after successful induction or discontinued use due to other reasons such as intolerance, noncompliance, and nonmedical reasons such as loss of insurance. Patients exposed to nonstandard induction methods such as episodic therapy, anti-TNF initiation after surgery in UC, indeterminate colitis, and patients enrolled in a clinical trial were also excluded. Subjects were only included if full demographic, clinical, serological, and genetic data were available including adequate follow-up at our center after initiation therapy to allow assessment of response. This study was approved by the CSMC Institutional Review Board (IRB No. Pro00038598).
Definitions
Clinical response to anti-TNF therapy was defined as marked reduction in diarrhea and abdominal pain, or in the case of patients with fistulae, a decrease in the drainage, size, or number of fistulae for CD, and marked reduction in the amount of diarrhea, hematochezia, and abdominal pain for UC. Patients not meeting one of the above definitions were classified as nonresponders.
Patients treated with anti-TNF therapy were categorized into 3 groups: primary nonresponse, secondary nonresponse, and durable response. Primary nonresponse was defined as failure of initial induction by 8 weeks (for UC) or 12 weeks (for CD) after initiation of anti-TNF therapy. Secondary nonresponse was defined as loss of response during maintenance after successful induction. This loss of response was characterized by a reappearance of symptoms consistent with a flare after initial response, and the time from induction to loss of response was recorded. Durable response refers to patients who were not primary or secondary nonresponders (in other words patients who maintained response after successful induction). Time from induction to last clinical follow-up was recorded for these durable responders.
Clinical and Serological Parameters
Demographic and clinical data were collected by review of medical records and included the following: age at diagnosis; sex; race; body mass index; smoking status; family history of IBD; disease distribution and behavior; extraintestinal manifestations; surgery history; time to surgery; medication history of immunomodulators and corticosteroids; type of anti-TNF medication; age at anti-TNF initiation; time to anti-TNF initiation after initial diagnosis; and duration of follow-up. Given the relatively recent introduction of drug levels and drug antibodies and limited availability of these tests historically, many of our patients did not have these data available and so we were not able to include these data in our analyses.
IBD-associated serological markers including anti–Saccharomyces cerevisiae antibodies (ASCA IgG and IgA), anti–nuclear cytoplasmic antibody (ANCA), anti-flagellin (anti-CBir1), anti–Escherichia coli outer membrane protein C (anti-OmpC), and anti-Pseudomonas fluorescens–associated sequence I2 (anti-I2) were measured by enzyme-linked immunosorbent assay as previously described.13 All sera were analyzed in a blinded fashion at CSMC. Antibody levels were determined and results expressed as enzyme-linked immunosorbent assay units (EU/mL) as compared to a positive control.13 Serological markers were analyzed as both continuous variables (antibody level) and binary outcomes (antibody presence/absence).
Genotyping and Quality Control
DNA samples from B-lymphoblastoid cell line specimens were genotyped at CSMC using Illumina Infinium Immunochipv1 array per manufacturer's protocol (Illumina, San Diego, CA). Average genotyping call rate for samples that passed quality control was 99.8%, with an average replicate concordance rate >99.99% for genotyping controls. Single-nucleotide polymorphisms (SNPs) underwent methodological review and were evaluated using several SNP statistic parameters to ensure optimal allele calling.14 A total of 133,375 SNPs passed genotyping quality control measures.
Statistical Analyses
Descriptive statistics were used to analyze baseline characteristics and descriptive numerical values were described by mean ± SD and percentage (%). Univariate analyses of clinical and demographic variables were performed using the Chi-square test or Fisher's exact test for categorical variables and using regression analyses for continuous variables. Regression was used for all multivariate analyses of clinical and demographic variables and bootstrapping was performed to evaluate the performance of the multivariate model using Pseudo R-squares. Variables associated with time to loss of response were assessed using Cox proportional hazards regression using time to information (R survival package15) for univariate and multivariate analyses. As an exploratory study to identify variables for inclusion in a multivariate model, variables with P < 0.1 in univariate analyses were then evaluated in a multivariate analysis.15,16 All analyses were performed in R.17,18 Because of different disease characteristics between CD and UC, only demographic variables (sex, race, family history of IBD, body mass index, and age at diagnosis) were included for all IBD combined analyses. Kaplan–Meier method was applied to estimate the time to loss of response in CD and UC separately and compared by the log rank method using IBM SPSS statistics version 23.
Single-marker genetic association analysis was performed on subjects with available genetic data using logistic regression or Cox proportional hazards regression correcting for population substructure using 2 principal components (R; PLINK).17,–19 All clinical or demographic variables with trends toward significance (P < 0.1) in multivariate analysis were included as covariates in genetic analyses to control for potential confounding. SNPs with missing data >3%, minor allele frequency <5%, and deviations from Hardy–Weinberg equilibrium in controls <1 × 10⁻⁴ were excluded; 89,442 SNPs remained available for analysis. In addition, samples with sex or pedigree discrepancies or >3% missing data were excluded. Two hundred ninety-eight subjects with CD and 131 subjects with UC remained available for logistic regression analyses; 250 subjects with CD and 99 subjects with UC with either time to loss of response (secondary nonresponders) or time to follow-up (durable responders) remained available for Cox proportional hazards regression analyses. All analyses were performed separately for CD, UC, and IBD combined.
Genetic Risk Scores (GRSs) were calculated as previously described.20 Briefly, GRSs were calculated as a weighted sum of the number of risk alleles carried by an individual (0, 1, or 2) at each known CD-specific or UC-specific loci, with weights proportional to the effect estimates from previously published large-scale association studies.21,22
Network and Pathway Analyses
We constructed a gene network based on the top 499 genes corresponding to SNPs with P value less than 0.01 in the primary nonresponse regression analysis for the combined IBD group. Genes were annotated using multiple biologically functional databases including Reactome,23 Human Protein Reference Database,24 and NCI/Pathway Interaction Database.25 Networks constructed from known interactions recognized in these databases identified interactions between 82 of the 499 genes. Top KEGG pathways associated with these 82 genes were identified using the enrichment analysis tool in STRING.26
Results
Demographic and Baseline Clinical Characteristics
A total 314 patients with CD and 145 patients with UC met our inclusion criteria. Among patients with CD, 51 patients (16.2%) were categorized as primary nonresponders, 179 (57.0%) were secondary nonresponders, and 84 (26.8%) were durable responders. Among patients with UC, 43 (29.7%) were classified as primary nonresponders, 74 (51.0%) were secondary nonresponders, and 28 (19.3%) were durable responders (Tables 1 and 2).
Baseline Clinical Characteristics in Patients with CD Classified as Primary Nonresponse, Secondary Nonresponse, and Durable Response to Anti-TNF Agents
 |
|
Baseline Clinical Characteristics in Patients with CD Classified as Primary Nonresponse, Secondary Nonresponse, and Durable Response to Anti-TNF Agents
|
|
Baseline Clinical Characteristics in Patients with UC Classified as Primary Nonresponse, Secondary Nonresponse, and Durable Response to Anti-TNF Agents
 |
|
Baseline Clinical Characteristics in Patients with UC Classified as Primary Nonresponse, Secondary Nonresponse, and Durable Response to Anti-TNF Agents
|
|
Clinical Variables Associated with Primary Nonresponse
Patients with UC were more likely to be primary nonresponders to anti-TNF therapy compared with patients with CD (29.7% versus 16.2%, respectively, P = 0.001; odds ratio [OR] = 2.2; 95% confidence interval [CI], 1.37–3.46). Variables associated, in univariate analysis, (P < 0.05) with primary nonresponse in CD included current smoking (P = 0.0015; OR = 5.0; 95% CI, 1.77–14.07), colonic involvement (P = 0.012; OR = 3.5; 95% CI, 1.17–11.14), monotherapy of anti-TNF agents (P = 0.013; OR = 2.8; 95% CI, 1.14–7.21), and higher mean age at anti-TNF initiation (P = 0.042; OR = 1.02; 95% CI, 1.00–1.04) (Table 3). Several additional variables were also associated at P < 0.1, and these were included in the multivariate analyses (Table 3 and See Table 1, Supplemental Digital Content 1, http://links.lww.com/IBD/B512). Colonic involvement (P = 0.017; OR = 8.0; 95% CI, 1.46–43.91), monotherapy (P = 0.017; OR = 4.9; 95% CI, 1.32–18.34), and smoking (P = 0.059; OR = 4.0; 95% CI, 0.95–16.99) remained significant at P < 0.1 in multivariate analysis (Table 3). With bootstrapping, we observed a Pseudo R-square of 0.25 (95% CI, 0.14–0.36) for the multivariate model. There were no variables associated P < 0.1 with primary nonresponse in UC (See Table 2, Supplemental Digital Content 2, http://links.lww.com/IBD/B512). When analyzing all patients with IBD together for select demographic variables including sex, race, family history of IBD, body mass index, and age at diagnosis, higher mean age at diagnosis (P = 0.056; OR = 1.02; 95% CI, 1.0–1.03) was the only variable nominally associated with primary nonresponse in IBD.
Variables Associated with Primary Nonresponse to Anti-TNF Therapy in CD
 |
|
Variables Associated with Primary Nonresponse to Anti-TNF Therapy in CD
|
|
Clinical Variables Associated with Time to Loss of Response
The median time to loss of response after successful induction was 28.1 ± 3.9 (median ± SE) months in CD and 15.2 ± 2.0 months in UC, respectively (P = 0.001) (Fig. 1). Variables associated in univariate analysis (P < 0.1) with time to loss of response in CD included current smoking (P = 0.042; hazard ratio [HR] = 2.0; 95% CI, 1.02–3.87), family history of IBD (P = 0.029; HR = 1.4; 95% CI, 1.04–1.93), perianal disease (P = 0.064; HR = 1.3; 95% CI, 0.98–1.80), and high ANCA levels (P = 0.003; HR = 1.007; 95% CI, 1.00–1.01) (Table 4). High ANCA levels (P = 0.019; HR = 1.006; 95% CI, 1.00–1.01) and family history (P = 0.071; HR = 1.4; 95% CI, 0.98–1.87) remained associated (P < 0.1) in multivariate analysis (Table 4). Regarding UC, both OmpC negativity and ANCA positivity were associated with time to loss of response in both univariate (P = 0.066; HR = 0.4; 95% CI, 0.14–1.07 and P = 0.025; HR = 1.7; 95% CI, 1.07–2.75, respectively) and multivariate analyses (P = 0.089; HR = 0.4; 95% CI, 0.15–1.14 and P = 0.038; HR = 1.6; 95% CI, 1.03–2.64, respectively) (Table 5). When analyzing all patients with IBD together, positive family history of IBD was the only variable associated with time to loss of response (P = 0.044; HR = 1.3; 95% CI, 1.01–1.71).
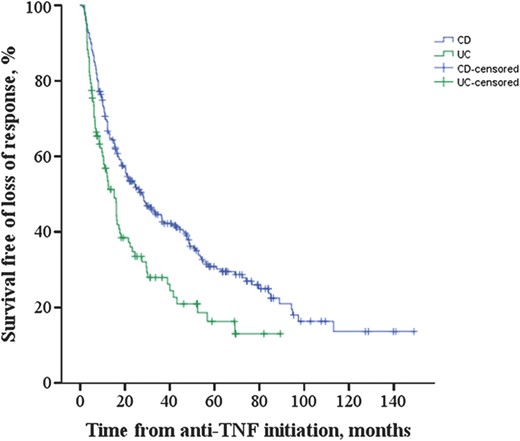
Kaplan–Meier curves for survival free of loss of response in patients with CD and UC who had complete response to anti-TNF therapy. The median ± SE time to loss of response was 28.1 ± 3.9 months in CD and 15.2 ± 2.0 months in UC, respectively (P = 0.001).
Variables Associated with Time to Loss of Response in CD
 |
|
Variables Associated with Time to Loss of Response in CD
|
|
Variables Associated with Time to Loss of Response in UC
 |
|
Variables Associated with Time to Loss of Response in UC
|
|
Genetic Associations with Primary Nonresponse
We focused our genetic association analyses on all subjects with IBD combined, as this allowed us the largest sample size and thus greatest power. However, we did not observe any genetic associations that achieved genome-wide significance levels (P < 5 × 10⁻⁸). SNPs in loci encompassing DTNBP1, RHCG, SYNGAP1, and DAXX genes achieved nominal significance (P < 1 × 10⁻⁴) with primary nonresponse (Table 6). Among known IBD-associated loci,21,22 SNPs tagging DENND1B and AHR were associated (P ≤ 0.01) with primary nonresponse (Table 6). We constructed a gene network based on the top 499 genes corresponding to SNPs with P value less than 0.01 from primary nonresponse regression analysis in IBD and observed that 82 genes interact with one another (Fig. 2). These 82 genes represent key pathways implicated in primary nonresponse to anti-TNF agents in IBD (Table 7). Additional nominal genetic associations with primary nonresponse in CD and UC are included in Tables 3 and 4, Supplemental Digital Content 3 and 4, http://links.lww.com/IBD/B512, respectively.
SNPs Associated with Primary Nonresponse to Anti-TNF in Inflammatory Bowel Disease
 |
|
SNPs Associated with Primary Nonresponse to Anti-TNF in Inflammatory Bowel Disease
|
|

Network of genes implicated in primary nonresponse to anti-TNF agents in IBD.
Pathways Implicated in Primary Nonresponse to Anti-TNF in Inflammatory Bowel Disease
 |
|
Pathways Implicated in Primary Nonresponse to Anti-TNF in Inflammatory Bowel Disease
|
|
We assessed the overall genetic burden by calculating CD-specific or UC-specific GRSs for all our subjects.20,–22 We did not observe any association with UC primary nonresponders and UC-specific GRS (P = 0.850), or any associations with CD primary nonresponders and either CD-specific or UC-specific GRS (P = 0.356 and P = 0.360, respectively). However, we observed a protective association between UC primary nonresponders and CD-specific GRS (P = 0.016; OR = 0.35).
Genetic Associations with Time to Loss of Response
Similarly, we did not observe genetic associations achieving genome-wide significance (P < 5 × 10⁻⁸) in our time to loss of response analysis in IBD. Genetic variants at loci, including LUZP2, ZNF226/ZNF227, NRP1/PARD3, and SLIT1, achieved nominal significance (P < 1 × 10⁻⁴) with loss of response (Table 8). In addition, a number of known IBD-susceptibility loci were associated (P ≤ 0.01) with time to loss of response, including SNPs tagging PREP/PRDM1, chr21q22.2, CD28, SMAD3, and IFIH1 (Table 8). Additional nominal genetic associations with time to loss of response in CD and UC are included in Tables 5 and 6, Supplemental Digital Content 5 and 6, http://links.lww.com/IBD/B512, respectively.
SNPs Associated with Time to Loss of Response in Inflammatory Bowel Disease
 |
|
SNPs Associated with Time to Loss of Response in Inflammatory Bowel Disease
|
|
Discussion
TNF-α is a major proinflammatory cytokine involved in the immune response in IBD.27 Anti-TNF drugs, indicated in patients with moderate-to-severe CD and UC who do not tolerate or respond to conventional therapies,5,6 have shown significant efficacy in IBD.28,–32 However, despite overall safety and effectiveness, approximately one-third of patients do not respond to anti-TNF drugs and many of those with successful initial induction lose response over time. Only 30% of responders maintain steroid-free remission at 12 months.7,8,33 With the recent approval of new biologic agents for IBD and others in the pipeline, strategies to correctly position these agents are urgently required to optimize treatment approaches in IBD.9,10 In our study, we demonstrated clinical, serologic, and genetic associations with response to anti-TNF therapy among patients with CD and UC.
We identified colonic involvement as a key predictor of nonresponse among those with CD and also found that primary responders with UC had a significantly shorter time to secondary loss of response than the corresponding primary responders in CD. In severe colitis, massive intestinal loss of proteins, electrolytes, and other minerals occurs through the ulcerated epithelial surface.34 It is well established that patients with severe colitis often require higher than standard doses of anti-TNF antibodies to achieve clinical improvement.35 Intestinal loss of infliximab is associated with a diminished response or treatment failure in patients with moderate to severely active UC.36 Therefore, the colonic fecal loss of drug may explain our findings and raise the question of whether “UC-like” patients with CD with disease limited to the colon should be considered for early optimization of drug dosing, as suggested for patients with severe UC. In keeping with a previous report, we also observed that current smokers with CD were less likely to respond to anti-TNF therapy.33
In addition, we found that high ANCA level in CD and ANCA positivity in UC was associated with time to loss of response. Although ANCA is usually associated with UC,37 up to a quarter of patients with CD express ANCA and ANCA “positive” patients with CD have a more “UC-like” clinical phenotype.38 Although our associations with ANCA in both UC and CD are borderline significant, they are in keeping with previous studies. ANCA status has been shown to predict early response to infliximab, as patients with negative ANCA status were more likely to respond to infliximab than patients with positive ANCA status.39,40 ANCA was also associated with an increased clinical relapse risk in patients with UC.41 A prospective study evaluating the utility of ANCA status in clinical decisions about positioning of anti-TNF therapy would be of use, given the cumulative findings of its association with anti-TNF nonresponse.
We generated GRSs for all our subjects by combining known CD-specific or UC-specific SNP associations to summarize the total load of CD- or UC-specific genetic risk and observed a protective association between primary nonresponders and CD-specific GRS in our subjects with UC (P = 0.016; OR = 0.35). These results suggest that patients with UC who are genetically more “CD-like” are more likely to respond.
Collectively, these data suggest that subjects who have “UC-like” CD anatomically (colon location) and serologically (ANCA positive) are less likely to respond to anti-TNF agents. This may be related to colonic loss of drug as previously described. Alternatively, we have previously published an association between a variant in TNFRSF1B gene encoding TNF receptor 2 (TNFR2), higher ANCA level, and low serum TNFR2 level in both CD and UC suggesting that this may contribute to the mechanism of nonresponse.42 Furthermore, ANCA expression has previously been associated with distinct clinical UC phenotypes, including a more aggressive disease course.43 Therefore, the presence of ANCA should prompt clinicians to think about strategies for optimizing these drugs and closely monitoring for loss of response.
Our findings support previous studies demonstrating the benefits of concomitant immunomodulators with anti-TNF therapy, even in patients who have previously failed immunomodulators.44,45 Improved efficacy with combination therapy is presumably because of both a reduction in immunogenicity with a resultant increase in serum anti-TNF levels and a direct effect in reducing disease activity.46 Combination therapy is associated with higher anti-TNF drug levels and less antidrug antibody production. Our study showed that anti-TNF monotherapy relative to combination therapy with 6-mercaptopurine, azathioprine, or methotrexate was a predictor of primary nonresponse to anti-TNF agents in CD. Among immunomodulator naive patients with moderate-to-severe CD, the SONIC study showed that combination therapy was superior to infliximab monotherapy with respect to corticosteroid-free clinical remission and mucosal healing.45 Similar results in moderate-to-severe UC were seen in the UC-SUCCESS trial, favoring combination therapy with azathioprine and infliximab over infliximab monotherapy for clinical remission and mucosal healing at week 16.47
IBD is characterized by excessive and abnormal immune responses against commensal flora in genetically susceptible individuals, which involves both innate and adaptive immunity.48 Genetics and the immune system play an important role in the development of IBD, and differences in response may be due to the patient's genetic background.49 Others have demonstrated that genetics may account for interindividual differences in response to anti-TNF treatment,15,50,51 and that genetic markers predictive of drug response, such as haplotypes in IL11, may ultimately play a role in treatment optimization.52,53 In keeping with these previous findings, we also observed associations with variants in IL11 and time to loss of response to anti-TNF in CD, UC, and IBD combined (rs1126757: P = 0.013, HR = 0.76; P = 0.00079, HR = 0.56; P = 0.00056, HR = 0.73, respectively). We also replicated association with rs9904253 (chr17q24.3) and primary nonresponse (P = 0.0086; OR = 0.45) and time to loss of response (P = 0.015; HR = 0.75) in CD.15 In addition, our findings suggesting that a family history of IBD is associated with time to loss of response further implicate a genetic basis for drug response.
We identified a number of SNPs associated with primary nonresponse to anti-TNF agents in patients with IBD, although we did not identify any individual genetic associations achieving genome-wide significance, which is expected given our small sample size. One of these SNPs, DTNBP1, has previously been associated with susceptibility to Hermansky–Pudlak Syndrome, a disease associated with chronic inflammation in the gut.54 A DENND1B variant (rs2488397) predicted to be in the top 10% most deleterious genetic substitutions in the genome (PHRED-like scaled C-score = 16.3) is also associated with primary nonresponse in IBD and in UC.55 Pathway or network analyses may identify processes implicated by genetic associations. Our data suggest that genetic variation associated with primary nonresponse in IBD implicate “focal adhesion” and “cell adhesion molecules.” This is of particular relevance in light of the current interest in the use and positioning of anti–cell adhesion molecules for treatment of IBD. Also implicated through these network analyses is the “allograft rejection” finding which supports our previous study identifying significant overlap in the transcriptomic signature of patients with UC not responding to treatment and patients with renal transplant with graft rejection.56 Our network analysis based on the top 499 genes implicated key nodes in the networks, including RAC1, previously associated with both IBD and an unfavorable response to thiopurine therapy in IBD.57,58 RAC1 inhibitors are currently being evaluated for clinical use in oncology and our findings suggest possible opportunities for repurposing these agents in patients with IBD resistant to anti-TNF agents. RAC2, encoding another Rho GTPase family member implicated in IBD pathogenesis, was also observed as a key node. Rac2-deficient mice have been shown to exhibit more severe colitis in response to Citrobacter rodentium infection, and sequence analyses have identified a novel NCF2 variant, which results in reduced binding of the NCF2 gene product p67phox to RAC2, to be associated with very–early-onset IBD.59,60 Binding of NCF2 and RAC2 is a critical step in the assembly and activation of the NOX2 NADPH oxidase and the production of ROS.61 Additional interesting key nodes include established IBD loci IL2 and FYN, encoding a member of the Src family of tyrosine kinases with a well-established role in drug resistance, including resistance to tamoxifen and BCR-ABL inhibitors.62,–65 Interestingly, Fyn has been shown to be protective in acute dextran sulfate sodium-induced colitis, as FYN knock-out mice demonstrated worsened colitis, decreased IL-10, and increased IL-17 in splenocytes and the gut. These knock-out mice failed to thrive after removal of dextran sulfate sodium, suggesting a role for Fyn in promoting disease recovery.66 Furthermore, a network analysis of psoriasis identified FYN as a differentially expressed gene between lesional and nonlesional skin samples of patients with psoriasis, implicating FYN in psoriasis pathogenesis and suggesting a potential role for FYN inhibitors in the treatment of psoriasis.67
Among the genetic associations with secondary nonresponse in patients with IBD, Leucine Zipper Protein 2 (LUZP2) is associated with visceral adiposity,68 and a recent study has suggested that adiposity is associated with intestinal inflammation and a significant increase in clinical disease activity in patients with CD.69 In addition, the nonsynonymous IBD-associated SNP (rs1990760) at the IFIH1 locus is associated with altered expression of FGFRL1 implicated in fibrogenesis.22,70
Our study had several limitations including its retrospective design, the inclusion of a relatively small number of patients with UC in particular, the absence of standardized objective markers for determining response/nonresponse, no pharmacokinetic parameters, such as drug or antibody levels, and limited power to detect genetic associations. Despite the limitations, we identified clinical, serologic, and genetic factors associated with failure to respond to induction therapy or time to loss of response during maintenance therapy with anti-TNF agents in a well-characterized cohort. Our results demonstrate that colonic involvement and monotherapy were associated with primary nonresponse to anti-TNF agents in CD. In addition, high ANCA level in CD, ANCA positivity in UC, and a positive family history in all IBD were associated with time to loss of response during maintenance. We also found genetic pathways of interest related to cell adhesion and transplant rejection and suggest opportunities for repurposing of existing therapies in this area of unmet medical need if our findings are confirmed.
Further additional well-powered and prospective studies including therapeutic drug monitoring are needed to validate our findings and to assess these factors as predictors of response to other classes of therapy used to treat CD and UC. Studies such as ours provide building blocks for the development of personalized medicine or patient-tailored care in IBD. Identifying groups of individuals less likely to respond to anti-TNFs will become increasingly important as additional therapeutic modalities become available for the treatment of IBD.
Acknowledgments
The Cedars-Sinai MIRIAD IBD Biobank is supported by the F Widjaja Foundation Inflammatory Bowel and Immunobiology Research Institute, NIH/NIDDK grants P01 DK046763, U01 DK062413, European Union, and The Leona M and Harry B Helmsley Charitable Trust.
References
Author notes
Supplemental digital content is available for this article. Direct URL citations appear in the printed text and are provided in the HTML and PDF versions of this article on the journal's Web site (www.ibdjournal.org).
B. D. Ye is a consultant for Abbvie Korea, CELLTRION, Inc., and Takeda Korea, and receives lecturing fees from Abbvie Korea, Janssen Korea, and CELLTRION, Inc. S. Rabizadeh is a consultant for Prometheus labs and Janssen. G. Y. Melmed is a consultant for Abbvie, Celgene, Jannsen, Merck, Pfizer, Samsung Bioepis, Takeda, and UCB, and receives grant support from Prometheus Labs. D. P. B. McGovern is a consultant for Janssen and UCB. The remaining authors have no conflict of interest to disclose.
S. M. Yoon and T. Haritunians contributed equally to this research.

