


The aim of this study was to survey the bacterial and viral communities in different types of samples from patients with Crohn's disease (CD) at different stages of the disease to relate their distribution with the origin and progression of this disorder.
A total of 42 fecal samples and 15 biopsies from 20 patients with CD and 20 healthy control individuals were collected for bacterial 16S rRNA gene profiling and DNA/RNA virome metagenomic analysis through 454 pyrosequencing. Their composition, abundance, and diversity were analyzed, and comparisons of disease status, patient status, and sample origin were used to determine statistical differences between the groups.
Bacterial composition and relative abundance in new-onset patients with CD differed markedly from control individuals. Individual variability and sample origin had a stronger impact on viral communities than the disease, contrary to what was observed for bacterial populations although increased numbers of overrepresented viruses were observed in feces from patients with CD. Correlation-based networks were constructed to show potential relations between bacteria and between those and viruses.
The bacterial community reflects the disease status of individuals more accurately than their viral counterparts. However, numerous viral biomarkers specifically associated with CD disease were identified. Because viruses can modulate bacterial communities, the correlation networks between both communities constitute a step forward in unraveling their interactions under normal and CD disease conditions.
Crohn's disease (CD) is a complex multifactorial disorder of unclear etiology. Genetic susceptibility and environmental factors can trigger the inflammatory response.1,2 It is believed to be caused by a dysregulated proinflammatory response to commensal gut microbiota.3,4 Aberrant microbiota has been in fact noted in patients with CD5,6; but, due to the inconclusive nature of the results, the causality remains controversial.7
Other factors suggest an association between specific viruses and CD. For example, the limited success of antibiotics and probiotics in patients with CD, the discovery of the potential role of certain viruses in CD-like disease in genetically susceptible mice,8 and other virus-focused studies in human patients with CD.9,–13 However, some of these do not display an exclusive association with CD and could be opportunistic, irrelevant, or could display only a weak association with the disease.
Viruses associated with the human gut and the microbiome, particularly bacteriophages, have been increasingly acknowledged as important components of this ecosystem, which may notably impact human health.14,–16 Gut-associated bacteriophages encode genes that produce virulence factors,17,18 toxins,19 or confer antibiotic resistance20 in host bacteria, modulating the bacterial community structure and metabolic production by the introduction of new traits or elimination of host species.21 Additionally, the gut virome composition seems to be altered in diseased individuals, suggesting that it may play a role in the pathogenesis of disorders associated with the perturbation of the gut ecosystem such as the inflammatory bowel disease.15
Metagenomic studies of the human gut virome have become increasingly relevant in the recent years,22,–28 and some have focused on viruses in the gut of patients with CD using 454 pyrosequencing.29,30
In this study, we have analyzed the viral and microbial communities present in intestinal biopsies and feces from adult patients with CD recently diagnosed and in active patients before and after surgery. We compared both communities in different patients and, in 2 cases, between those from the same patient before and after treatment and surgery. We also compared those patients with CD with a healthy control group to establish differences in taxonomical composition and abundance and to explore possible biomarkers.
Materials and Methods
Two sets of samples were included in this analysis. One of them was processed for this work, whereas the sequencing data from the other set were imported from a previously published study by the authors.29
Patients and Sample Collection
The study was approved by the Ethical Committee on Clinical Research of the Hospital Universitari i Politècnic La Fe de Valencia (Spain) in compliance with the Declaration of Helsinki. Twelve healthy individuals (control group) and 12 patients diagnosed with active CD living in Valencia, Spain, were selected for the analysis of their gut viral and microbial communities. Healthy participants reported no illnesses related to the gastrointestinal tract and had not undergone antibiotic treatment in the 3 months before sampling. All subjects gave written informed consent. Fecal samples from all subjects and biopsies from most of the patients with CD were collected. Biopsies from the bowel mucosa from new-onset patients were obtained by ileocolonoscopy before treatment, whereas surgical biopsies were obtained from both active and nonactive areas during surgery of active patients. According to the status of their disease, patients with CD were classified as active new onset (i.e., newly diagnosed), active (i.e., already diagnosed, having had no surgery for at least the past 6 months before sample collection) or active previous to surgery. In the latter, feces were collected just before surgery. Collected feces were frozen at −20°C and thus delivered to the hospital, except for hospitalized patients, whose feces were directly collected at the hospital facilities. All samples were immediately frozen at −80°C for storage.
Viral and Bacterial Isolation, Extraction, and Amplification of the 16S rRNA Gene and Viral DNA/cDNA
Biopsies underwent mechanical disruption before extraction by transferring them into sterile microcentrifuge tubes containing 600 μL of Hanks Balanced Salt Solution (HBSS; GIBCO, Gaithersburg, MD) at 4°C and one 3-mm tungsten bead, using a Tissuelyser II (Qiagen, Valencia, CA) at 30 Hz for 5 minutes. Disrupted tissue was then centrifuged at 4000g for 5 minutes, and the supernatant was transferred to a fresh 1.5 mL microcentrifuge tube, whereas the pellet was frozen at −70°C for bacterial analysis.
As for fecal samples, 2 aliquots per sample of ∼0.5 g of frozen stool were transferred to sterile 2 mL microcentrifuge tubes. One aliquot was used for the bacterial analysis and the other one for virome extraction.
Total DNA from the pellets obtained from biopsies and stool aliquots stored for bacterial analysis was extracted using the QIAamp DNA Stool kit (Qiagen) following the manufacturer's instructions but adjusting the volume of supernatant to 600 μL instead of 200 μL. Next, 1.0 μL of the DNA was used as a template for a PCR amplification using the universal 16S rRNA gene primers E8F (5′-AGAGTTTGATCMTGGCTCAG-3′) and B530R (5′-CCGCGGCKGCTGGCAC-3′) to amplify the highly variable regions V1, V2, and V3. PCR conditions, barcoded primers, purification, and quantification were used as described.29 Groups of 12 to 15 samples were pooled for subsequent library preparation and sequencing.
As for viruses, one volume of HBSS at 4°C was added to the second aliquot and mixed for homogenization. From that point, supernatants from biopsies and stool samples were handled following the same protocol. Two centrifugation steps at 13,400g, 5 minutes at 4°C were performed to pellet the remaining debris. Supernatants were transferred to fresh 1.5 mL microcentrifuge tubes and serially filtered using 0.45- and 0.20-μm pore size Acrodisc Syringe filters (Pall España, Madrid, Spain). The resulting volume was treated with a cocktail of DNases/RNases composed of 14 U of Turbo DNase (Ambion Inc., Austin, TX), 20 U of Benzonase (Novagen Inc., Madison, WI), and 20 U of RNAse A (Invitrogen, Carlsbad, CA) in DNAse buffer (Ambion), for 120 minutes at 37°C to remove unprotected nucleic acids of bacterial or eukaryotic origin.
Intact nucleic acids contained in the viral particles were extracted using the QiAamp viral RNA extraction kit (Qiagen) following the manufacturer's instructions. After the elution in 40 μL of AVE buffer, 0.5 μL of RNaseOUT (Invitrogen) were added. Aliquots of 9.0 μL of each sample were transferred to fresh 1.5 mL microcentrifuge tubes and digested with RQ1 DNase RNase-free (Promega, Madison, WI) at 37°C 30 minutes. Next, the digested aliquot containing only viral RNA and the remaining untreated volume containing a mixture of viral DNA and RNA were either stored at −70°C for later use or used straightaway for downstream amplification.
For each sample, a volume of 1.0 μL of genomic viral DNA was used as the template for amplification using a multiple displacement amplification strategy with illustra GenomiPhi V2 DNA Amplification Kit (GE Healthcare Life Sciences, Amersham, United Kingdom). Incubation for 2 hours at 30°C was followed by phi29 DNA polymerase inactivation for 10 minutes at 65°C.
As for the genomic viral RNA, first-strand cDNA was synthesized using the SuperScript III First-Strand Synthesis System for RT-PCR (Invitrogen) following the manufacturer's instructions, but adding 1.0 μL of 50 μM random hexamers specifically designed to have a fixed 20-nt sequence at their 5′-end to serve as a barcode sequence for later identification. These also allow for the anchoring of specific primers consisting of the identical 20-nt sequence without the 3′-end random hexamers Ns for a downstream sequence-independent single-primer amplification (SISPA) amplification step. A set of 32 + 32 different primers (the same ones, with and without the random hexamers) were designed to randomly amplify samples and also to act as barcodes for pooling different samples (see Table, Supplemental Digital Content 1, http://links.lww.com/IBD/B22, which illustrates the primer sequences designed for the SISPA amplification of RNA viruses). OligoAnalyzer3.1 (Integrated DNA Technologies, Inc., Coralville, IA) was used to check for potential formation of hairpins and homodimers, according to the manufacturer's instructions.
The second-strand cDNA was synthesized by adding 10X Klenow buffer (New England Biolabs, Beverly, MA), 5 units of Klenow fragment (New England Biolabs), and nuclease-free water (Invitrogen) to the reaction volume of 20 μL of single stranded cDNA to obtain a final volume of 34.5 μL. A 40-μL PCR mix was prepared using a PCR Kit (Bioline, London, United Kingdom), each containing a barcode primer. In each reaction 20 μL of Biomix, 17 μL of H2O, 2 μL double-stranded cDNA and 1 μL of the corresponding 20 μM SISPA primer were present. SISPA-PCR conditions were 95°C for 2 minutes followed by 30 to 40 cycles of 94°C for 30 seconds, 65°C for 30 seconds, and 72°C for 2 minutes 30 seconds and a final elongation step at 72°C for 10 minutes (most feces required 30–32 cycles to reach the amount of DNA required for sequencing, whereas biopsies needed up to 40). SISPA-PCR products were confirmed by gel electrophoresis on a 1.4% agarose gel and purified by ultrafiltration using NucleoFast 96 PCR plates (Macherey-Nagel, Düren, Germany).
The amplified nucleic acids were quantified using Quant-iT PicoGreen dsDNA Assay Kit (Invitrogen), and 0.5 μg of DNA per sample were pooled for shotgun library preparation.
Pyrosequencing and Sequence Analysis
The 16S rRNA gene and viral DNA sequence reads from 8 healthy and 8 CD patients from a previous study by Pérez-Brocal et al29 were included in the sequence analysis. Along with the 24 individuals participating in this study (see Patients and Sample Collection), the data sets totaled 40 individuals.
Bacterial 16S rRNA gene amplicons (2 sequencing replicates were performed) and viral whole-genome shotgun sequencing were conducted on a 454 GS-FLX Titanium pyrosequencer.
Bioinformatic preprocessing of the bacterial 16S rRNA gene raw reads was performed as described previously.29 Bacterial 16S rRNA gene raw reads were quality and size-filtered using MOTHUR v.1.33.0,31 to remove <200 nt sequences and chimeras. The FASTA files containing pooled reads were demultiplexed using the FASTX-Toolkit. QIIME version 1.8.0 workflow32 was used to determine the diversity and structure of bacterial communities. Samples were normalized to avoid potential biases due to sampling differences. Sequence clustering into operational taxonomic units (OTUs) was carried out with usearch33 using a sequence similarity of 97%. Taxonomy was assigned using the RDP Classifier algorithm34 with the Greengenes 13_5 database clustered at 99% identity. Sequences were aligned to the database entries using PyNAST 1.2.1.35
For viruses, sequences were demultiplexed using molecular barcodes and trimmed using FASTX Barcode Splitter and FASTA/Q Trimmer tools, respectively. Next, PRINSEQ (version 0.20.4)36 was used to filter low-complexity sequences, short reads <50 nt, and reads containing ambiguous characters. The remaining reads were sequentially mapped using the local alignment mode of Bowtie 237 against the human genome and the human microbiome databases. Reads matching the human genome were removed from the analysis, whereas those aligning with bacteria plus the unaligned reads were compared using tBLASTx (e-value < 10−3) against an in-house nonredundant viral and prophage nucleotide database (Virusdb_2015_03_05) used for virus identification. This database consisted of 99% identity clusters of a collection of complete viral genomes from the EBI and NCBI sites, (ftp://ftp.ebi.ac.uk/pub/databases/fastafiles/embl_genomes/genomes/Phage/, ftp://ftp.ncbi.nih.gov/genomes/Viruses/all.fna.tar.gz), updated on March 2015, and all available viral sequences from the International Nucleotide Sequence Database Collaboration (INSDC), accessed from the EMBL-EBI ftp site at ftp://ftp.ebi.ac.uk/pub/databases/fastafiles/emblrelease/, and prophages and viruses from ACLAME version 0.4 (A CLAssification of Mobile genetic Elements, http://aclame.ulb.ac.be/).38 Viral hits were taxonomically assigned using a set of Perl programs to automate the process of taxonomic binning at order, family, genus, and species level. The criterion used to name the viral taxonomy was as previously described.29 Three background assumptions were considered to approach viral analysis. First, that the resulting sequence reads were proportional to their actual abundance in the niche, regardless of the bias effect during the amplification steps due to the genome topology and size. Second, the best hits were selected based solely on the homology provided by aligning sequences to reference templates, which does not necessarily imply that those viruses were actually present but only that there are sequences in the reference database that are close enough to the query sequences. Finally, the contingency tables were just a representation of the observed abundance of unassembled sequence reads rather than the number of genome molecules or individual viral particles in the samples. In-house scripts were used to summarize the tBLASTx results into normalized taxonomic contingency tables compatible in BIOM format.
After creation, the 16S rRNA gene-based bacterial and the viral contingency tables were analyzed using the QIIME version 1.8.032 workflow. Samples were grouped according to their sample origin (stool/biopsies), disease status (control/CD), and within patients with CD considering the patient status.
Richness and diversity box plots, sample clustering, heatmaps, and correlation networks between bacteria and between viruses and bacteria were generated with in-house R scripts (R version 3.1).39
Statistical Analyses
QIIME was used to measure the diversity within samples using the Chao1 richness estimator and the Shannon entropy index, and among samples, performing Principal Coordinate Analyses (PCoA) using Bray–Curtis and Canberra distance matrices. For comparisons between categories, the nonparametric statistical method for multivariate analysis of variance, adonis, was applied on both matrix files. The linear discriminant analysis effect size (LEfSe) method was applied to identify taxonomic biomarkers40 combining Kruskal–Wallis and pairwise Wilcoxon tests for statistical significance and feature selection. Default parameters were used for significance (α ≤ 0.05) and linear discriminant analysis threshold (2.0). Correlation-based networks were constructed based on nonparametric Spearman's rank correlation coefficients. To avoid spurious correlations, only bacteria and viruses appearing in at least half of the samples in each group were considered as nodes.
Virome and Microbiome Data Submission
The viromes and bacterial 16S rRNA gene data sets from this study are available in the EBI Short Read Archive under the study accession number PRJEB7166, with accession numbers (ERS540192–ERS540312 and ERS738915–ERS738955).
Results
Twenty healthy controls and 20 patients with CD were included for analysis in this study. Participant metadata are summarized in Table 1, while clinical details are summarized in Table 2.


Description of the Clinical Variables of the Patients with CDa
 |
|
Description of the Clinical Variables of the Patients with CDa
|
|
The ratio of females to males was 13:7 in the Control group and 12:8 in the CD group, and the average age was 33.45 ± 14.42 and 45.475 ± 18.12 years old, respectively. Stool samples were collected from all individuals. As for biopsies, 15 samples were obtained from 9 patients with CD; 7 were endoscopic and the rest surgical ones. The latter were obtained from morphologically affected and unaffected regions from the same patients. According to the status of their disease, 8 patients with CD were classified as new onset (i.e., newly diagnosed), 2 (active [onset]), 9 as active (active) and 5 as active previous to surgery (active [presurgery]), including 2 who had been formerly new-onset patients. Therefore, 2 sets of samples were obtained from the same individuals at 2 times: after diagnostic but before therapy and after surgery.
Raw data and distribution per sample are shown in Table, Supplemental Digital Content 2, http://links.lww.com/IBD/B23, which illustrates the sequence statistics for the bacterial 16S rRNA gene and viral shotgun analyses before and after processing.
Taxonomic Rank Distribution of Bacteria and Viruses
After preprocessing, the sequences the 57 samples accounted for 572,493 bacterial reads and 381,354 viral reads distributed as shown in Table, Supplemental Digital Content 2, http://links.lww.com/IBD/B23. Bacterial OTUs formed at 97% identity were assigned to 17 phyla, 39 classes, 66 orders, 121 families, 223 genera, and 126 species at 80% confidence threshold using the Naive Bayesian RDP offline classifier. Assignation is given per taxonomic rank, resulting in some of the clusters getting no taxonomic information (below the threshold) on a particular level (commonly, species or such). This is reported, e.g., as an undetermined species from a specific genus.
As for viral reads, 17.72% of the reads had homology with viruses. Homology was identified with 1782 viral species, 518 genera, 356 families, and 316 orders, including those viruses with no assigned taxonomic level (1741 and 41 species, 499 and 19 genera, 341 and 15 families, and 304 and 12 orders for DNA and RNA viruses, respectively).
Bacterial Composition and Abundance
Bacterial composition is shown in Figure A, Supplemental Digital Content 3, http://links.lww.com/IBD/B24, which illustrates the bacterial content in different groups of samples as Venn diagrams. When OTUs were considered (see Fig. A.1, Supplemental Digital Content 3, http://links.lww.com/IBD/B24), more bacteria were identified in fecal samples from the Control group (6544) than in the CD group (4306), the new-onset (2292), active (1978), and patients with CD previous to surgery (1963). Feces from the patients with CD contained more different OTUs than biopsies (3586). In contrast, when classified by the species taxonomic level (see Fig. A.2, Supplemental Digital Content 3, http://links.lww.com/IBD/B24), a higher number of different detected species is found in feces from the CD group (248) than in those from the Control group (170). Even in the new-onset CD group, 173 species were identified despite the small number of samples. Also, higher figures were found in the biopsies (412) when compared with feces from the CD group, contrary to the pattern reported for OTUs. However, 57 bacterial species were found in fecal samples from that group but not in biopsies (e.g., Alistipes indistinctus, Morganella morganii, Prevotella stercorea, several species from genus Lactobacillus, etc).
As for abundance, the global values and those of samples grouped by disease, patient status, and sample origin at different taxonomic levels are displayed in Table, Supplemental Digital Content 4, http://links.lww.com/IBD/B25, which illustrates the relative abundance of bacteria at the phylum, class, order, family, genus, and species taxonomic levels; classified by groups of samples, based on the 16S rRNA gene.
Bacterial Richness and Diversity
Results of the alpha diversity analyses comparing groups of samples, classified by patient status or treatment with steroids/immunosuppressors and sample origin are displayed in Figure 1, along with the P value corresponding to the t tests. Box plots based on the indexes' distribution calculated for patient status and sample origin (Fig. 1A) were significantly different and revealed a higher richness and diversity of bacterial OTUs in fecal samples from the Control group over any category of patients with CD. Feces from the latter had lower values than their corresponding indexes in their biopsies. When all fecal samples were compared with biopsies, the richness and diversity observed were higher. In biopsies, indexes were higher in presurgical patients with CD than in those at the onset, whereas in feces, presurgical patients with CD were significantly richer but less diverse in bacterial OTUs. Active patients did not differ significantly from new-onset ones in richness although they were slightly more diverse. As for the treatment (Fig. 1B), the use of immunosuppressors was associated with higher values for both indexes compared with the untreated patients, whereas fecal samples from patients treated with steroids had a reduced richness and diversity of bacterial OTUs, similar or lower to that observed in untreated patients. Actually, samples from patients treated with both produced values within the range of the 2 previous cases. In biopsies, there was a higher richness and diversity in samples from patients treated only with immunosuppressors than those treated only with steroids, but both were clearly higher than values observed in untreated patients. Statistically significant differences were found in most comparisons (P < 0.05) (Fig. 1C).
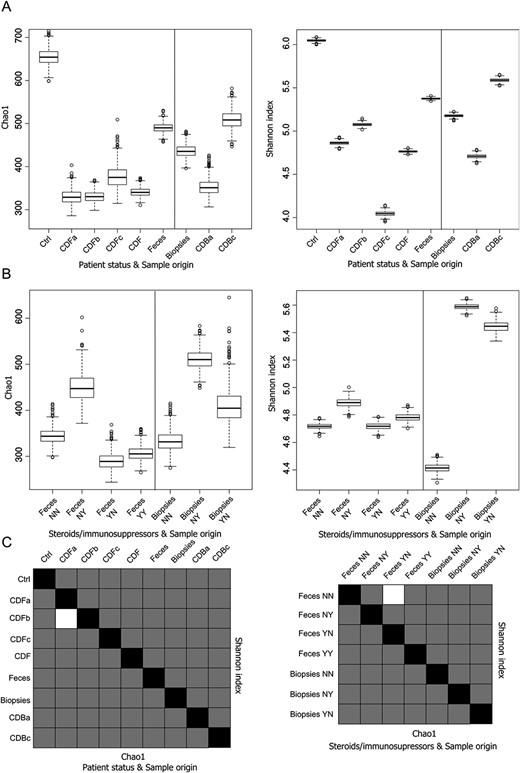
Box plots of bacterial alpha diversity and statistic significance t tests. A, Box plot representing the distribution of Chao1 richness estimator and Shannon entropy index of the samples according to the patient's status and the origin of the samples and (B) according to the administration of steroids and/or immunosuppressors and the origin of the samples. C, Chart summarizing the statistical significance of Student's t tests between all the comparisons. Lower diagonal represents the Chao1 richness estimator; upper diagonal represents the Shannon diversity index. Black squares represent self-comparisons; white squares mark nonsignificant comparisons, whereas gray squares are those that are statistically significant. A thousand rarefactions were drawn to equal 1757 no-replacement sets; average values and SDs were calculated from the replicates.
Comparisons between categories based on adonis tests (Table 3) demonstrated that bacterial communities differ between control individuals and patients with CD in general, including the new-onset ones. In addition, differences between fecal samples and biopsies from the patients with CD and those for treatment with steroids and/or immunosuppressors in all fecal samples were significant. The remaining comparisons displayed P values greater than 0.05.
Adonis Multivariate Analysis of Variance in Bacterial and Viral Communities
 |
 |
|
|
Adonis Multivariate Analysis of Variance in Bacterial and Viral Communities
|
|
|
|
Bacterial Biomarkers
The result of the detection of potential bacterial biomarkers with LEfSe in the comparison between fecal samples from the control individuals and the patients with CD is displayed in a cladogram (Fig. 1). OTUs identified as undetermined species within the classes Actinobacteria, Gammaproteobacteria, and Fusobacteria were in significantly higher amounts in patients with CD as were their lower taxonomic levels. For example, genus Actinomyces and species Propionibacterium acnes within the first class; genera Trabulsiella and Morganella or undetermined species within the family Enterobacteriaceae in the case of Gammaproteobacteria, or genus Fusobacterium in the last case. Some OTUs within the order Clostridiales, (e.g., genera Anaerostipes, Coprococcus, Lachnobacterium, Veillonella dispar and other undetermined Veillonella, and Eubacterium species) and in some Bacteroidales, (e.g., Bacteriodes caccae, the families Odoribacteraceae and Barnesiellaceae and the genus Odoribacter) were also significantly more abundant in this group. However, the abundance of several Clostridiales (e.g., genera Christensenella, Clostridium, Anaerofustis, Lachnospira, Roseburia, Anaerotruncus, Faecalibacterium, Ruminococcus, or species such as Coprococcus eutactus, Faecalibacterium prausnitzii, and Ruminococcus bromii) was significantly lower in patients with CD. Similarly, some Bacteroidales (e.g., genus Butyricimonas, or species such as Bacteroides eggethii, Alistipes indistinctus, or undetermined species within the family Rikenellaceae) displayed also a lower abundance in this group. Other comparisons were established between feces and biopsies within the CD patients group, between fecal samples of the control individuals and the new-onset, active, and presurgical patients with CD, and between those 3 statuses within patients with CD or between endoscopic and surgical biopsies. Those are displayed in Figure, Supplemental Digital Content 5, http://links.lww.com/IBD/B26, which illustrates the cladograms representing the discriminative features or potential bacterial biomarkers. For example, the comparison of the bacterial communities between feces from the Control group and the new-onset CD patients identified that the order Actinomycetales (specifically the species Propionibacterium acnes) and some isolated clostridia such as Clostridium difficile or Veillonella dispar (and related species) were more abundant in CD feces. In addition, the fusobacteria at different taxonomic levels and the genus Proteus (phylum Proteobacteria) were significantly more abundant in this group. In contrast, several Clostridiales, such as the family Christensenellaceae, the genera Clostridium, Lachnospira Anaerotruncus, and Ruminococcus; and species such as Coprococcus eutactus and an undefined Roseburia species were in significantly lower proportion in feces from the new-onset CD patients. A similar pattern was observed for genus Butyricimonas, and 2 species, an undefined Parabacteroides and Alistipes indistinctus belonging to the order Bacteoidales, and the order RF39 and its higher taxonomic levels (class Mollicutes and phylum Tenericutes).
The most remarkable differences appeared in comparison between stool and biopsies within the CD patients group, where members from Firmicutes and Tenericutes were globally more abundant bacteria in feces, whereas Actinobacteria, some Bacteroidetes and Proteobacteria contained more abundant members in biopsies. When the feces from the active patients with CD and those from the Control group were compared, class Bacilli (phylum Firmicutes) and Actinobacteria (phylum Actinobacteria), and phyla Fusobacteria and Proteobacteria stood out as more abundant in the CD patients group, whereas lower proportions of members from the order Clostridiales and the phylum Tenericutes characterized this group. The remaining comparisons (e.g., between the Control group and the patients with CD previous to surgery or between new-onset, active, and presurgical patients with CD) resulted in fewer bacterial biomarkers of interest. Comparisons displaying the highest number of differences were those between feces and biopsies and between the Control group and the whole CD group (Fig. 2) followed by Control–active, Control–presurgical, and Control–new-onset patients (see Fig., Supplemental Digital Content 5, http://links.lww.com/IBD/B26).

LDA cladogram of bacterial biomarkers. Cladogram representing the discriminative features or potential bacterial biomarkers between the fecal samples belonging to classes “Control” (n = 20, in green) and “CD_fecal” (n = 22, in red), using the linear discriminant analysis model results on the bacterial hierarchy. The taxonomic level for each significant OTU is denoted by a corresponding prefix: s__: species, g__: genus, f__: family, o__: order and c__: class.
Viral Composition and Abundance
After processing and searching for homology, the 41 samples accounted for 214,634 viral reads, distributed as shown in Table, Supplemental Digital Content 2, http://links.lww.com/IBD/B23.
Venn diagrams representing the viral OTU composition grouped at the species taxonomic level display those that are unique to each group of samples, and those that are common to them are displayed in Figure B, Supplemental Digital Content 3, http://links.lww.com/IBD/B24. In a comparison between feces from the individuals and the CD patients, 1410 viral species were identified in patients with CD patients, while 1071 were detected in the control individuals. Despite having a small sample size (n = 8), the new-onset CD group of patients contained 928 species, similar to control individuals, (n = 20). There were more than 3-fold the amount of viruses detected in feces from patients with CD than in biopsies (416).
As for the abundance, the details of taxonomic rank comparisons are displayed in Table, Supplemental Digital Content 6, http://links.lww.com/IBD/B27, which illustrates the relative abundance of viral read sequences at the order, family, genus, and species taxonomic levels, classified by groups of samples. In feces, homologies were mostly found with bacteriophages from the family Microviridae (46.6%) and from the order Caudovirales (23.2%), the uncultured phage crAssphage, and with prophages from the Clostridiales and Lactobacillaes bacterial orders and the eukaryotic viruses from the family Anelloviridae, whereas Virgaviridae was the largest RNA viral family (85.9%). Plant viruses were the dominant RNA viruses in feces (virgaviruses, sobemoviruses, tymoviruses, and potyviruses). However, homologies with picobirnaviruses, picornaviruses, and arenaviruses were also found. As for biopsies, microviruses (21.6%) constituted the most abundant hits (although not as predominant as in feces), followed by circoviruses, anelloviruses, and papillomaviruses, with the bacteriophages from the order Caudovirales in the fifth position (10.1%). Fewer RNA viruses were identified in biopsies, but these included eukaryotic viruses, along with a few plant viruses. These belonged to different families from those found in feces (Closteroviridae and Endornaviridae).
Comparison between feces and biopsies revealed a relatively lower number of reads homologous to bacteriophages in the latter, where DNA eukaryotic viruses were more abundant. Comparison between feces from the Control and CD groups showed, in general, fewer differences.
Viral Richness and Diversity
Results of the alpha diversity analyses were compared between groups of samples classified by patient status or treatment with steroids/immunosuppressors and sample origin, and their significance were assessed as shown in Figure 3. Differences in the distributions of alpha diversity indexes based on patient status and sample origin (Fig. 3A) showed that feces were significantly different, apparently richer, and more diverse than biopsies in all cases. Feces from the Control group were statistically different from those of the CD group as a whole, with higher values of the indexes. However, the CD new-onset patients showed the richest and the most diverse samples of all, and those from active patients with CD and especially from presurgery patients were seemingly responsible for the on-average lower diversity detected in feces from patients with CD. This pattern is also observed in endoscopic biopsies compared with those obtained from surgery. As for the treatment with steroids and/or immunosuppressors (Fig. 3B), samples from treated patients with CD showed lower values of the indexes than untreated individuals. In feces from patients with CD, lower richness and diversity were detected in samples from individuals treated only with immunosuppressors than in those treated only with steroids or with both, the latter showing values within the range of the other 2. Statistically significant differences were found in all comparisons (P < 0.05) except in 2 of them (Fig. 3C).
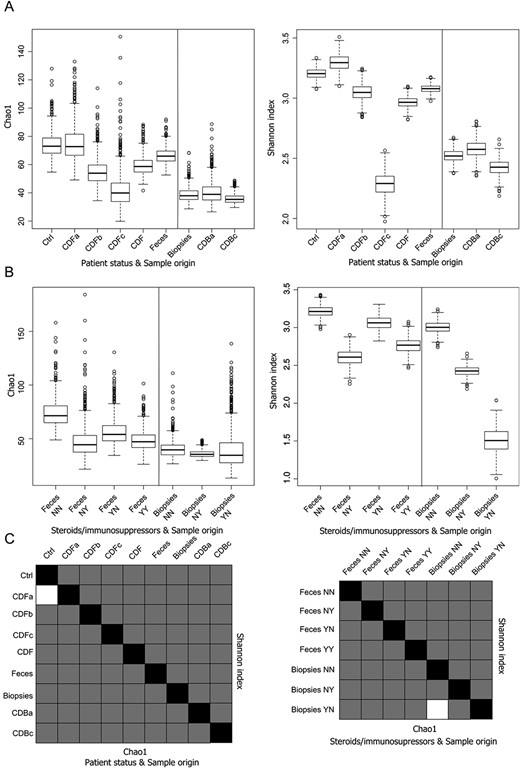
Box plots of viral alpha diversity and statistic significance t tests. A, Box plot representing the distribution of Chao1 richness estimator and Shannon entropy index of the samples according to the patient's status and the origin of the samples and (B) according to the administration of steroids and/or immunosuppressors and the origin of the samples. C, Chart summarizing the statistical significance of Student's t tests between all the comparisons. Lower diagonal represents the Chao1 richness estimator; upper diagonal represents the Shannon diversity index. Black squares represent self-comparisons; white squares mark nonsignificant comparisons, whereas gray squares are those statistically significant. A thousand rarefactions were drawn to equal 110 no-replacement sets; average values and SDs were calculated from the replicates.
Results for the statistical comparison between categories using adonis tests are shown in Table 3. Viruses in fecal samples from control individuals and patients with CD differed significantly with Bray–Curtis distances for all patients with CD but not for the new-onset ones. In viruses, the categories showing the smallest P values were the sample origin (stool versus biopsies) and the treatment with steroids and/or immunosuppressors in the case of stool samples.
Viral Biomarkers
Differential viral discriminant features showing statistical significance are candidates of interest to be considered as active players, either as causal or consequential agents of the dysbiosis associated with CD. The results of the LEfSe analysis using default conditions are summarized in Table 4.

These comparisons showed that viruses with a significantly higher frequency in all fecal samples from patients with CD were fewer than those more abundant in the Control group. However, these comparisons showed more viruses with a significantly higher relative abundance in these samples from new-onset patients with CD than those in the control samples. This trait was more noticeable in the case of active patients with CD but especially significant in active patients before surgery. Feces from the 3 subgroups of patients with CD showed fewer relevant viral features in comparisons within the CD group than in those between any of them with the Control group. Markers were abundant in the comparison by sample origin, notably more frequent in feces than in biopsies. Comparisons by treatment with steroids and/or immunosuppressors resulted in fewer items of interest in the stool from patients with CD. Therefore, the observed biomarkers suggest the existence of some viruses that may be associated with the appearance of the first symptoms of the inflammatory condition before any treatment and with the different stages and progression of the condition but not necessarily associated with the treatment with steroids and/or immunosuppressors.
The complete list and other details of the viral biomarkers are shown in Table, Supplemental Digital Content 7, http://links.lww.com/IBD/B28, which illustrates potential viral biomarkers showing the logarithmic linear discriminant analysis scores for discriminative features.
Comparison of the 2 Patients with CD Before and After Treatment and Surgery
The 16S rRNA gene profiles and viromes were obtained from fecal samples and biopsies of patients 23 and 25, collected before and after the treatment and surgery.
The comparison details of bacterial composition, abundance, and diversity for this subset of samples are shown in Figure 4. Bacterial composition and abundance at phylum and class levels are shown at Table, Supplemental Digital Content 8, http://links.lww.com/IBD/B29.
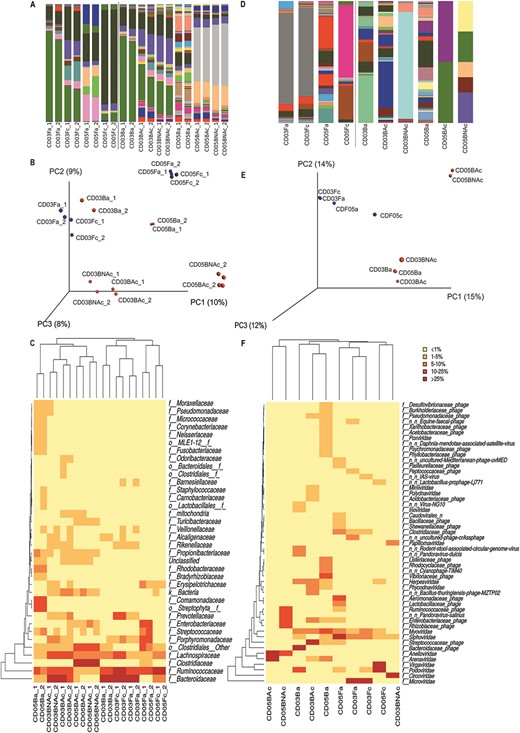
Bacterial and viral abundance and diversity between samples before and after treatment and surgery, based on the 16S rRNA gene. A, Bar plot of the bacterial abundance at the family level. B, Sample clustering and heatmap of bacterial families, based on Canberra distance matrix. C, PCoA depicting the first 3 axes. D, Bar plot of the viral abundance at the family level. E, Sample clustering and heatmap of viral families, based on Canberra distance matrix. F, PCoA depicting the first 3 axes. Color code: blue dot—fecal sample; red dot—biopsy. Sample codes: CD03, CD patient 3 (individual 23); CD05, CD patient 5 (individual 25); Fa, feces active new onset; Fc, feces previous to surgery; Ba, endoscopic biopsy active new onset; BAc, surgical biopsy from affected zone; and BNAc, surgical biopsy from not affected zone.
The relative abundance plot (A), PCoA (B), and heatmap at family level (C), reflect concordant clustering by patient: CD patient 3 (individual 23) versus CD patient 5 (individual 25), and within them by sample origin (feces versus biopsy) and by patient status (onset versus surgery). Surgical biopsies from affected regions showed closer profiles to the nonaffected ones than with those from their corresponding endoscopic biopsies. Therefore, despite morphological differences between affected and nonaffected regions, bacterial profiles from affected regions are more similar to those from the nonaffected ones in the same individual (collected at the time of surgery) than to the ones from affected regions (endoscopic biopsies) collected at the onset of the symptoms.
Unlike bacteria, viral composition and abundance patterns were inconsistent not reflecting the clustering by patient, sample origin, or patient status (Fig. 4D–F). However, because of the low number of viral hits in biopsies, their results cannot be considered representative. Fecal samples were generally more homogeneous before and after treatment than biopsies in CD patient 3. CD patient 5 showed more variation. In biopsies, bigger differences were observed not only between the endoscopic and surgical ones within the same patient but also between the affected and unaffected regions.
Correlation Networks Between Bacteria and Viruses
Figure 5 displays a network that summarizes significant correlations between the relative abundance among bacterial phylotypes and between bacterial and viral reads generated in feces from the new-onset CD patients. Correlations between viruses and bacteria were mostly strongly negative (r < −0.833) or moderately negative (−0.833 < r < −0.667), with the highest abundance of viral nodes linked to Paraprevotella (9), Bacteroides uniformis (7), and B. barnesiae, B. ovatus and Dialister (6 each).
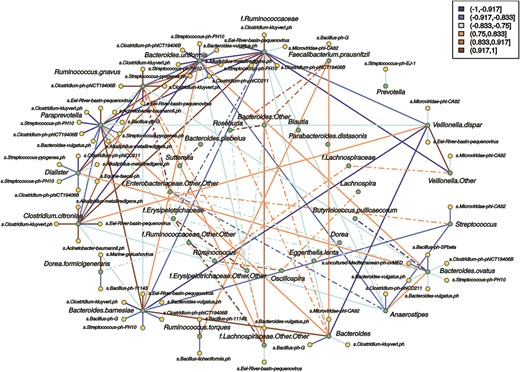
Correlation network between relative abundance of bacterial phylotypes based on the 16S rRNA gene and bacteriophage-matching reads. Network from fecal samples from the new-onset CD group (n = 8). Green dots represent bacterial phylotypes and yellow dots bacteriophage species. Only OTUs present in at least 5 of the samples in each set were considered for the correlation analysis, and Spearman's correlation coefficients ≤ −0.5 or ≥ 0.5 displayed. The outer ring displays bacteria that form clusters with correlation coefficients over the threshold with at least 1 bacteriophage. The inner ring shows bacteria with correlations coefficients above the threshold but whose correlations with bacteriophages are below that threshold. Solid lines represent correlations involving bacteria from the outer ring and viruses and bacteria, while dashed lines represent correlations between bacteria from the inner or outer–inner rings. Orange-brown color indicates positive correlation, and blue color indicates negative correlation.
Paraprevotella showed negative correlations with phages positively correlated with the Ruminococcaceae, such as Clostridium kluyveri phage, Clostridium phage phiCT19406B, and Streptococcus phage-PH10. However, Eel River basin pequenovirus correlated positively with Paraprevotella and negatively with Ruminococcaceae. Both bacteria showed strong negative correlation coefficients. Therefore, a virus positively correlated with one species appears negatively correlated with the other and vice versa. In a similar way, Alkaliphilus metalliredigens phage and C. kluyveri phage show a strong positive correlation with Clostridium citroniae and a negative one with Paraprevotella and B. uniformis. The last 2 had positive correlations with each other but negative with C. citroniae. Correlations between a virus and different bacteria are of the same sign when these bacteria are correlated positively between them. Examples of this type of relationship were observed in Paraprevotella, B. uniformis, and B. barnesiae or in C. citroniae and Ruminococcus gnavus and some of their associated viruses that were shared between them.
These and other cross-correlations showed that for shared correlated viruses, a negative correlation between 2 bacteria may imply a negative correlation of the phage with 1 bacterium but a positive one with the other member of the pair. Similarly, a positive correlation in shared correlated viruses between 2 bacteria may imply a direct correlation between a phage and both bacteria. However, that does not imply causality.
Correlation networks from feces in the Control group, from all fecal samples, and from biopsies are displayed in Figure, Supplemental Digital Content 9, http://links.lww.com/IBD/B30, which illustrates the correlations between relative abundance of bacterial phylotypes based on the 16S rRNA gene and bacteriophage-matching reads. Correlations appeared stronger in groups with more homogeneous conditions, such as feces from the Control group or the new-onset CD patients, than in groups subjected to more variables, such as the combination of all patients with CD, the feces from all individuals, or the combined endoscopic and surgical biopsies.
Discussion
Bacterial and viral composition, their abundance, and diversity were analyzed through a metagenomic approach in a group of patients with CD at different stages of therapy and compared with an external control group. Subgroups of patients were also compared according to the sample origin and disease or patient status to assess the effect of such variables on their microbiota. Nevertheless, to elucidate what occurs during the onset of CD, the most informative comparison is that between the Control group and the new-onset CD patients because the latter represents the initial stages of the disease (most remarkably gut inflammation) without the interference of drug treatment. Moreover, the comparison between new-onset and actively treated patients with CD may offer a glimpse of the effects of the drugs after the onset of the disease.
Samples from individuals studied before and after treatment and surgery are particularly valuable to follow up the evolution of the disease. Our results from these patients indicate that bacterial communities may reflect the disease status of the patients more accurately than their viral counterparts, which show higher individual sample variability even within the same patient, origin, and collection time.
The distribution of the bacterial phylotypes across groups of fecal samples shows the most significant differences between the Control group and the patients with CD, particularly the new-onset ones. This may be an indicator of a dysregulated environment associated with inflammation. After therapy begins, our data support that bacteria experience a loss of taxa in feces and biopsies.
Regarding which bacteria are imbalanced in patients with CD in this study, our results corroborate many observations previously reported in the literature41,42 (e.g., the decreased abundance of Firmicutes and Bacteroidetes in patients with CD; the increase of Enterobacteriaceae, Pasteurellaceae, and Veillonellaceae; and the presence of Fusobacterium. Also, the decrease in several Clostridia, including Ruminococcaceae [e.g., Faecalibacterium, Oscillospira] and that of Feacalibacterium prausnitzii). However, F. prausnitzii, whose reduction has been linked to IBD,43 could be affected by treatment rather than by the disease itself since it does not appear significantly less abundant in feces from new-onset CD patients, but it does after treatment has been initiated.
The higher abundance of Escherichia coli in patients with CD is particularly interesting, particularly pathogenic adherent-invasive E. coli, previously associated with ileal mucosa in CD.44 An increase in Enterobacteriaceae may indicate the preference of this clade for an inflammatory environment.
The main differences observed in the potential bacterial biomarkers between the Control group and the CD group, as well as with each category of this group, together with the low number of biomarkers identified between the different categories of CD patients, suggest that the condition per se may be in part associated with changes in the bacterial community, regardless of its stage, although the treatment must have an major impact in the microbiota in actively treated patients.
As for the virome, the grouping of samples according to the disease and patient status, or sample origin, shows lower statistical values compared with those of bacteria. Only the comparisons by sample origin and, depending on the type of calculated distance, by treatment in stool and between feces from the Control and CD groups showed significant differences. In viruses, unlike in bacteria, the observed global variation between feces from healthy individuals and those from new-onset CD patients was not significant.
Despite that, more specific viral biomarkers can be detected in feces from patients with CD, showing that uneven distribution of certain viruses is observed regardless of therapy, and thus it may be linked to the inflammatory process. The use of steroids and/or immunosuppressors in patients with CD provides another potential source of variation. We observed an overall reduction in the viral diversity associated with them, especially with immunosuppressors. However, correspondence does not reflect the administration of steroids and/or immunosuppressors with the disease status specifically, and the therapy varies on each patient. Thus, the effects cannot be dissociated from the patient status or other factors potentially involved in causing variation. However, the high differences in viral composition between feces and biopsies can be related to bacteriophage dominance in feces, whereas different viruses are dominant in biopsies. This is not unexpected because bacteria, the primary hosts of bacteriophages, constitute ∼60% of the dry mass in the fecal matter,45 whereas human viruses are more likely to be found in tissue as they target eukaryotic cells. However, plant viruses seem mostly to be associated with the feces but not with the biopsies, suggesting that they transit through fecal matter without targeting mucosal cells.
Plant viruses are the dominant RNA viruses, which is in accordance with previous findings24 although this is just limited to fecal samples. Although the presence of plant viruses in the human gut was explained as a result of diet, with humans as vectors for their dissemination, they were ubiquitously found in wastewater.46 Moreover, certain tobamoviruses have been linked with specific immune response and clinical symptoms in humans,47 suggesting the possibility of a direct or indirect pathogenic role in humans, and antibodies have been detected for some of them, such as the Tobacco mosaic virus,48 showing a molecular mimicry between this virus and the human mitochondrial protein TOMM40L. Furthermore, similarity between human micro-RNAs and plant viruses has been reported49 although the functional implications of these results remain unclear.
Diet plays an essential role in the dynamics of the bacterial and viral communities in the gut because the presence of some bacteria and viruses can only be explained by their intake (e.g., chloroplasts and plant viruses). However, because it is not possible to differentiate the direct contribution of diet on resident microbiota, it can hinder the study of the interaction of other variables.
Some studies have reported that antivirals and immunosuppressors strongly affect the structure of the virome, increasing the total viral load in plasma of organ transplant recipients.50 Although it is unfeasible to determine the viral load for every viral species present in the samples, we estimated the relative abundance indirectly, through the number of reads and used them to search for viral biomarkers. We observed a higher number of viruses more abundantly represented in feces from any subgroup of patients with CD compared with control individuals than in the comparisons between patients with CD. Some authors have suggested that certain viruses (e.g., anelloviruses) take advantage of the suppression of the host immune system.51,–53 We found statistically different representation of several species from this family (Torque teno virus) in feces from patients with CD, with particularly more of them in those before surgery, supporting this hypothesis. Thus, we can conclude that viral increments linked to the first appearance of symptoms of CD before the beginning of the therapy may be more relevant to the viral community than the effects of the drugs currently used to treat CD. The change observed in new-onset CD patients might be associated with the inflammatory response and linked to dysbiosis affecting the bacterial population. Under stress situations such as the inflammatory response, the lytic phase of lysogenic bacteriophages is favored, resulting in higher proportions of viral particles than in homeostasis, when lysogeny is more common.21 Our study has identified an inventory of potential viruses that differ significantly between healthy individuals and newly diagnosed patients with CD, as well as in active treated patients, delimiting the future search for biomarkers and providing a starting point for further clinical research focused on those specific viruses to determine if their increase in relative abundance is biologically or clinically relevant.
Finally, because viruses modulate the bacterial populations, the study of the interactions between both communities through correlation networks may result in great interest to understand the complex relationships between viruses, bacteria, and CD.
Acknowledgments
The authors want to thank students Pau Esparza, Vladimir Díaz, Sara Ferrando, Raquel Aparicio, and Marta Simone for their assistance at different stages of the experimental work.
References
Author notes
Reprints: Vicente Pérez-Brocal, PhD, Genomics and Health Area, Fundación para el Fomento de la Investigación Sanitaria y Biomédica de la Comunidad Valenciana (FISABIO)-Salud Pública. Avda de Catalunya 21, 46020, Valencia, Spain (e-mail: [email protected]).
Supplemental digital content is available for this article. Direct URL citations appear in the printed text and are provided in the HTML and PDF versions of this article on the journal's Web site (www.ibdjournal.org).
Supported by grant SAF-2012-31187 from the Ministry of Economy and Competitiveness (MINECO), Spain to A. Moya. I. Moret had public support by funding from the “Fondo de Investigaciones Sanitarias, Instituto de Salud Carlos III: CA10/01027, PS09/01827” and IIS Hospital La Fe, ref: 2014/0150. V. Pérez-Brocal was recipient of a research contract Sara Borrell CD09/00101 from the Instituto de Salud Carlos III (ISCIII), Spain. Rodrigo García-López was recipient of the FPI fellowship from MICINN Spain. The remaining authors have no conflict of interest to disclose.

