


Abstract
To what extent is socioeconomic status (SES), as measured by educational attainment and household income, associated with fecundability in a cohort of Danish couples trying to conceive?
In this preconception cohort, lower educational attainment and lower household income were associated with lower fecundability after adjusting for potential confounders.
Approximately 15% of couples are affected by infertility. Socioeconomic disparities in health are well established. However, little is known about socioeconomic disparity and its relation to fertility.
This is a cohort study of Danish females aged 18–49 years who were trying to conceive between 2007 and 2021. Information was collected via baseline and bi-monthly follow-up questionnaires for 12 months or until reported pregnancy.
Overall, 10 475 participants contributed 38 629 menstrual cycles and 6554 pregnancies during a maximum of 12 cycles of follow-up. We used proportional probabilities regression models to estimate fecundability ratios (FRs) and 95% CIs.
Compared with upper tertiary education (highest level), fecundability was substantially lower for primary and secondary school (FR: 0.73, 95% CI: 0.62–0.85), upper secondary school (FR: 0.89, 95% CI: 0.79–1.00), vocational education (FR: 0.81, 95% CI: 0.75–0.89), and lower tertiary education (FR: 0.87, 95% CI: 0.80–0.95), but not for middle tertiary education (FR: 0.98, 95% CI: 0.93–1.03). Compared with a monthly household income of >65 000 DKK, fecundability was lower for household income <25 000 DKK (FR: 0.78, 95% CI: 0.72–0.85), 25 000–39 000 DKK (FR: 0.88, 95% CI: 0.82–0.94), and 40 000–65 000 DKK (FR: 0.94, 95% CI: 0.88–0.99). The results did not change appreciably after adjustment for potential confounders.
We used educational attainment and household income as indicators of SES. However, SES is a complex concept, and these indicators may not reflect all aspects of SES. The study recruited couples planning to conceive, including the full spectrum of fertility from less fertile to highly fertile individuals. Our results may generalize to most couples who are trying to conceive.
Our results are consistent with the literature indicating well-documented inequities in health across socioeconomic groups. The associations for income were surprisingly strong considering the Danish welfare state. These results indicate that the redistributive welfare system in Denmark does not suffice to eradicate inequities in reproductive health.
The study was supported by the Department of Clinical Epidemiology, Aarhus University and Aarhus University Hospital, and the National Institute of Child Health and Human Development (RO1-HD086742, R21-HD050264, and R01-HD060680). The authors declare no conflict of interest.
N/A.
Introduction
Worldwide, ∼15% of couples of child-bearing ages are affected by infertility (WHO, 2022), defined as the inability to conceive after 12 months of attempting pregnancy (Schrager et al., 2020). Measures of socioeconomic status (SES), an indication of a person’s economic and social position, form a broad index of social and environmental conditions that affect most health outcomes and may affect infertility. SES can be based on income, educational attainment, or occupation (Children, Youth, Families and Socioeconomic Status, 2010; Worthy et al., 2020), all of which are correlates of the SES construct. SES is a well-documented risk factor for conditions such as cardiovascular disease, stroke, cancer, all-cause mortality, and, in particular, mental disorders (Kaplan and Keil, 1993; Children, Youth, Families and Socioeconomic Status, 2010; Marshall et al., 2015; Rosengren et al., 2019; Mihor et al., 2020).
Surprisingly, little is known about socioeconomic disparities in fertility (Axmon et al., 2006; Wellons et al., 2008; Burdorf et al., 2011; Thoma et al., 2013; Mutsaerts et al., 2012; Schrager et al., 2020; Snow et al., 2022). Six studies have shown a positive association between level of education and fertility (Wellons et al., 2008; Burdorf et al., 2011; Mutsaerts et al., 2012; Thoma et al., 2013; Schrager et al., 2020; Snow et al., 2022), while one study has shown an inverse association (Axmon et al., 2006). Most of the existing studies have used either a cross-sectional design (Axmon et al., 2006; Wellons et al., 2008; Thoma et al., 2013; Snow et al., 2022) or a retrospective cohort and included women who were already pregnant (Burdorf et al., 2011; Mutsaerts et al., 2012) or were pregnant in the past (Axmon et al., 2006), which can lead to selection and recall bias. The only preconception cohort study included 8654 couples and found that lower educational attainment was associated with reduced fecundability, defined as the per-cycle probability of conception (13–15 versus ≥17 years of educational attainment: fecundability ratio (FR) = 0.84, 95% CI: 0.78–0.91) (Schrager et al., 2020). Only one preconception cohort study has investigated the association between income and fertility and found that lower income levels were associated with decreased fertility (<$50 000 versus >$150 000 annual household income: FR = 0.91, 95% CI: 0.83–1.01) (Schrager et al., 2020).
In this study, we examined the association between SES, as measured by educational attainment and household income, and fecundability in a cohort of Danish couples trying to conceive.
Materials and methods
Study population and procedures
‘SnartGravid.dk’ (Soon Pregnant, SG) and the ongoing ‘SnartForældre.dk’ (Soon Parents, SF) are prospective cohorts of Danish couples trying to conceive. The SG cohort enrolled female participants from 2007 until 2011. Thereafter, the study began to enroll male partners and was renamed SnartForældre (Wesselink et al., 2022). From initiation through 2017, recruitment was largely conducted through advertisements on social media and health-related websites. Since the beginning of 2018, recruitment has taken place primarily via an official digital post system called e-Boks used by all Danish citizens (Huybrechts et al., 2010; Christensen et al., 2017; Wesselink et al., 2022).
Eligible female participants were aged 18–49 years, residents of Denmark, in a relationship with a male partner, and attempting to conceive without using fertility treatment.
At study entry, participants provided detailed information on socio-demographic characteristics, reproductive and medical history, and lifestyle via an online questionnaire. Participants then completed bi-monthly follow-up questionnaires for 12 months or until they reported a current pregnancy. The follow-up questionnaire assessed changes in menstrual cycle length and regularity, medication use, alcohol and caffeine consumption, smoking, perceived stress and depressive symptoms, gravidity, miscarriage, and frequency and timing of intercourse (Mikkelsen et al., 2009; Huybrechts et al., 2010).
Exclusions
Between June 2007 and November 2021, 10 475 participants from the SG and SF cohorts completed the baseline questionnaire. We excluded participants from the analytic data set if their date of last menstrual period (LMP) was >6 months before baseline questionnaire completion or if the LMP date was implausible or missing. Participants who were pregnant at study entry or who had tried to conceive for more than six cycles were also excluded (Fig. 1).
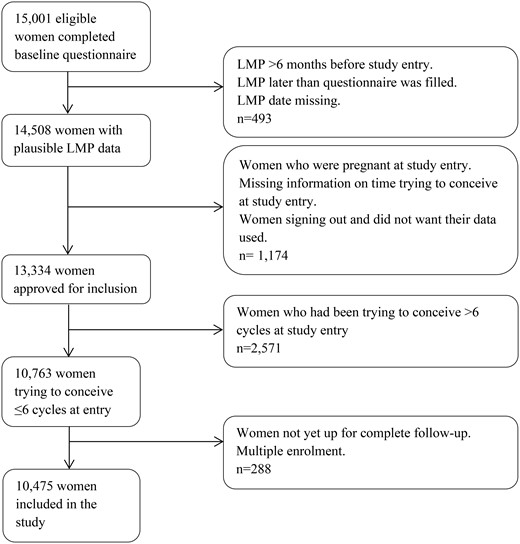
Flowchart of the study population: the ‘SnartGravid.dk’ (Soon Pregnant, SG) and the ongoing ‘SnartForældre.dk’ (Soon Parents, SF) cohorts. LMP: last menstrual period.
Assessment of SES
We used educational attainment and household income as indicators of SES. On the baseline questionnaire, participants were asked to provide their highest level of completed basic schooling: (i) elementary schooling to 9th grade (10 years of basic schooling); (ii) 10th grade (11 years of basic schooling); (iii) higher technical examination, higher commercial examination, high school examination, and higher preparatory examination (13–14 years of basic schooling); and (iv) other schooling (e.g. foreign schooling). In addition, they reported their highest level of completed education after basic schooling: (i) no education after basic schooling; (ii) semi-skilled/basic training; (iii) tertiary education <3 years; (iv) tertiary education 3–4 years; (v) tertiary education >4 years; and (vi) other education. Responses to the questions on education and vocational training were combined and collapsed into six mutually exclusive categories: primary and secondary school, upper secondary school, vocational education, lower tertiary education, middle tertiary education, and higher tertiary education (Table I). Participants were categorized according to their highest or ongoing level of education and vocational training.
Grouping of educational attainment according to wording of questionnaire items.
| Questionnaire item | Grouping |
|---|---|
| Folkeskole 9th or 10th grade | Primary and secondary school |
| Other schooling | |
| Higher technical exam, higher commercial exam, high school or higher preparatory exam | Upper secondary school |
| No education after basic schooling | |
| Semi-skilled/basic training1 | Vocational education |
| Tertiary education <3 years | Lower tertiary education |
| Tertiary education 3–4 years | Middle tertiary education |
| Tertiary education >4 years | Higher tertiary education |
Semi-skilled worker (specialarbejderuddannelse), basic vocational training (basisår i efg-uddannelse), basic commercial course (handelsskolernes grunduddannelse (HG)), apprenticeship training (lærlingeuddannelse), trainee program (elevuddannelse), or other vocational training (faglig uddannelse).
On the baseline questionnaire, participants also reported their total monthly household income in five categories of DKK before tax. These were recategorized into four groups for the analysis: DKK <25 000; DKK 25 000–39 999; DKK 40 000–65 000; and DKK >65 000 irrespective of the number of persons in the household.
Assessment of fecundability
Fecundability was defined as the average per-cycle probability of conception (Zegers-Hochschild et al., 2017). On the baseline questionnaire, participants reported the number of menstrual cycles during which they had been trying to conceive at study entry, date of LMP, menstrual cycle length (number of days), and cycle regularity. During follow-up, the data were updated on pregnancy status, intervening pregnancy losses, date of LMP, and cycle regularity. Participants with irregular cycles had their cycle length estimated using LMP dates over follow-up and information on the number of menstrual cycles per year.
Assessment of covariates
On the baseline questionnaire, female participants reported their age, partner’s age, household income, educational attainment, and parental educational attainment. Furthermore, they reported weight and smoking at Age 17 and at study entry, height, perceived stress using a 10-item measure of the degree to which one’s life situations are perceived as stressful (Perceived Stress Scale: PSS) (Cohen et al., 1983), and depressive symptoms using the Major Depression Inventory (MDI), a 10-item mood questionnaire (Bech et al., 2015). They also provided information on job situation, hours worked per week, number of individuals in the household, cohabitation status, alcohol consumption, physical activity, smoking, intercourse frequency and timing of intercourse, parity, gravidity, and last type of contraception used.
Information on parental educational attainment was obtained using the same response categories as for the female participants. Maternal educational attainment was collapsed into the same six categories as for the female participants (Table I). Paternal educational attainment was divided into five categories (primary and secondary school and upper secondary school were collapsed), because there were fewer than five observations in some categories. Partner’s educational attainment was reported by female participants in the SG cohort, but not in the SF cohort as male partners were invited to complete a separate questionnaire. Information on the partner’s educational attainment was only available on schooling level, categorized as: primary and secondary school and upper secondary school.
Statistical analyses
We assessed the association between SES and fecundability separately for educational attainment and household income, using proportional probabilities regression models to estimate FRs and 95% CIs. Participants contributed menstrual cycles to the analysis from study entry until they reported a pregnancy or a censoring event (cessation of pregnancy attempt, initiation of fertility treatment, study withdrawal, loss to follow-up, or 12 cycles of follow-up), whichever came first. We used life-table methods to calculate the percentages of couples that conceived during the 12 cycles of follow-up accounting for censoring (Cox, 1972). The FR estimates the per-cycle probability of conception among exposed compared with unexposed participants; an FR <1 corresponds to reduced fecundability among the exposed relative to the unexposed (Weinberg et al., 1989).
The dataset was transformed to long format, with one observation per observed menstrual cycle at risk (Howards et al., 2007; Schisterman et al., 2013). This allowed for delayed entry to account for variation in pregnancy attempt time at study entry and reduced bias from left truncation.
Selection of covariates for adjustment was guided by the existing literature and directed acyclic graphs (Supplementary Fig. S1). When we used educational attainment as an indicator of SES, we adjusted the model for age (in four categories; <25, 25–29, 30–34, and ≥35 years), parental educational attainment, BMI at Age 17 (in four categories; <18.5, 18.5–24, 25–29, and ≥30 kg/m2), and smoking status at Age 17 (yes versus no). When we used household income as an indicator of SES, we adjusted for the model for age (in four categories; <25, 25–29, 30–34, and ≥35 years), partner’s age (in four categories; <25, 25–29, 30–34, and ≥35 years), educational attainment (primary and secondary school, upper secondary school, vocational education, lower tertiary education, middle tertiary education, and upper tertiary education), partner’s school level (primary and secondary school and upper secondary school), PSS (in three categories; low stress: score of 0–13, moderate stress: score of 14–26, and high stress: score of 27–40), and MDI (in three categories; no or doubtful depression: score of <20, mild-to-moderate depression: score of 20–29, severe depression score of >30).
We performed a series of sensitivity analyses. Because female age is a powerful predictor of fecundability (Baird et al., 2005; Rothman et al., 2013; Vander Borght and Wyns, 2018), we performed a sensitivity analysis stratified by age (<30 and 30 years) for both educational attainment and household income. To account for a potential correlation between the two SES indicators, we stratified the analysis of educational attainment by monthly household income and job situation, and we stratified the analysis of household income by educational attainment. Due to the two phases of enrollment (SG: 2007–2011 and SF: 2011–2022), we conducted an analysis that stratified the data by study cohort to account for potential differences in SES based on enrollment.
We also performed an analysis in which educational attainment and household income were combined into one composite exposure of SES to explore the impact of different combinations of educational attainment and household income on fecundability. We created three SES levels each for educational attainment and household income (low, middle, and high). Low educational attainment comprised primary and secondary school and upper secondary school, middle educational attainment comprised vocational education and lower tertiary education, and high educational attainment comprised middle tertiary education and upper tertiary education. Low household income comprised <40 000 DKK per month, middle household income comprised 40 000–65 000 DKK per month, and high household income comprised >65 000 DKK per month. We then created nine SES categories that combined the three levels of educational attainment and the three levels of household income. This analysis was adjusted for female respondents’ age, parental educational attainment, BMI at Age 17, smoking at Age 17, partner’s age, partner’s school level, PSS score, and MDI score.
We used multiple imputation to handle missing data on exposure, outcome, and covariates (van Buuren, 2007; Sterne et al., 2009). Using the fully conditional specification method, we generated ten imputed datasets (van Buuren, 2007). Coefficients and standard errors from the ten datasets were statistically combined into one parameter estimate and confidence interval using Rubin’s rule (Sterne et al., 2009). Participants who completed only the baseline questionnaire were assigned one cycle of follow-up and their pregnancy status was imputed after that cycle. For the combined SG and SF study populations, <2% of information was missing for basic schooling, partner’s age and BMI at Age 17. Information on household income and vocational training was missing for 3–9% of participants, while 14% of participants had missing information on smoking at Age 17. Information on job situation and one or more items in the PSS and MDI scales were missing for 42–44% (only assessed for the SF study population). Information on partner’s school level was missing for 58% of participants and parental educational attainment information was missing for 72–74% of participants (only assessed in the SG study population). When using multiple imputation, an underlying assumption is that data are missing at random. We expected this assumption to be fulfilled, since most missing data stemmed from differences between the questionnaires used for the SF and SG study populations.
All analyses were performed using SAS software (SAS 9.4).
Ethical approval
This study complies with Danish and European regulations about data protection and is registered with the Danish Data Protection Agency (Aarhus University Record Number: 2016-051-000001, # 431). The participants provided online informed consent at enrollment. Because the study did not include human tissue, separate ethical approval was not required.
Results
In total, 10 475 participants contributed 38 629 cycles and 6554 pregnancies during follow-up. Using life-table methods, we estimated that 87% of couples conceived within 12 cycles of follow-up after accounting for censoring. During follow-up, 2% stopped trying to conceive, 5% initiated fertility treatment, 9% were censored after 12 cycles, and 10% were lost to follow-up. The percentage lost to follow-up was higher among participants with lower educational attainment (primary and secondary school: 14% versus upper tertiary education: 9%) and lower income (<25 000 DKK: 12% versus >65 000 DKK: 9%).
Table II presents baseline characteristics of study participants by categories of educational attainment and household income. Approximately 33% of participants had an upper tertiary education (higher education of >4 years) and 3% had attended only primary and secondary school (10 or 11 years of basic schooling). About 13% had a monthly household income <25 000 DKK and 23% had a monthly household income >65 000 DKK. Compared with those with the lowest level of educational attainment, age, partner’s age, prevalence of cohabiting, timing of intercourse and no alcohol use were greater among participants with the highest levels of education. The same pattern was observed for household income. Compared with those with the lowest level of educational attainment, PSS score, MDI score, physical activity, and prevalence of smoking at Age 17 years were lower among participants with the highest level of educational attainment. The same pattern was observed for household income. Compared with participants with the lowest level of household income, household size and hours worked per week were greater for those with the highest levels of household income.
Baseline characteristics of couples trying to conceive, by educational attainment and household income.
| Education | Income | |||||||||
|---|---|---|---|---|---|---|---|---|---|---|
| Primary and secondary school | Upper secondary school | Vocational education | Lower tertiary education | Middle tertiary education | Upper tertiary education | <25 000 | 25 000–39 999 | 40 000–65 000 | >65 000 | |
| N (%) | 327 (3.1) | 474 (4.5) | 1155 (11.0) | 1102 (10.5) | 3924 (37.5) | 3493 (33.3) | 1408 (13.4) | 2268 (21.7) | 4373 (41.7) | 2426 (23.2) |
| Age, years, median (IQI) | 24 (21; 28) | 25 (22; 27) | 28 (25; 31) | 28 (26; 31) | 28 (26; 31) | 30 (28; 32) | 25 (23; 28) | 27 (25; 30) | 29 (27; 31) | 31 (29; 33) |
| Partner age, years, median (IQI) | 28 (24; 32) | 27 (25; 31) | 30 (27; 34) | 30 (27; 34) | 30 (28; 34) | 31 (29; 34) | 27 (25; 30) | 29 (27; 32) | 31 (28; 34) | 33 (30; 36) |
| Monthly household income (DKK), % | ||||||||||
| <25 000 | 41.9 | 37.4 | 16.1 | 13.1 | 10.7 | 9.5 | ||||
| 25 000–39 999 | 37.4 | 40.8 | 29.1 | 23.9 | 22.3 | 13.8 | ||||
| 40 000–65 000 | 17.8 | 17.7 | 45.2 | 48.4 | 49.6 | 35.0 | ||||
| >65 000 | 2.9 | 4.1 | 9.6 | 14.6 | 17.2 | 41.8 | ||||
| Education level, % | ||||||||||
| Primary and secondary school | 9.8 | 5.4 | 1.3 | 0.4 | ||||||
| Upper secondary school | 12.7 | 8.5 | 1.9 | 0.8 | ||||||
| Vocational education | 13.2 | 14.7 | 11.9 | 4.5 | ||||||
| Lower tertiary education | 10.4 | 11.7 | 12.3 | 6.7 | ||||||
| Middle tertiary education | 30.2 | 38.7 | 44.6 | 27.8 | ||||||
| Upper tertiary education | 23.7 | 21.1 | 28.0 | 59.8 | ||||||
| Mother’s education level, upper tertiary education, % | 3.4 | 5.2 | 3.9 | 6.0 | 7.0 | 11.0 | 8.5 | 7.5 | 7.1 | 8.5 |
| Father’s education level, upper tertiary education, % | 10.4 | 11.6 | 9.7 | 13.7 | 17.5 | 23.9 | 17.5 | 16.3 | 17.3 | 20.5 |
| Partner’s upper secondary school, % | 22.9 | 57.0 | 46.0 | 48.9 | 62.0 | 68.3 | 56.3 | 53.3 | 60.1 | 66.1 |
| Job situation, currently employed, % | 71.5 | 80.9 | 87.3 | 86.1 | 83.7 | 78.9 | 49.5 | 71.8 | 90.1 | 96.6 |
| N individuals in household, median (IQI) | 2 (2; 3) | 2 (2; 2) | 2 (2; 3) | 2 (2; 3) | 2 (2; 3) | 2 (2; 2) | 2 (2; 2) | 2 (2; 3) | 2 (2; 3) | 2 (2; 3) |
| Living with partner, % | 86.4 | 96.1 | 95.3 | 95.5 | 97.3 | 97.7 | 88.3 | 95.9 | 98.4 | 99.0 |
| BMI (kg/m2), median (IQI) | 25 (21; 30) | 23 (21; 27) | 24 (22; 28) | 24 (22; 28) | 23 (21; 26) | 22 (21; 24) | 23 (21; 27) | 23 (21; 27) | 23 (21; 26) | 22 (21; 25) |
| BMI at 17 years of age (kg/m2), mean | 21 (19; 24) | 21 (19; 24) | 21 (19; 24) | 21 (19; 23) | 21 (19; 23) | 20 (19; 22) | 21 (19; 23) | 21 (19; 23) | 21 (19; 23) | 20 (19; 22) |
| Physical activity (METs-hours/week), median (IQI) | 70.2 (32.6; 142.4) | 61.1 (32.2; 115.5) | 55.1 (27.1; 112.4) | 45.1 (21.9; 88.2) | 50.2 (25.6; 110.3) | 37.7 (21.9; 64.6) | 51.9 (28.7; 101.2) | 52.2 (26.4; 102.0) | 46.2 (24.3; 90.0) | 37.6 (20.6; 68.5) |
| Current smoker, % | 47.7 | 22.2 | 24.0 | 21.9 | 13.9 | 7.8 | 23.8 | 20.0 | 13.6 | 8.9 |
| Smoked at 17 years of age, % | 52.5 | 28.5 | 27.8 | 25.4 | 15.5 | 7.3 | 23.1 | 22.3 | 16.3 | 9.5 |
| Alcohol intake, no drinks/week, % | 53.2 | 41.9 | 33.5 | 35.2 | 31.4 | 22.7 | 40.6 | 35.4 | 29.7 | 20.6 |
| Pregnancy attempt time at study entry (>3 cycles), % | 27.1 | 19.3 | 23.8 | 23.3 | 22.6 | 20.3 | 20.2 | 20.6 | 23.2 | 22.2 |
| Parous, % | 42.8 | 22.3 | 36.1 | 41.4 | 37.0 | 32.4 | 23.1 | 31.1 | 37.4 | 42.8 |
| Gravid, % | 61.2 | 42.2 | 53.9 | 55.2 | 51.4 | 45.6 | 40.3 | 46.7 | 51.6 | 56.0 |
| Regular cycles, % | 67.6 | 73.3 | 76.9 | 71.8 | 75.1 | 76.0 | 71.7 | 72.9 | 75.4 | 77.8 |
| Last contraceptive method (hormonal), % | 68.7 | 63.6 | 68.0 | 64.5 | 58.6 | 54.7 | 61.3 | 62.7 | 60.1 | 54.4 |
| Timing of intercourse, % | 52.1 | 51.6 | 55.5 | 57.3 | 64.4 | 67.2 | 56.6 | 60.5 | 62.0 | 69.3 |
| Intercourse frequency >4 times/week | 72.5 | 70.0 | 61.6 | 61.7 | 60.8 | 61.2 | 69.6 | 65.1 | 60.1 | 57.5 |
| Perceived Stress Scale, median (IQI) | 15 (11; 21) | 14 (11; 19) | 14 (10; 18) | 14 (10; 18) | 13 (9; 17) | 12 (8; 16) | 14 (10; 19) | 14 (10; 18) | 13 (9; 17) | 12 (8; 16) |
| Major Depression Inventory score, median (IQI) | 10 (6; 18) | 8 (5; 13) | 8 (5; 12) | 7 (5; 11) | 7 (4; 10) | 6 (4; 9) | 8 (5; 13) | 7 (4; 12) | 7 (4; 10) | 6 (4; 9) |
| Hours worked/week, median (IQI) | 30 (0; 37) | 30 (12; 37) | 37 (30; 37) | 37 (30; 37) | 37 (30; 37) | 37 (30; 40) | 7 (0; 35) | 32 (0; 37) | 37 (33; 37) | 37 (37; 40) |
IQI: interquartile interval (Q1; Q3); MET: metabolic equivalent task.
Compared to participants with an upper tertiary education, fecundability was lower among participants who had completed only primary and secondary school (FR = 0.73, 95% CI: 0.62–0.85), upper secondary school (FR = 0.89, 95% CI: 0.79–1.00), vocational education (FR = 0.81, 95% CI: 0.75–0.89), and lower tertiary education (FR = 0.87, 95% CI: 0.80–0.95) but were similar for participants with middle tertiary education (FR = 0.98, 95% CI: 0.93–1.03) (Table III). The results did not change appreciably after adjusting for potential confounders. When the analysis was stratified by age, monthly household income, or job situation, the estimates were not markedly different across strata (Supplementary Table SI). In addition, when stratified by cohort, the results did not differ meaningfully by cohort and were similar to those in the overall analysis (data not shown).
Educational attainment and fecundability (n = 10 475).
| No. cycles | No. pregnancies | Unadjusted FR (95% CI) | Adjusted FR (95% CI)a | |
|---|---|---|---|---|
| Primary and secondary school | 1204 | 156 | 0.73 (0.62–0.85) | 0.80 (0.68–0.95) |
| Upper secondary school | 1827 | 295 | 0.89 (0.79–1.00) | 0.96 (0.85–1.08) |
| Vocational education | 4611 | 651 | 0.81 (0.75–0.89) | 0.85 (0.78–0.94) |
| Lower tertiary education | 4053 | 639 | 0.87 (0.80–0.95) | 0.90 (0.83–0.99) |
| Middle tertiary education | 14 216 | 2497 | 0.98 (0.93–1.03) | 1.00 (0.94–1.05) |
| Upper tertiary education | 12 718 | 2316 | Reference | Reference |
FR: fecundability ratio.
Adjusted for age, mother’s educational attainment, father’s educational attainment, BMI at Age 17, and smoking at Age 17.
Compared to participants with a monthly household income of >65 000 DKK, fecundability was lower among participants with a household income <25 000 DKK (FR = 0.78, 95% CI: 0.72–0.85), 25 000–39 000 DKK (FR = 0.88, 95% CI: 0.82–0.94), and 40 000–65 000 DKK (FR = 0.94, 95% CI: 0.88–0.99) (Table IV). The results did not change appreciably after adjusting for potential confounders. When the analysis was stratified by age, the association between income and fecundability was stronger for participants aged ≥30 years; compared with a monthly household income of >65 000 DKK, the FRs were 0.66, 95% CI: 0.53–0.82 (<25 000 DKK) and 0.82, 95% CI: 0.73–0.93 (25 000–39 000 DKK) (Supplementary Table SII). When the analysis was stratified by educational attainment, the estimates were similar to those in the overall analysis, except for a partial reversal in the estimates for vocational training. Compared with a monthly household income of >65 000 DKK, FRs were higher for participants with vocational education and a household income of 25 000–39 000 DKK (FR: 1.10, 95% CI: 0.82–1.74), and of 40 000–65 000 DKK (FR: 1.18, 95% CI: 0.89–1.53) (Supplementary Table SII). Furthermore, the results did not vary noticeably by cohort or from the overall results when stratified by cohort (data not shown).
Monthly household income (DKK) and fecundability (n = 10 475).
| No. cycles | No. pregnancies | Unadjusted FR (95% CI) | Adjusted FR (95% CI)a | |
|---|---|---|---|---|
| <25 000 | 5451 | 781 | 0.78 (0.72–0.85) | 0.82 (0.75–0.90) |
| 25 000–39 999 | 8568 | 1390 | 0.88 (0.82–0.94) | 0.91 (0.84–0.98) |
| 40 000–65 000 | 16 279 | 2817 | 0.94 (0.88–0.99) | 0.94 (0.89–1.00) |
| >65 000 | 8331 | 1566 | Reference | Reference |
FR: fecundability ratio.
Adjusted for age, partner’s age, educational attainment, partner’s school level, and Perceived Stress Scale and Major Depression Inventory Score.
The analysis using the composite SES as the exposure yielded inverse associations for all combinations of SES components compared with the component consisting of high educational attainment and high household income (Table V). For example, participants with middle educational attainment and low income had the lowest fecundability (FR = 0.73, 95% CI: 0.66–0.81), followed by those with both low educational attainment and low income (FR = 0.77, 95% CI: 0.69–0.81). Participants with low educational attainment and high income (FR = 0.95, 95% CI: 0.63–1.42) and participants with high educational attainment and middle income (FR = 0.95, 95% CI: 0.89–1.01) had FRs closest to the reference group (high educational attainment and high household income).
Socioeconomic status score and fecundability (n = 10 475).
| Educational attainment | |||
|---|---|---|---|
| Income | Low | Middle | High |
| Low | 0.77 (0.69–0.87) | 0.73 (0.66–0.81) | 0.88 (0.82–0.94) |
| Middle | 0.83 (0.66–1.03) | 0.86 (0.78–0.93) | 0.95 (0.89–1.01) |
| High | 0.95 (0.63–1.42) | 0.84 (0.71–0.99) | Reference |
| Lowa | 0.83 (0.73–0.95) | 0.76 (0.68–0.86) | 0.89 (0.83–0.96) |
| Middlea | 0.86 (0.69–1.08) | 0.88 (0.80–0.96) | 0.94 (0.88–1.00) |
| Higha | 0.95 (0.64–1.43) | 0.87 (0.74–1.03) | Reference |
Adjusted for age, mother’s educational attainment, father’s educational attainment, BMI at Age 17, smoking at Age 17, partner’s age, partner’s school level, Perceived Stress Scale (PSS) score, and Major Depression Inventory (MDI) score.
Education: low (primary and secondary school, upper secondary school), middle (vocational education, lower tertiary education), and high (middle tertiary education, upper tertiary education).
Income: low (<40 000 DKK), middle (40 000–65 000 DKK), and high (>65 000 DKK).
Discussion
In this prospective cohort study of Danish couples attempting to conceive, lower educational attainment and household income were associated with lower fecundability. Use of a composite exposure of SES encompassing education and income showed similar results as the main analysis.
Three cohort studies (Burdorf et al., 2011; Mutsaerts et al., 2012; Schrager et al., 2020) have investigated the association between SES and fecundability, only one of which used a prospective cohort design (Schrager et al., 2020). Our findings agree with Schrager et al.’s (2020) prospective cohort study of 8654 couples planning a pregnancy, which found an association between lower educational attainment and reduced fecundability (13–15 versus ≥17 years of educational attainment: FR = 0.84, 95% CI: 0.78–0.91), and an association for the lowest household income versus the highest (<$50 000 versus >$150 000 annual household income: FR = 0.91, 95% CI: 0.83–1.01) (Schrager et al., 2020). Our results are also consistent with the retrospective cohort study by Burdorf et al. (2011), which showed that greater educational attainment was associated with lower odd ratios of a prolonged TTP (>6 months) among 6302 pregnant women for high versus low educational attainment (OR = 0.57, 95% CI: 0.46–0.76) (Burdorf et al., 2011). Mutsaerts et al.’s (2012) retrospective cohort study of 1924 pregnant women also found an association, with lower hazard ratios of becoming pregnant for those with lower educational attainment (low versus high educational attainment: HR = 0.86, 95% CI: 0.72–1.03), but not for those with lower monthly household income (low versus high income: HR = 1.42 (0.71–2.85)). However, the results were imprecise (Mutsaerts et al., 2012). Both Burdorf et al. (2011) and Mutsaerts et al. (2012) relied on cohorts of pregnant women; they thereby excluded couples who did not conceive. In addition, bias could potentially be introduced if recall of TTP was associated with SES and if those with higher income or educational attainment more accurately recalled their TTP. Furthermore, Burdorf et al. (2011) used a dichotomous outcome dividing TTP into more versus <6 months, where >6 months was considered prolonged TTP. Other studies have measured TTP in early pregnancy (Burdorf et al., 2011; Mutsaerts et al., 2012; Thoma et al., 2013), restricted their analysis to women with a live birth (Burdorf et al., 2011), or ascertained dichotomous measures of infertility (Burdorf et al., 2011; Kassa and Kebede, 2018). In contrast, we used a prospective design in which participants were enrolled during the preconception period. In the existing literature, most studies have investigated educational attainment alone in relation to fecundability, without considering household income. However, two studies that have investigated household income and fecundability did not find a clear association, in contrast to our study (Mutsaerts et al., 2012; Schrager et al., 2020). Surprisingly, we found a strong association between income and fecundability, particularly among female participants older than 30 years, despite the Danish welfare state with free education, tax-supported health care and social benefits. These results indicate that the redistributive welfare system in Denmark does not suffice to eradicate inequities in reproductive health.
There are some limitations to be considered in our study. There were few participants with lower educational attainment in the study population, leading to imprecise estimates for the lower education group. As well, our study may be subject to selection bias if participation was associated with both SES and TTP at study entry. This could occur if participants with lower SES had longer pregnancy attempt times at study entry compared with participants with higher SES, and if participation was dependent on SES. This would produce an underestimation of the association. However, since we restricted our analysis to couples who had been trying to conceive for six cycles or less at study entry and thereby reduced the potential for selection bias, participation was less likely to be associated with TTP.
Loss to follow-up was higher among participants with lower SES, but we do not know whether loss to follow-up also was associated with fertility leading to potential selection bias (Hernán et al., 2004). Overall, loss to follow-up was <15% in all exposure groups.
Both information on SES and pregnancy status, including LMP date and covariates such as smoking status and weight at Age 17 were self-reported, which may be subject to recall error. Because of the prospective design, we do not expect any misclassification of SES to be dependent on TTP (Kristensen, 1992; Eijkemans et al., 2019). In general, we collected data on a wide range of confounders, but residual confounding was still possible in our study. For instance, complete information on partner’s educational attainment and information on neighborhood SES was not available. Furthermore, we were unable to account for working conditions, other occupational exposures, and health literacy. These factors may directly or indirectly affect fecundability and are expected to be unevenly distributed across educational attainment and income categories, thus contributing to the observed association between the SES and fecundability.
In this study, data were combined from the SG and SF cohorts. Combining the two cohorts results in missing values for some variables, since the questionnaires were not identical (e.g. parental educational attainment, MDI, and PSS were not assessed in both cohorts). To account for missing data, we used multiple imputation to impute data on exposure, outcome, and covariates.
Although our study does not include those seeking fertility treatment at enrollment, couples may indeed initiate fertility treatment during follow-up. Moreover, fertility levels in our study population span the full spectrum from subfertile to highly fertile individuals. The results of this study should therefore be applicable to most couples who are trying to conceive.
To investigate the association between SES and fecundability, we used the indicators of educational attainment and household income. However, SES is complex. There may be some underlying and partially unknown mechanisms in SES that affect access to and utilization of resources, health literacy and lifestyle factors (Schrager et al., 2020). Educational attainment and household income might not completely reflect these constructs. Other definitions of SES incorporate such factors as occupation, ethnicity, cultural characteristics, and neighborhood characteristics (Willis et al., 2022a; Ejlskov et al., 2023; Neighborhood Atlas—Home, 2018; Oxford Reference, n.d.).
The association between SES and fecundability identified in our study is consistent with well-documented socioeconomic inequities in health and indicates that these inequities extend to reproductive health. In line with other conditions, socioeconomic inequities in fecundability might be explained by individuals in lower socioeconomic groups being simultaneously exposed to multiple risk factors (Evans and Kim, 2010). Exposure to multiple risk factors affecting health may originate in childhood (Marshall et al., 2015) and may relate to living conditions, lifestyle factors, access to and quality of health care, and other aspects of SES. In our analysis, we did not adjust for lifestyle factors, such as diet, physical activity, smoking, and alcohol intake. These factors are associated with SES and fecundability, but we consider them to be mediating factors (Wise et al., 2012; Wesselink et al., 2019; Høyer et al., 2020; Willis et al., 2022b). Furthermore, we were unable to adjust for health literacy, which is associated with educational attainment, but also could affect the individuals’ ability to follow health recommendations, i.e. advice on healthy diet and folic acid supplementation, or knowledge about their fertile window (i.e. interval in the menstrual cycle during which sexual intercourse would maximize chances of conception).
The results also show that female participants aged ≥30 years with a low income have a lower fecundability compared with participants <30 years with a low income, which illustrates that low SES or limited resources have an even higher impact on fecundability with advanced age.
Little is known about the ways to address inequity in reproductive health, but future research could explore the extent to which working conditions, occupational exposures or health literacy influence fecundability.
Overall, our results indicate that lower educational attainment and lower household income are associated with lower fecundability, after adjusting for potential confounders. The associations for income were surprisingly strong considering the Danish welfare state with a high degree of economic redistribution. These results indicate that the redistributive welfare system in Denmark does not suffice to eradicate inequities in reproductive health.
Data availability
To comply with Danish and European regulations on data protection, data used in this article will not be made publicly available. Data may be made available to researchers pending on application to and approval by the SnartForældre.dk principal investigators (info@snartforældre.dk).
Acknowledgements
We thank Tina Christensen for her support with data collection and media contacts in SnartGravid.dk and SnartForældre.dk and we acknowledge the valuable contributions from study participants.
Authors’ roles
A.S.D.L. and E.M.M. designed the study and guided the analyses. E.M.M., H.T.S., E.E.H., K.J.R., and L.A.W. planned and initiated SnartGravid.dk and SnartForældre.dk. M.D.J. conducted the data analysis and wrote the first draft of the article. All authors contributed to interpretation of the data and have read and approved the final version of the article.
Funding
Department of Clinical Epidemiology, Aarhus University and Aarhus University Hospital, and the National Institute of Child Health and Human Development (RO1-HD086742, R21-HD050264, and R01-HD060680).
Conflict of interest
The authors declare no conflicts of interest.
