


Abstract
Is it economically worthwhile to use GnRH agonist (GnRHa) to prevent menopausal symptoms (MS) and protect fertility in premenopausal women with breast cancer (BC) during chemotherapy from the US perspective?
It is cost-effective to administer GnRHa during chemotherapy in order to forefend MS in premenopausal patients with BC when the willingness-to-pay (WTP) threshold is $50 000.00 per quality-adjusted life-year (QALY), and to preserve fertility in young patients with BC who undergo oocyte cryopreservation (OC), or no OC, when the WTP thresholds per live birth are $71 333.33 and $61 920.00, respectively.
Chemotherapy often results in premature ovarian insufficiency (POI) in premenopausal survivors of BC, causing MS and infertility. Administering GnRHa during chemotherapy has been recommended for ovarian function preservation by international guidelines.
Two decision-analytic models were developed, respectively, for preventing MS and protecting fertility over a 5-year period, which compared the cost-effectiveness of two strategies: adding GnRHa during chemotherapy (GnRHa plus Chemo) or chemotherapy alone (Chemo).
The participants were early premenopausal women with BC aged 18–49 years who were undergoing chemotherapy. Two decision tree models were constructed: one for MS prevention and one for fertility protection from the US perspective. All data were obtained from published literature and official websites. The models’ primary outcomes included QALYs and incremental cost-effectiveness ratios (ICERs). The robustness of the models was tested by sensitivity analyses.
In the MS model, GnRHa plus Chemo resulted in an ICER of $17 900.85 per QALY compared with Chemo, which was greater than the WTP threshold of $50 000.00 per QALY; therefore, GnRHa plus Chemo was a cost-effective strategy for premenopausal women with BC in the USA. Probabilistic sensitivity analysis (PSA) results showed an 81.76% probability of cost-effectiveness in the strategy. In the fertility model, adding GnRHa for patients undergoing OC and those who were unable to undergo OC resulted in ICERs of $67 933.50 and $60 209.00 per live birth in the USA, respectively. PSA indicated that GnRHa plus Chemo was more likely to be cost-effective over Chemo when the WTP for an additional live birth exceed $71 333.33 in Context I (adding GnRHa to preserve fertility in young patients with BC after OC) and $61 920.00 in Context II (adding GnRHa to preserve fertility in young patients with BC who cannot accept OC).
The indirect costs, such as disease-related mental impairment and non-medical costs (e.g. transportation cost) were not included. All data were derived from previously published literature and databases, which might yield some differences from the real world. In addition, the POI-induced MS with a lower prevalence and the specific strategy of chemotherapy were not considered in the MS model, and the 5-year time horizon for having a child might not be suitable for all patients in the fertility model.
When considering the economic burden of cancer survivors, the results of this study provide an evidence-based reference for clinical decision-making, showing that it is worthwhile to employ GnRHa during chemotherapy to prevent MS and preserve fertility.
This work was supported by the Natural Science Foundation of Fujian Province [2021J02038]; and the Startup Fund for Scientific Research, Fujian Medical University [2021QH1059]. All authors declare no conflict of interest.
N/A.
Introduction
It is estimated that by 2020, the incidence of breast cancer (BC) had surpassed that of lung cancer and become the primary cause of cancer in women globally, accounting for one in four cancer cases (Sung et al., 2021). Approximately 30% of women with BC are of reproductive age (Heer et al., 2020). Chemotherapy remains the cornerstone of treatment for patients with BC (Lambertini et al., 2016). However, cytotoxic drugs may result in premature ovarian insufficiency (POI), which elevates the risk of menopausal symptoms (MS) and infertility.
MS seriously damage the physical and psychological health of patients with BC and increase the economic burden on the patients themselves and the healthcare system. Administering GnRH agonist (GnRHa) during chemotherapy has been shown to significantly attenuate the risk of MS in premenopausal patients with BC (Lambertini et al., 2019). GnRHa stimulates release of gonadotrophins and sex hormones in the short term, and then causes suppression of the hypothalamic–pituitary–gonadal axis with continued administration. GnRHa facilitates ovary quiescence, which would make the ovary less sensitive to chemotherapy-induced damage. In premenopausal patients with BC, temporary ovarian suppression with GnRHa during chemotherapy is considered the standard strategy for reducing MS risk in international guidelines (Webber et al., 2016).
International guidelines also recommend that all young patients with BC should be informed of the potential risk of chemotherapy-induced infertility as soon as possible after diagnosis and before initiation of anticancer therapies (Anderson et al., 2020; Lambertini et al., 2020; Oktay et al., 2018). Fertility protection measures for cancer patients mainly include assisted reproductive technology (ART) and medical protection of ovarian function. GnRHa is the only drug that has been introduced into clinic practice to protect the fertility of cancer survivors so far. Furthermore, GnRHa treatment is a simple, feasible, and low-cost alternative compared to ART. In a large meta-analysis that included all randomized controlled trials (RCTs) from 2014 to 2018, GnRHa was shown to be effective in increasing ovulation rate during chemotherapy in premenopausal patients with BC (Lambertini et al., 2018). Administering GnRHa during chemotherapy should be considered after oocyte cryopreservation (OC) and when OC is contraindicated or unavailable in young patients with cancer who wish to preserve fertility.
With the emphasis on cancer treatment, the ovarian damage caused by anticancer treatments, especially chemotherapy, are often overlooked, yet well-preserved ovarian function is crucial for young patients with BC (Codacci-Pisanelli et al., 2017). Considering the widespread demand for ovarian function protection in young women, as well as the effectiveness of GnRHa treatment, its tolerable side effects and low cost, our study aimed to analyze the cost-effectiveness of ovarian function protection using GnRHa in premenopausal women with early BC undergoing chemotherapy in the USA, thereby providing an economic reference for clinical decision-making and policy formulation.
Materials and methods
Model overview
Two decision tree models were constructed for MS prevention and fertility protection using TreeAge Pro 2020 (TreeAge Software, Williamstown, MA, USA). Our study was conducted according to CHEERS reporting guidelines (Husereau et al., 2013). The targeted population for the MS model was newly diagnosed as Stage I, II, or III female patients with BC, who would be candidates for adjuvant or neoadjuvant chemotherapy, aged 18–49 years, and be premenopausal. Similarly, the targeted population for the fertility model was premenopausal women (aged 18–49 years) diagnosed with early-stage BC who had a pregnancy intention but planned to receive gonadotoxic chemotherapy regimens. Premenopausal was defined as the presence of active menstrual cycles or normal menses during the 6 weeks preceding the start of chemotherapy.
The first decision-analytic model about preventing MS compared the cost-effectiveness of two strategies: adding GnRHa while undergoing chemotherapy (GnRHa plus Chemo); and chemotherapy alone (Chemo). The treatment regimen in our model was 3 weeks per cycle, and the total treatment course was six cycles. The GnRHa plus Chemo group received a standard dose of GnRHa prior to the initiation of the chemotherapy treatment, and continued to use GnRHa every 3 weeks alongside the chemotherapy cycles, with the basis that GnRHa could reduce the risk of MS caused by chemotherapy. Based on the literature, the four common MS, including hot flash, genitourinary syndrome (GSM), osteoporosis, and cardiovascular disease (CVD) were included in our MS model. Hot flash and GSM always remain for a long time, ranging from 6 months to 5 years (Molina et al., 2005; Brédart et al., 2011), and osteoporosis and CVD also occur during this period (Bradshaw et al., 2016; Sauerbrun-Cutler and Alvero, 2019). Therefore, a study horizon of 5 years was selected for MS model. In addition, temporary amenorrhea (TA) caused by chemotherapy and GnRHa was also considered in the study. This model structure is presented in Fig. 1.
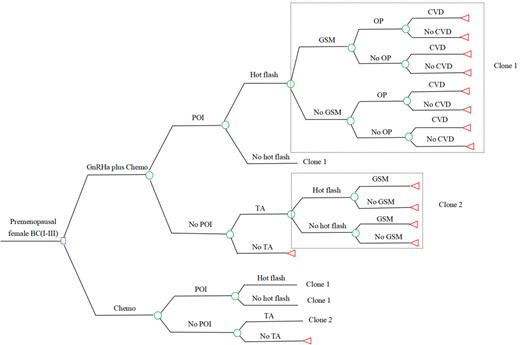
Decision tree of the MS model. Circles represent a chance node, squares represent a decision node, and triangles represent an ending node. Clone represents a copy of the decision tree branches in the dotted box, corresponding to the clone number in a same tree. BC, breast cancer (Stages I–III); Chemo, chemotherapy; CVD, cardiovascular disease; GnRHa, GnRH agonist; GnRHa plus Chemo, adding GnRHa during chemotherapy; GSM, genitourinary syndrome; MS, menopausal symptoms; OP, osteoporosis; POI, premature ovarian insufficiency; TA, temporary amenorrhea.
The other model was performed to estimate the cost-effectiveness of fertility preservation with or without GnRHa during chemotherapy in early-stage female patients with BC who wish to remain fertile (Fig. 2). GnRHa was offered in two contexts, namely after OC and when OC was contraindicated or unavailable (Anderson et al., 2020; Lambertini et al., 2020). Administration of GnRHa during chemotherapy could diminish the POI risk and then increase the successful rate of natural pregnancy and natural live birth. Patients without POI have a chance to conceive naturally both in Context I (adding GnRHa to preserve fertility in young patients with BC after OC) and in Context II (adding GnRHa to preserve fertility in young patients with BC who cannot accept OC), while if natural pregnancy or natural live birth fails, these patients in Context I will undergo the subsequent steps of ART (post-chemo thawing cycle and frozen embryo transfer). Patients with POI in Context I can only conceive through subsequent ART, while patients with POI in Context II forfeit their chance of pregnancy. The length of time that patients were instructed to wait to conceive after cancer diagnosis was variable and could range anywhere from 2 to 5 years depending on the type of cancer, age at diagnosis, length of cancer treatment, and risk of recurrence. We used a conservative 5-year interval for our model, similar to other fertility-related studies (Lyttle Schumacher et al., 2017; Chung et al., 2021). Effectiveness was expressed as the cumulative live birth rate after 5 years.
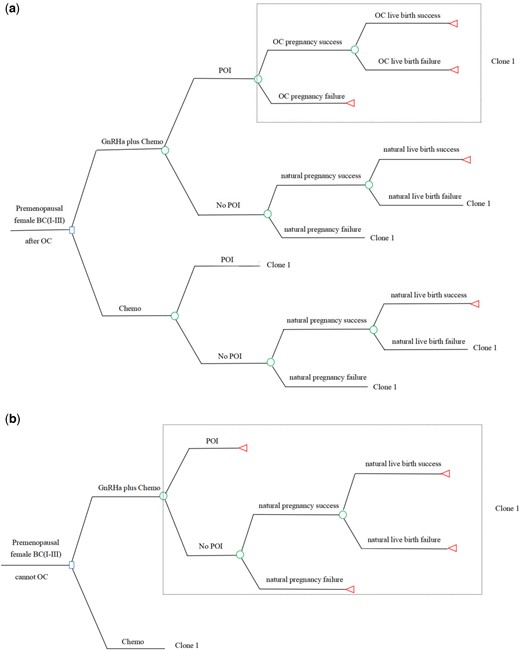
Decision tree of the fertility model. The decision tree of the fertility model is shown for Context I (a) and Context II (b). Context I: adding GnRHa to preserve fertility in young patients with breast cancer after OC. Context II: adding GnRHa to preserve fertility in young patients with breast cancer who cannot accept OC. Circles represent a chance node, squares represent a decision node, and triangles represent an ending node. Clone represents a copy of the decision tree branches in the dotted box, corresponding to the clone number in a same tree. BC, breast cancer (Stages I–III); Chemo, chemotherapy; GnRHa, GnRH agonist; GnRHa plus Chemo, adding GnRHa during chemotherapy; OC, oocyte cryopreservation; POI, premature ovarian insufficiency.
Model inputs
Probability parameters
Probability data for the models were derived from published literature (Table I).
Detailed information on model parameters.
| Variable | Value (range) | Distribution | Reference |
|---|---|---|---|
| Cost ($) | |||
| Chemo | 2854.27 (2397.59–3310.95) | Gamma (38.11, 0.01) | (Hannouf et al., 2020) |
| GnRHa | 4913.30 (3439.31–6387.29) | Gamma (1207.39, 0.25) | (Kwon et al., 2016) |
| BC surveillance per year | 807.70 (646.16–969.24) | Gamma (25.00, 0.03) | (Retèl et al., 2020) |
| Hot flash treatment per year | 97.64 (78.11–117.17) | Gamma (25.00, 0.26) | Red Book |
| GSM treatment first year | 1839.66 (1048.61–2630.71) | Gamma (5.35, 0.003) | Red Book |
| GSM treatment subsequent year | 1668.95 (951.30–2386.60) | Gamma (5.36, 0.003) | Red Book |
| OP drug treatment per year | 148.02 (118.42–177.62) | Gamma (25.00, 0.17) | Red Book |
| Calcium and vitamin D per year | 63.40 (50.72–76.08) | Gamma (25.00, 0.39) | (Weaver et al., 2019) |
| DXA per time | 45.93 (36.74–55.12) | Gamma (25.00, 0.54) | (Agten et al., 2017) |
| CVD treatment first year | 7410.57 (5928.46–8892.68) | Gamma (25.00, 0.003) | (Armstrong et al., 2001) |
| CVD treatment subsequent year | 2319.57 (1855.66–2783.48) | Gamma (25.00, 0.01) | (Armstrong et al., 2001) |
| Pre-chemotherapy OC | 15 535.59 (5304.26–19 473.41) | Gamma (25.00, 0.002) | (Devine et al., 2015; Lyttle Schumacher et al., 2017; Fuchs Weizman et al., 2021) |
| Cryopreservation storage per year | 370.81 (134.84–2022.58) | Gamma (25.00, 0.07) | (Hirshfeld-Cytron et al., 2012) |
| Post-chemotherapy thaw cycle | 5841.92 (3930.38–14 759.92) | Gamma (25.00, 0.004) | (Devine et al., 2015; Lyttle Schumacher et al., 2017) |
| Frozen embryo transfer | 6066.38 (4766.54–19 074.24) | Gamma (25.00, 0.004) | (Chung et al., 2021) |
| Utility value | |||
| Early BC | 0.94 (0.89–0.97) | Beta (0.56, 0.04) | (Lidgren et al., 2008) |
| Hot flash | 0.73 (0.58–0.88) | Beta (6.02, 2.23) | (Kolu et al., 2015) |
| GSM | 0.78 (0.62–0.94) | Beta (4.72, 1.33) | (Dymond et al., 2021) |
| OP | 0.75 (0.60–0.90) | Beta (5.50, 1.83) | (Thompson et al., 2007) |
| CVD | 0.84 (0.79–0.90) | Beta (3.16, 0.60) | (Sun et al., 2019) |
| POI risk | |||
| GnRHa plus Chemo | 0.09 (0.07–0.11) | Beta (22.66, 229.12) | (Del Mastro et al., 2011) |
| Chemo | 0.26 (0.21–0.31) | Beta (18.24, 51.91) | (Del Mastro et al., 2011) |
| MS risk | |||
| Hot flash | 0.50 (0.40–0.60) | Beta (12.00, 12.00) | (Vincent et al., 2014) |
| GSM | 0.37 (0.30–0.44) | Beta (15.38, 26.19) | (Sukumar et al., 2021) |
| OP | 0.31 (0.25–0.37) | Beta (16.94, 37.71) | (Waltman et al., 2008) |
| CVD | 0.08 (0.06–0.10) | Beta (22.92, 263.58) | (Honigberg et al., 2019) |
| TA risk | |||
| GnRHa plus Chemo | 0.73 (0.58–0.88) | Beta (6.02, 2.23) | (Lambertini et al., 2015) |
| Chemo | 0.64 (0.51–0.77) | Beta (8.36, 4.70) | (Lambertini et al., 2015) |
| TA-induced symptom risk | |||
| Hot flash | 0.09 (0.07–0.11) | Beta (22.66, 229.18) | (Taylor et al., 1998) |
| GSM | 0.21 (0.17–0.25) | Beta (19.54, 73.51) | (Sukumar et al., 2021) |
| Successful natural pregnancy rate | |||
| GnRHa plus Chemo | 0.21 (0.17–0.25) | Beta (19.54, 73.51) | (Moore et al., 2015) |
| Chemo | 0.11 (0.09–0.13) | Beta (22.14, 179.13) | (Moore et al., 2015) |
| Successful natural live birth rate | |||
| GnRHa plus Chemo | 0.64 (0.51–0.77) | Beta (8.36, 4.70) | (Moore et al., 2015) |
| Chemo | 0.50 (0.40–0.60) | Beta (12.00, 12.00) | (Moore et al., 2015) |
| OC | |||
| Successful pregnancy rate | 0.34 (0.27–0.41) | Beta (16.16, 31.37) | (Diaz-Garcia et al., 2018) |
| Successful live birth rate | 0.85 (0.68–0.90) | Beta (2.90, 0.52) | (Diaz-Garcia et al., 2018) |
BC, breast cancer; Chemo, chemotherapy; CVD, cardiovascular disease; DXA, dual-energy X-ray absorptiometry; GnRHa, GnRH agonist; GnRHa plus Chemo, adding GnRHa during chemotherapy; GSM, genitourinary syndrome; MS, menopausal symptoms; OC, oocyte cryopreservation; OP, osteoporosis; POI, premature ovarian insufficiency; TA, temporary amenorrhea.
In the MS model, the POI probability of GnRHa plus Chemo and Chemo was based on a large RCT (Del Mastro et al., 2011), which compared the incidence of chemotherapy-induced early menopause in premenopausal patients with early-stage BC undergoing GnRHa or not during chemotherapy. The four most common MS caused by POI, as well as TA induced by chemotherapy and GnRHa, were considered in the model by branching. The probabilities of hot flash, GSM, osteoporosis, and CVD were derived from the menopause-related symptoms reported in the literature (Waltman et al., 2008; Vincent et al., 2014; Honigberg et al., 2019; Sukumar et al., 2021), while the likelihood of TA-related hot flash and GSM were sourced from the study of adverse effects associated with estrogen reduction caused by GnRHa (Taylor et al., 1998; Sukumar et al., 2021).
In the fertility model, the POI-related data for GnRHa plus Chemo and Chemo were based on a large RCT, which compared the incidence of chemotherapy-induced early menopause in premenopausal patients with early-stage BC undergoing GnRHa or not during chemotherapy (Del Mastro et al., 2011). The successful natural pregnancy rate and successful natural live birth rate in two arms were based on a Phase III trial, which reported the pregnancy outcome within 5 years among premenopausal patients with BC employing GnRHa or not when receiving chemotherapy (Moore et al., 2015). The successful pregnancy rate and successful live birth rate for OC were sourced from a prospective observational cohort study comparing OC with ovarian tissue cryopreservation in female patients who planned to receive gonadotoxic treatments (Diaz-Garcia et al., 2018).
Costs and utilities
The models were conducted from the US perspective, and only the direct medical costs were considered. The cost of the MS model included cost of drugs, management of MS, management of TA-related symptoms, and surveillance of BC. The drug prices data were acquired from the Red Book (IBM RED BOOK Online®/Micromedex, 2021). Other costs were derived from published literature and identified by medical experts. For the fertility model, the ART of OC was used as it is an established technique with widespread application. The overall costs related to OC included the pre-chemotherapy (OC cycle with medicines) fee (Devine et al., 2015; Lyttle Schumacher et al., 2017; Fuchs Weizman et al., 2021), expenditure for 5 years of cryopreservation storage (Hirshfeld-Cytron et al., 2012), cost of the post-chemotherapy thaw cycle (Devine et al., 2015; Lyttle Schumacher et al., 2017), as well as the frozen embryo transfer (Chung et al., 2021). The costs related to OC were derived from literature that obtained charges from 17 randomly selected regionally diverse clinics. In Context I, there were no post-chemotherapy thaw cycle costs and frozen embryo transfer expenses if the patient achieved a successful natural pregnancy and a live birth, so only the pre-chemotherapy fee and cryopreservation storage expenditure were calculated. In Context II, OC costs do not need to be included for patients because these patients are contraindicated or unavailable to undergo OC. All costs were discounted by a 5% annual rate. We adjusted costs for inflation to reflect 2021 US dollars using the US Consumer Price Index (US Bureau of Labor Statistics, 2021).
Health utility values were obtained from published relevant pharmacoeconomic literature, which had similar states to this study (Thompson et al., 2007; Lidgren et al., 2008; Kolu et al., 2015; Sun et al., 2019; Dymond et al., 2021); chemotherapy-induced ovarian failure causes the estrogen levels to decline rapidly with symptoms of acute estrogen deficiency, which is similar to oophrectomy or treatment with GnRHa (Shapiro et al., 2001). Hence, the utility values of menopause and TA associated with the symptoms of acute estrogen deficiency, including hot flash and GSM, were the same. Comprehensive details about the costs and utility values are listed in Table I.
Model outputs
The primary outputs of the MS model included the total cost, quality-adjusted life-years (QALYs), and incremental cost-effectiveness ratios (ICERs). The estimation of QALYs was obtained by multiplying the time spent in each state by the utility of each state. ICERs were obtained by dividing the costs difference by the QALYs difference between the two strategies.
While the main outputs of the fertility model were the total cost, live birth rate, and ICERs. ICERs were obtained by dividing the costs difference by the live birth rate difference between the two strategies.
Cost-effectiveness analyses
The willingness-to-pay (WTP) threshold was set based on published research, which was $50 000.00 per QALY (Wallace et al., 2020). ICERs below the WTP threshold are considered as cost-effective in the MS model. However, there was no currently set threshold that could be used to compare ICERs in the fertility model.
Sensitivity analyses
To test the robustness of the models, we conducted a series of sensitivity analyses. In probabilistic sensitivity analysis (PSA), 10 000 Monte Carlo simulations were performed by varying the variables simultaneously based on their distributions. The Beta distribution was selected for the utility values and the probability parameters, while Gamma distribution was adopted for the cost parameters. In one-way sensitivity analysis, all the key variables were adjusted up and down within a reasonable range. The maximum and minimum values of these variables were obtained from the literature and a benchmark value ±20% was used in the case of lacking data. The discount rate varied from 0% to 8%.
Scenario analyses
According to the latest RCT results (Zong et al., 2022), the POI rate was 10.30% in GnRHa plus Chemo and 44.50% in the Chemo. We updated the POI risk in two models. Considering POI was defined as no resumption of menstrual activity and postmenopausal levels of both FSH and estradiol for 1 year after the end of chemotherapy (Del Mastro et al., 2011), we also conducted a scenario analysis that only looks at the QALYs at 1 year for the MS model.
Results
Base-case analyses
In the MS model with a 5-year horizon, patients receiving GnRHa plus Chemo gained 4.60 QALYs, which was 0.13 QALYs more than those receiving Chemo. The GnRHa plus Chemo yielded extra expenditure about $2327.11, which resulted in an ICER of $17 900.85 per QALY over Chemo in the USA. More details on the base-case results are presented in Table II.
The base-case analysis results for the MS model and fertility model.
| Regimen | GnRHa plus Chemo | Chemo | Incremental |
|---|---|---|---|
| MS model | |||
| Total cost ($) | 13 106.11 | 10 779.00 | 2327.11 |
| Total QALYs | 4.60 | 4.47 | 0.13 |
| ICER ($/QALY) | 17 900.85 | ||
| Fertility model | |||
| Context I | |||
| Total cost ($) | 38 988.01 | 34 912.00 | 4076.01 |
| Live birth rate | 0.38 | 0.32 | 0.06 |
| ICER ($/live birth) | 67 933.50 | ||
| Context II | |||
| Total cost ($) | 11 165.14 | 6348.42 | 4816.72 |
| Live birth rate | 0.12 | 0.04 | 0.08 |
| ICER ($/live birth) | 60 209.00 | ||
Chemo, chemotherapy; GnRHa, GnRH agonist; GnRHa plus Chemo, adding GnRHa during chemotherapy; MS, menopausal symptoms; ICER, incremental cost-effectiveness ratio; QALY, quality-adjusted life-year.
Context I: adding GnRHa to preserve fertility in young patients with breast cancer after OC; Context II: adding GnRHa to preserve fertility in young patients with breast cancer who cannot accept OC.
For fertility model, the results of employing GnRHa during chemotherapy in two different contexts are listed in Table II. In Context I, compared with no GnRHa, administering GnRHa after OC generated more cost, at $4076.01 ($38 988.01 versus $34 912.00), and also gained 6.00% more effectiveness (38.00% versus 32.00%), which is the cumulative likelihood of a live birth. GnRHa plus Chemo resulted in an ICER of $67 933.50 per live birth compared to Chemo. In Context II, the costs of GnRHa plus Chemo and Chemo were $11 165.14 and $6 348.42, with effectiveness of 0.12 and 0.04, respectively. Employing GnRHa with chemotherapy required an additional cost of $4816.72, with a higher live birth rate compared with chemotherapy alone, and resulted in an ICER of $60 209.00 per live birth.
Sensitivity analyses
PSA
In the MS model, the PSA results were exhibited as the cost-effectiveness acceptability curves. In the USA, when WTP was set as $50 000.00 per QALY, the additional use of GnRHa with chemotherapy was cost-effective, with an 81.76% probability (Fig. 3). Furthermore, the percentages of simulation replications for each quadrant of the cost-effectiveness plane are presented in Table III. The point estimates showed that GnRHa plus Chemo was more effective but also more costly than Chemo, which mostly occurred in 86.27% of replications (north-east quadrant). In 4.93% of replications, GnRHa plus Chemo dominated Chemo by being more effective and less costly. These results reaffirm the robustness of the model.
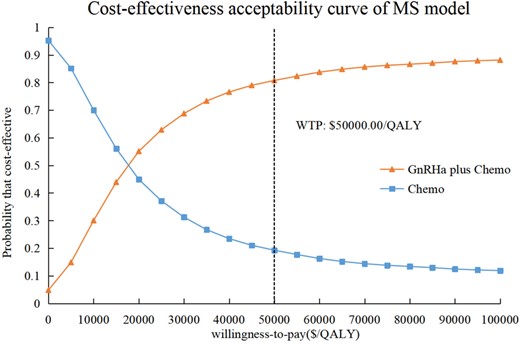
The cost-effectiveness acceptability curves in the USA for GnRHa plus Chemo compared to Chemo for MS model. The cost-effectiveness acceptability curve shows that GnRHa plus Chemo is cost-effective compared with Chemo at the WTP threshold of $50 000.00 per QALY, with an 81.76% probability. Chemo, chemotherapy; GnRHa, GnRH agonist; GnRHa plus Chemo, adding GnRHa during chemotherapy; MS, menopausal symptoms; QALY, quality-adjusted life-year; WTP, willingness-to-pay.
Quadrants of the cost-effectiveness plane for MS model.
| Group comparison | North-east (more effective but more costly) | South-west (less effective but less costly) | North-west (less effective but more costly, i.e. inferior) | South-east (more effective but less costly, i.e. dominant) |
|---|---|---|---|---|
| MS model | ||||
| GnRHa plus Chemo versus Chemo | 86.27% | 8.35% | 0.45% | 4.93% |
Chemo, chemotherapy; GnRHa, GnRH agonist; GnRHa plus Chemo, adding GnRHa during chemotherapy; MS, menopausal symptoms.
In the fertility model, GnRHa plus Chemo was more likely to be cost-effective over Chemo when the WTP for an additional live birth exceed $71 333.33 (Context I) and $61 920.00 (Context II), respectively. The results were reversed if the WTP were below $71 333.33 (Context I) and $61 920.00 (Context II) per live birth (Fig. 4).
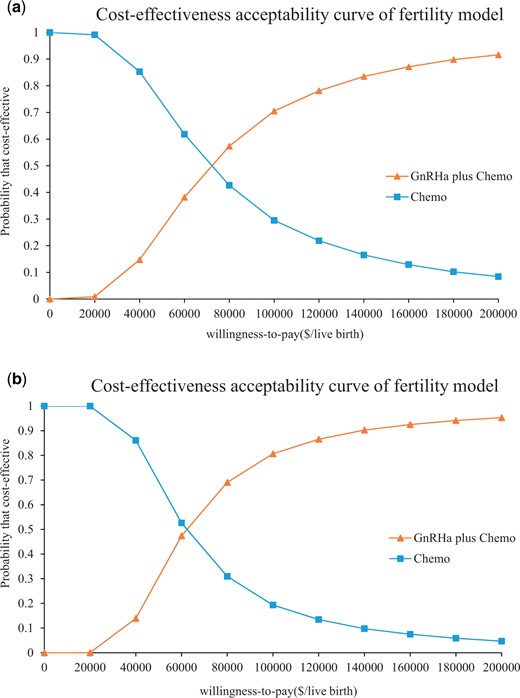
The cost-effectiveness acceptability curves in the USA for GnRHa plus Chemo compared to Chemo for the fertility model. The cost-effectiveness acceptability curves are shown for Context I (a) and Context II (b). Context I: adding GnRHa to preserve fertility in young patients with breast cancer after OC. Context II: adding GnRHa to preserve fertility in young patients with breast cancer who cannot accept OC. The flex point in the acceptability curve is used to estimate at what WTP threshold GnRHa plus Chemo would be cost-effective over Chemo in the above two contexts. GnRHa plus Chemo is more likely to be cost-effective over Chemo when the WTP for an additional live birth exceeds $71 333.33 (Context I) and $61 920.00 (Context II), respectively. Chemo, chemotherapy; GnRHa, GnRH agonist; GnRHa plus Chemo, adding GnRHa during chemotherapy; WTP, willingness-to-pay.
One-way sensitivity analysis
In the MS model, the results of the one-way sensitivity analysis are presented in Tornado diagrams. The POI risk with Chemo, the cost of GnRHa, and the utility value for hot flash were found to be the main influential variables for the model (Supplementary Fig. S1). All of these parameters within their plausible ranges did not reverse the results of our MS model, and ICERs were always lower than the WTP (Supplementary Table SI), which demonstrated the robustness of the model.
In the fertility model, the successful natural live birth rate for GnRHa plus Chemo, the successful natural pregnancy rate for GnRHa plus Chemo, and the cost of GnRHa were major variables in both Context I and Context II (Supplementary Fig. S2).
Scenario analyses
When the POI risk of GnRHa plus Chemo and Chemo were 10.30% and 44.50%, respectively, the economics of employing GnRHa to avoid MS would improve further. GnRHa plus Chemo became an absolute dominated strategy in the MS model. The ICERs of GnRHa plus Chemo to preserve fertility were diminished, resulting in an ICER of $60 006.53 (Context I) and $54 572.94 (Context II) per live birth in the fertility model. GnRHa plus Chemo was cost-effective when the WTP thresholds per additional live birth were above $62 020.00 and $56 200.80 in Context I and Context II, respectively.
In the MS model with a 1-year horizon, patients receiving GnRHa plus Chemo gained 0.89 QALYs, which was 0.02 QALYs more than only receiving Chemo. GnRHa plus Chemo resulted in an ICER of $276 354.50 per QALY over Chemo (Table IV).
The scenario analysis results in the MS model at 1 year.
| Regimen | GnRHa plus Chemo | Chemo | Incremental |
|---|---|---|---|
| In the USA | |||
| Cost at 1 year ($) | 9740.74 | 4213.65 | 5527.09 |
| QALYs at 1 year | 0.89 | 0.87 | 0.02 |
| ICERs ($/QALY) | 276 354.65 |
| Regimen | GnRHa plus Chemo | Chemo | Incremental |
|---|---|---|---|
| In the USA | |||
| Cost at 1 year ($) | 9740.74 | 4213.65 | 5527.09 |
| QALYs at 1 year | 0.89 | 0.87 | 0.02 |
| ICERs ($/QALY) | 276 354.65 |
Chemo, chemotherapy; GnRHa, GnRH agonist; GnRHa plus Chemo, adding GnRHa during chemotherapy; MS, menopausal symptoms; ICER, incremental cost-effectiveness ratio; QALYs, quality-adjusted life-years.
Discussion
Our results suggested that, in the USA, it was a cost-effective strategy to use GnRHa during chemotherapy to forefend MS, and the probability of GnRHa plus Chemo being cost-effective was 81.76% at the WTP threshold of $50 000.00 per QALY. The cost input is mainly in the first year. In the MS model, the cost difference between a 1-year horizon and 5-year horizon is subtle, because the cost occurs mainly in the first year. The outcome of MS prevention continues for more than 5 years, which contributes mostly to the difference of ICER. The ICER of GnRHa plus Chemo with the 1-year horizon was higher than that of the 5-year horizon ($276 354.50 versus $17 900.85 per QALY, respectively) owing to the higher QALYs gains in 5-year horizon (0.13 versus 0.02). The addition of GnRHa during chemotherapy for premenopausal patients with BC is more effective than Chemo, regardless of whether the time horizon is 1 year or 5 years, and the effectiveness gains with a 5-year horizon are greater. We believe that adding GnRHa to forefend MS during chemotherapy should be a worthwhile investment for premenopausal women with early BC. Our recommendation for GnRHa is supported by its favorable long-term outcome, with successful MS prevention and its lower cost.
Our results also demonstrated that GnRHa plus Chemo was cost-effective when the WTP thresholds per additional live birth were $71 333.33 (Context I) and $61 920.00 (Context II), respectively. Our study provides intuitive evidence for money input and an increased probability of live birth for the young survivor with BC who yearns for their own child, by choosing to add GnRHa to preserve fertility after OC, or no OC, and at what value will adding GnRHa be more cost-effective than no GnRHa.
Strengths and limitations of the study
To the best of our knowledge, this is the first study to demonstrate the cost-effectiveness of administering GnRHa to forefend MS and protect fertility during chemotherapy in premenopausal patients with early-stage BC. The study focused on the fertility demand of the special population of young patients with BC, and considered the corresponding expenditure alongside the clinical outcome. The cost remains a large barrier for patients to receive fertility preservation, while GnRHa is much cheaper and more easily available than ART (Takae et al., 2019; Chung et al., 2021), which is more expensive and even unavailable in some countries. The use of GnRHa for preserving fertility has received more attention, therefore our study provided an economic reference for GnRHa use in cancer survivors.
As with any model, there were some limitations in this study. First, most data for the models were derived from previously published literature. Only direct medical costs and costs of POI-induced physical damage (e.g. hot flash treatment, GSM treatment, and CVD treatment) from the US perspective were included, excluding the indirect non-medical (such as treatment-relevant time cost and patient care expenses) and disease-relevant mental impairment costs. So, it is inevitable that the results might have some differences compared to the real situation, and further study based on real-world data is warranted. Second, some POI-induced MS with a lower prevalence, such as cognitive impairment, as well as the specific strategy of chemotherapy, were not taken into account in the MS model, which may yield bias in minority patients with extreme high- or low-risk factors (Stearns et al., 2006). Third, the time to have a child varies considerably for each patient, and 5 years may not be appropriate for all patients with BC in the fertility model. However, the median time of live birth after BC is 40 months (Gerstl et al., 2018), and the 5-year cumulative live birth rate for fertility preservation ranged from 26.00% to 84.00%, with a median value of 66.00% (Lyttle Schumacher et al., 2017; Chung et al., 2021); therefore, our study covered at least two-thirds of the targeted population, which made it representative.
Comparison with other studies
There have been no pharmacoeconomic studies on the use of GnRHa for preventing MS and protecting fertility in cancer patients. The previous studies of ovarian protection mainly focused on the evaluations of non-drug treatment. Two previous economic evaluations of MS in Dutch populations have demonstrated that cognitive behavioral therapy and internet-based cognitive behavioral therapy were cost-effective in alleviating treatment-induced MS for patients with BC (Mewes et al., 2015; Verbeek et al., 2019). Two studies of fertility preservation that compared different ART strategies in cancer survivors indicated that OC is more costly but more effective than not undergoing OC and undergoing ovarian tissue cryopreservation (Lyttle Schumacher et al., 2017; Chung et al., 2021). Our study incorporated both medicine protection and ART, which would provide more comprehensive information.
Questions to be answered in future research
It is notable that currently no consensual value has been set as a WTP threshold for fertility; therefore, the outcome in the fertility model was the cost per live birth, referring to previous research on fertility preservation (Hirshfeld-Cytron et al., 2012; Chung et al., 2021). In the study, the flex point in the acceptability curve was employed to estimate at what WTP the use of GnRHa would be cost-effective. Therefore, there is a pressing need to develop the WTP value for fertility to identify a rigorous standard for economic studies in the field of fertility.
Implications
In conclusion, our results indicated that it is worthwhile to employ GnRHa during chemotherapy to prevent MS and preserve fertility in premenopausal women with early BC when considering the economic burden. The results of this study could focus the attention of policy-makers, clinicians, and the public on the intensive demand for ovarian protection in young patients with BC, and provide an effective reference for clinical decision-making to consider the appropriate allocation of funds to these special groups.
Data availability
The data underlying this article are available in the article and in its Supplementary Material.
Authors’ roles
Y.H.: conception and design, acquisition of data, analysis and interpretation of data, drafting the article, final approval of article. X.T.H.: conception and design, analysis and interpretation of data, revision of the article for critically important intellectual content, final approval of article. X.J.H.: acquisition of data, analysis and interpretation of data, final approval of article. S.L.: acquisition of data, final approval of article. S.H.L.: acquisition of data, final approval of article. D.G.: acquisition of data, final approval of article. X.W.: conception and design, revision of the article for critically important intellectual content, final approval of article. X.X.: conception and design, revision of the article for critically important intellectual content, final approval of article.
Funding
This work was supported by the Natural Science Foundation of Fujian Province [2021J02038]; and the Startup Fund for Scientific Research, Fujian Medical University [2021QH1059].
Conflict of interest
All authors declared no conflict of interest.
References
IBM RED BOOK Online®/Micromedex.
Author notes
The authors consider that Yaping Huang and Xiaoting Huang authors should be regarded as joint first authors.
