


Abstract
Is human leukocyte antigen (HLA)-F protein expressed in mid-secretory endometrium, and are its expression levels influenced by HLA-F gene polymorphisms and correlated with the abundance of uterine natural killer (uNK) cells and anti-inflammatory M2 macrophages?
HLA-F protein is expressed in mid-secretory endometrium, and levels are correlated with immune cell infiltration, plasma progesterone concentrations and HLA-F single-nucleotide polymorphisms (SNPs), however, women experiencing recurrent implantation failure (RIF) show differences when compared to women attending their first IVF treatment.
The immunomodulatory HLA class Ib molecules HLA-G and HLA-F are expressed on the extravillous trophoblast cells and interact with receptors on maternal immune cells. Little is known regarding HLA-F expression in endometrial stroma and HLA-F function; furthermore, HLA-F and HLA-G SNP genotypes and haplotypes have been correlated with differences in time-to-pregnancy.
Primary endometrial stromal cell (ESC) cultures (n = 5) were established from endometrial biopsies from women attending IVF treatment at a fertility clinic. Basic HLA-F and HLA-G protein expression by the ESCs were investigated. A prospective controlled cohort study was performed including 85 women with a history of RIF and 36 control women beginning their first fertility treatment and with no history of RIF. In some analyses, the RIF group was divided into unknown cause, male infertility, female infertility, and both female and male infertility. Endometrial biopsies and blood samples were obtained the day equivalent to embryo transfer in a hormone-substituted cycle.
HLA protein expression by ESCs was characterized using flow cytometry and western blot. In the cohort study, the specific immune markers HLA-F and HLA-G, CD56 and CD16 (NK cells), CD163 (M2 macrophages), FOXP3 (regulatory T cells) and CD138 (plasma cells) were analysed by immunohistochemistry and a digital image analysis system in endometrial biopsies. Endometrial receptivity was assessed by an endometrial receptivity array test (the ERA® test). Endometrial biopsies were examined according to modified Noyes’ criteria. SNPs at the HLA-F gene and HLA-G haplotypes were determined.
HLA-F protein is expressed in the endometrium at the time of implantation. Furthermore, the HLA-F protein levels were different according to the womeńs HLA-F SNP genotypes and diplotypes, which have previously been correlated with differences in time-to-pregnancy. Endometrial HLA-F was positively correlated with anti-inflammatory CD163+ M2 macrophage infiltration and CD56+ uNK cell abundance for the entire cohort. However, this was not the case for CD56+ in the female infertility RIF subgroup. HLA-F levels in the endometrial stroma were negatively correlated with plasma progesterone concentrations in the RIF subgroup with known female infertility. Conversely, HLA-F and progesterone were positively correlated in the RIF subgroup with infertility of the male partner and no infertility diagnosis of the woman indicating interconnections between progesterone, HLA-F and immune cell infiltration. Glandular sHLA-G expression was also positively correlated with uNK cell abundance in the RIF subgroup with no female infertility but negatively correlated in the RIF subgroup with a female infertility diagnosis.
Immunohistochemistry analyses of endometrial biopsies and DNA sequencing of HLA genes. Data will be shared upon reasonable request to the corresponding author.
The control group of women attending their first IVF treatment had an anticipated good prognosis but was not proven fertile. A significant age difference between the RIF group and the IVF group reflects the longer treatment period for women with a history of RIF. The standardization of hormonal endometrial preparation, which allowed consistent timing of endometrial and blood sampling, might be a strength because a more uniform hormonal background may more clearly show an influence on the immune marker profile and HLA class Ib levels in the endometrium by other factors, for example genetic polymorphisms. However, the immune marker profile might be different during a normal cycle.
The findings further highlight the importance of HLA-F and HLA-G at the implantation site and in early pregnancy for pregnancy success. Diagnostic measures and modulation of the complex interactions between HLA class Ib molecules, maternal immune cells and hormonal factors may have potential to improve fertility treatment.
This work was supported by the Region Zealand Health Sciences Research Foundation and the Zealand University Hospital through the ReproHealth Research Consortium ZUH. The authors declared there are no conflicts of interest.
Introduction
The endometrium consists of epithelial and stromal cells. In the secretory phase of the menstrual cycle, the endometrium undergoes decidualization under the influence of progesterone. Decidualization is important for embryo implantation and is referred to as the ‘implantation window’ (Dunn et al., 2003; Hess et al., 2007; Casper, 2011). The immune system is important in several phases of the reproductive cycle. Before and during the process of embryo implantation in the uterus different subpopulations of immune cells in the endometrium seem to interact with immune signalling proteins expressed by the blastocyst and in the endometrium (King et al., 1989; Bulmer et al., 1991; Rouas-Freiss et al., 1997; Le Bouteiller et al., 2007; Kofod et al., 2017). Investigations of these topics are important for further understanding of the normal implantation process and fertility-reducing pathophysiologies.
No implantation after at least three consecutive IVF treatments with fresh or frozen transfers of embryos of good quality has been classified as recurrent implantation failure (RIF). The aetiology and pathophysiology are complex and may originate in factors related to endometrial receptivity and uterine conditions, as well as maternal and paternal health and lifestyle factors (Simon and Laufer, 2012; Brosens et al., 2014; Timeva et al., 2014). The prevalence of RIF is reported from 10% up to 40% (Coughlan et al., 2014; Somigliana et al., 2018). For a better understanding and management of women experiencing RIF, it is necessary to further elucidate the mechanisms that control the implantation of the embryo.
The human leukocyte antigen (HLA) gene cluster on chromosome 6 is recognized among the most polymorphic genes in the human genome (MHC Sequencing Consortium, 1999). However, the non-classical HLA class Ib genes and proteins, HLA-E, -F and -G, show a limited polymorphism. The most studied HLA class Ib molecules, HLA-E and HLA-G, have a prominent immunomodulatory role at the foetal–maternal interface (Redman et al., 1984; Kovats et al., 1990; Ishitani et al., 2003; Hviid, 2006). HLA-F and HLA-G show tissue-specific expression patterns and have a high affinity for specific immunoglobulin-like transcripts (ILT) expressed by different subsets of immune cells and killer immunoglobulin-like transcripts (KIRs) on natural killer (NK) cells (Colonna et al., 1997; Carosella et al., 2015; Dulberger et al., 2017; Hackmon et al., 2017; Persson et al., 2017).
Although HLA-F was discovered in 1990, little is known regarding its function (Geraghty et al., 1990; Persson et al., 2020). HLA-F has a very distinct peptide presentation, as well as structural and regulatory properties. The structure of HLA-F consists of only half of the conserved HLA class I residues. Peptide and β2microglobulin-bound HLA-F shows a high affinity for ILT2 and ILT4 receptors. HLA-F preferentially binds 7–30 amino acid long peptides (Dulberger et al., 2017; Ho et al., 2019). HLA-F can interact with KIR 3 in an open conformer (OC) form without a bound peptide. HLA-F OC interactions with activating KIR3DS1 on NK cells are important for degranulation and antiviral responses (Goodridge et al., 2013; Lin and Yan, 2019). Recently, endometrial HLA-F mRNA expression was reported, and the HLA-F protein was detected by immunohistochemistry (Burrows et al., 2016; Kofod et al., 2017; Mika et al., 2018), however, not by other methods. Low HLA-F expression in the endometrium has been linked to reduced pregnancy success and reduced fertility (Mika et al., 2018; Langkilde et al., 2020). Moreover, HLA-F expression has been positively correlated to CD56+ uterine natural killer (uNK) cells, which are important for pregnancy success (Kofod et al., 2017). A single-nucleotide polymorphism (SNP) rs2523393 (A/G) in the progesterone-responsive enhancer of the HLA-F gene has been identified as the most significant HLA-F SNP among other SNPs implicated in fecundability. The rs2523393 AA genotype is associated with high HLA-F expression and shorter time-to-pregnancy (Burrows et al., 2016; Mika et al., 2018). This was also the result of an advanced time-to-pregnancy analysis, measured as the number of fertility treatment cycles, in women attending ART treatment. Notably, many of the women, who experienced a high number of implantation failures, carried the HLA-F SNP associated with low HLA-F mRNA, and probably also HLA-F protein expression, in the endometrium (Langkilde et al., 2020).
Studies indicate that HLA-G signalling may initiate immunomodulatory mechanisms to ensure blastocyst implantation, trophoblast invasion into the decidua and remodelling of spiral arteries for the development of a fully functional placenta (Kovats et al., 1990; Rouas-Freiss et al., 1997; Ishitani et al., 2003; Kofod et al., 2017). HLA-G expression was first reported in the placenta on extra-villous trophoblast (Redman et al., 1984; Kovats et al., 1990), and later the immunosuppressive effect of HLA-G on NK cells was detected (Chumbley et al., 1994; Rouas-Freiss et al., 1997). HLA-G acts as a high-affinity ligand for KIR2DL4 on decidual NK cells, the CD8 T cell co-receptor, the T cell receptor, the ILT2 receptor expression by multiple immune cells and the ILT4 receptor, expressed by macrophages and NK cells (Colonna et al., 1998; Rajagopalan et al., 2006; Shiroishi et al., 2006). Upon these interactions, HLA-G initiates T helper (TH) 2 differentiation, anti-inflammatory responses and other immunotolerogenic mechanisms. HLA-G can be induced by IL-10 and leukaemia inhibitory factor (Ibrahim et al., 2000; Lopez et al., 2006). Moreover, HLA-G expression in the endometrial stroma has been positively linked with CD56+ uNK cell infiltration and identified as prognostic for achieving pregnancy (Kofod et al., 2017). Certain HLA-G gene haplotypes have been associated with time-to-pregnancy in couples undergoing infertility treatment (Nilsson et al., 2020). Soluble HLA-G has been detected in endometrial fluid samples, and low expression levels of sHLA-G have been associated with infertility and low amounts of endometrial NK cells (Rizzo et al., 2015). Low levels of placental HLA-G expression and soluble HLA-G in maternal blood have been linked with preeclampsia (Yie et al., 2004; Rizzo et al., 2009).
NK cells are innate lymphoid immune cells (Caligiuri, 2008). Peripheral blood NK (pbNK) cells are characterized as CD56dim and CD16+ and are part of an immune response mainly towards intracellular pathogens or cellular stress. NK cell inactivation is ensured by inhibitory signals conveyed by surface molecules, such as HLA class I (Bellora et al., 2014). During pregnancy, pbNK cell counts are lowered and their cytotoxicity is suppressed (Mor et al., 2017). In the uterus, uNK cell counts are significantly higher compared with those in the peripheral blood, comprising about 30% of uterine leukocytes. Upon implantation, decidual NK (dNK) cells account for about 70% of uterine leukocytes. Uterine NK cells are characterized as CD56bright and CD16− with low cytotoxic properties. Uterine NK cells support the placental invasion, angiogenesis and vascular stability (Manaster et al., 2008; Mandal and Viswanathan, 2015). They secrete multiple cytokines and growth factors that mediate the regulation of other immune cells at the implantation site (Bulmer and Lash, 2019). Macrophages represent the second most prevalent population in the uterine environment, contributing to 20–25% of uterine leukocytes (Mor et al., 2017). In the peri-implantation period, the M1 phenotype prevails, which is characterized as TH1-like and pro-inflammatory. Following implantation the macrophage population becomes a mix of M1 and M2 and shifts towards a pro-M2 environment as the gestation progresses. The M2 cells are described as TH2-like, anti-inflammatory, immunosuppressive, expressing transforming growth factor-β, IL-10 and CD163 (Brown et al., 2014). Defects in macrophage function or polarization are implicated in pregnancy complications and outcome (Faas and de Vos, 2017; Wang et al., 2018). T cells are the third most prevalent lymphoid cell type at the foetal–maternal interface constituting about 5–10% of uterine leukocytes. During pregnancy a TH2 dominance is established and the amount of CD4+CD25+FOXP3+ regulatory T (Treg) cells increases as the gestation progresses both in the periphery and in the decidua. Treg induction might be initiated by seminal fluid and HLA-G+ trophoblasts (Robertson et al., 2013; Kofod et al., 2018). The main function of Tregs in pregnancy is to mediate immunosuppression of effector immune cell responses (Jorgensen et al., 2019; Tsuda et al., 2019).
The aims of the present study are based on several published observations. First, we wanted to characterize the expression of HLA-F protein in the endometrium. Secondly, by examining endometrial biopsies analysed with the use of digital immunohistochemical image software and corresponding data on HLA-F and HLA-G genotypes from the same women with RIF and a control group of women attending their first IVF treatment we wanted to test the following specific hypotheses: (i) Are the expression level of HLA-F and/or sHLA-G protein correlated with the numbers of CD56+ uNK cells, the CD163+ M2 macrophages and/or the FOXP3+ Tregs in the endometrium? (ii) Are there differences between the expression levels of HLA-F and sHLA-G in the endometrium between a RIF group and a first-time IVF control group? (iii) Are previously reported specific HLA-F/HLA-G polymorphisms and haplotypes associated with differences in HLA-F or sHLA-G expression in the endometrium? (iv) Are the specific HLA-F/HLA-G gene polymorphisms and haplotypes associated with differences in the numbers of uNK cells, M2 macrophages or FOXP3+ Tregs in the endometrium? (v) Is endometrial HLA-F expression higher in the receptive phase compared with the pre-receptive phase of the menstrual cycle?
Materials and methods
Study group and sample processing
Between November 2017 and September 2019, 122 women were recruited in a prospective cohort study at the Fertility Clinic, Dept. of Obstetrics and Gynaecology, Zealand University Hospital, Denmark. One woman was excluded from the study because of insufficient tissue for all immunohistochemical analyses. The remaining 121 women constituted two groups: 85 women experiencing RIF and 36 women attending their first IVF treatment (control group). Recurrent implantation failure was defined as no implantation after at least three consecutive fresh or frozen transfers of embryos of good quality. A good quality embryo was defined as a blastocyst of at least Gardner score 6AB or better, or a day-2 embryo of at least 4c2b. The use of preimplantation genetic testing for aneuploidy (PGT-A) to test for euploid embryos was not possible due to Danish legislation. Therefore, it was only possible to include an embryo morphology score. The control women had no history of RIF or previous fertility treatment. Inclusion criteria for the control women were regular menstrual cycle (21–35 days) and no history or current clinical signs of endometriosis. All women were between 24 and 40 years old (n = 121; mean = 32.7, SD ±4.1), and their body mass index (BMI) in the range from 17.7 to 37.7 kg/m2 (n = 117, mean = 24.9; SD ± 3.8). The women with RIF (n = 85) were divided into four groups based on the diagnosis of infertility: unknown cause (n = 37), female infertility (n = 20), male infertility (n = 18), and both male and female infertility (n = 10). For detailed information see Table I. The majority of women included in the study were Caucasians (n = 112) along with Asian (n = 8) and African (n = 1) women. According to the Endometrial Receptivity Array test (ERA™, Igenomix, Spain), the women were distributed in the following phases: 33 women were in the pre-receptive phase (7 controls, 26 women with RIF), 13 in the early receptive phase (6 controls, 7 women with RIF), 65 in the receptive phase (22 controls, 43 women with RIF), 6 in late receptive phase (one control, 5 women with RIF) and 3 in the post-receptive phase (3 women with RIF). For one woman with RIF, ERA results are missing due to insufficient sample material.
Basic data of the study groups.
| Study groups | All | Recurrent implantation failure (RIF) | Controls | |||||
|---|---|---|---|---|---|---|---|---|
| All RIF | Female infertility | No female infertility | IVF control groupe | |||||
| Female infertility diagnosis | Both female and male infertility diagnosis | Unknown diagnosis | Male infertility diagnosis | |||||
| (n = 121) | (n = 85) | (n = 20) | (n = 10) | (n = 37) | (n = 18) | (n = 36) | ||
| BMI (kg/m2) | Mean (SD) | 24.9a (±3.8) | 24.6b (±3.8) | 24.9 (±4.3) | 26.2 (±2.9) | 24.1c (±3.9) | 24.7d (±3.1) | 24.1 (±5.5) |
| Age (years) | Mean (SD) | 32.7 (±4.1) | 33.8 (±3.9) | 33.4 (±4.4) | 34.1 (±3.8) | 34.6 (±3.8) | 32.5 (±3.2) | 30.2 (±3.5) |
n = 117.
n = 81.
n = 35.
n = 16.
The control group consisted of women with a partner diagnosed with male infertility (n = 25, one of the women was diagnosed both with male infertility and unilateral tubal occlusion), bilateral tubal occlusion (n = 2), single women (n = 6) or women with a female partner (n = 3).
All participants underwent timed endometrial biopsy in the luteal phase of a hormone-substituted cycle with estradiol 6 mg daily (Estrofem, Novo Nordisk, Denmark) during 17–19 days, adding progesterone 180 mg daily (Crinone, Merck, Denmark) for the last five full days. The biopsy was performed on the morning of the sixth day 1–3 h after the morning dose of estradiol and progesterone. Sampling was performed with a Uterine Explora curette (CooperSurgical, CT, USA). Immediately after collection, the biopsies were fixated in 10% (v/v) neutral-buffered formalin and sent for pathological examination. All samples were paraffin-embedded within 24–72 h and sectioned in 4 μm slices before nuclear staining with haematoxylin and 3.3′-diaminobenzidine. Peripheral blood was collected into EDTA and plasma tubes and stored at −80°C. The study was approved by the local ethics committee of Region Zealand and the local data protection National Committee on Health Research Ethics (REG-227-2017). The study was carried out in accordance with the ethical standard of the Helsinki declaration and approved by Institutional Review Board.
Endometrial stromal cell isolation and culture
For the establishment of the endometrial stromal cell (ESC) cultures endometrial biopsies were collected from women attending the Fertility Clinic (n = 5). The isolation protocol was adapted from Michalski et al. (2018), and performed in a biological safety cabinet. The biopsies were washed in DMEM/F12 (Gibco) with 0.1% (v/v) pen/strep and digested for 90 min (min) at 37°C in 0.25% collagenase (w/v)/0.05% DNase I (w/v) (both from Sigma). The digested tissue was filtered through a 40 µm cell strainer to remove epithelial cells and tissue debris, washed and resuspended in DMEM/F12 with 1% pen/strep and 10% foetal bovine serum (Sigma). The cells were layered on Ficoll (density 1.077 g/ml) (GE Healthcare) for density gradient centrifugation (30 min, 400 g). Afterward, cells were collected from the interface and washed. The median yield of the cells per biopsy was 3.75×10⁵ cells. The cells were stored in liquid nitrogen. After thawing, the endometrial stromal cells were plated into a 24-well plate (Costar) in DMEM/F12, 1% pen/strep, 10% FBS and cultured in 5% CO2 at 37°C. Media were changed every second day. The cells were trypsinized (0.25% Trypsin-EDTA, Gibco) when 90–100% confluent and directly stained for flow cytometry analysis or plated for further experiments.
Flow cytometry
Endometrial stromal cells were stained for 30 min with fixable viability stain BV510 (BD Biosciences) and subsequently for 15 min with anti-CD90, anti-HLA-G, anti-CD45, anti-HLA-E, anti-HLA-F, anti-HLA-A,-B,-C and corresponding isotypes. For further information on antibody dilutions, isotypes and gating strategy see Supplementary Table SI and Fig. S1. Flow cytometry was performed on a FACSCanto™ II (BD Biosciences) and data analysed with FACSDiva™ and FlowJO, LCC software.
Western blot and analysis of plasma progesterone, sHLA-G and endometrial receptivity
ESCs and JEG3 cells were lysed using RIPA buffer (Thermo Fisher) with Halt Protease Inhibitor Cocktail (10 μl/ml, Sigma). Afterward, 4× Bolt™ Reducing LDS buffer with 10× Reducing agent (both Thermo Fisher) to a total volume of 40 μl was added. Samples were heated for 10 min at 75°C. The samples, together with PageRuler™ and SuperSignal™ (both Thermo Fisher) were loaded into Bolt™ 4–12% Bis–Tris Plus gel (Thermo Fisher) in MES SDS Running Buffer (Thermo Fisher) and gels were run 22 min at 200 V. The samples were blotted onto iBlot Gel Transfer Stacks, PVDF using iBlot™ device (both Thermo Fisher) at 20 V for 1 min, 24 V for 3 min and 25 V for 2 min. The PVDF membrane was blocked for 1–2 h in 5% milk/PBST and then incubated with primary antibody (Purified anti-HLA-G, MEM-G/1, ExBio 1:100; Purified anti-HLA-F, 3D11, ExBio 1:100 and control Anti-αActinin, Abcam, 1:1000) in 1% milk/PBST overnight at room temperature. Next, the membranes were washed and stained with secondary antibody (Goat anti-mouse HRP, Thermo Fisher 1:10 000) in 1% milk/PBST for 2 h at room temperature. The PVDF membranes were washed three times and developed with the use of SuperSignal™ West Pico PLUS Chemiluminescent substrate (Thermo Fisher) for 5 min. The detection was performed by LAS-4000 (ImageQuant). For further information regarding antibodies see Supplementary Table SI. Plasma progesterone was measured using Dimension Vista® Systems (Siemens Healthcare Diagnostic Inc., Neware, USA) and the LOCI progesterone assay (REF K6464). Soluble HLA-G1/HLA-G5 was measured in supernatants from the ECS cultures in a sHLA-G ELISA (BioVendor) on a BEP2000 Advance instrument (Siemens). Each endometrial biopsy was examined by microscopy according to modified Noyes’ criteria. A second endometrial biopsy from each woman was sent for endometrial receptivity array (ERA®) testing (Igenomix Valencia, Spain).
Immunohistochemical staining, development of algorithms and data analyses
The immunohistochemical methods have been described previously (Kofod et al., 2017; Hallager et al., 2021). The immunohistochemical staining was automatically performed in a Dako Omnis instrument (Agilent Technologies) at room temperature, ensuring low variability and high reproducibility. For visualization, EnVision™ FLEX+Mouse (LINKER) or EnVision™ FLEX+Rabbit (LINKER) were used. The immunolabelling was performed on paraffin-embedded sections for the markers described below using specific antibodies with details listed in Supplementary Table SI and with corresponding technical controls. Tissue for positive controls was attached to each slide. These technical controls comprised tissue microarrays, harbouring different levels of antigen densities related to specific cell types including tissue that should be positive as well as negative. Finally, negative antibody isotype control immunohistochemical stainings were performed. Each section was scanned at 20× magnification in a Leica SCN400 slide scanner. The scanning files were uploaded into Digital Image Hub (Leica Biosystems, Germany) for further analysis. The analysis was performed using Tissue IA image analysis software. The quantification based on digital image analysis was handled by one observer (H.P. for HLA-F and sHLA-G; T.H. for CD56, CD16 and CD163; J.O.E. for FOXP3) and the counting method was confirmed by two other observers (T.V.F.H. and L.G.L.). All the observers were blinded towards the patient’s information. Every section was viewed and studied by several investigators including an experienced pathologist. Algorithms were developed for each of the antibodies against HLA-F, sHLA-G and FOXP3. A common algorithm for CD56, CD16 and CD163 were designed. All algorithms were designed, tested and adjusted by J.O.E. in an iterative process until optimal results were obtained. The algorithms were based on nuclei (blue hematoxylin) and protein (brown 3.3′-diaminobenzidine) immunostaining. The software algorithm was used at 20× objective and the immunostained cells were scored as positive only if a nucleus was identified. For the evaluation of HLA-F and sHLA-G expression in glands, five non-overlapping areas of approximately 62 500 μm2 were randomly analysed in each section using Microsoft Excel function ‘RANDBETWEEN’. Moreover, for the evaluation of HLA-F expression in the stroma, five non-overlapping areas were analysed as described above. The results were presented as the number of positive cells per mm2 and an average H-score, which is a semiquantitative measure based on the staining intensity, ranging from 0 to 300 (H-score=(3×% of cells with strong membrane staining)+(2×% of cells with moderate membrane staining)+(% of cells with weak membrane staining)). HLA-F H-score for glands was excluded from the correlation analysis as the majority of the samples yielded an H-score of zero. Immunohistochemical staining of CD56, CD16 and CD163 was quantified with digital image analysis in systematically selected areas of the endometrial stroma. Due to low density of cells with FOXP3 expression one or two large areas including glands were selected. The endometrial biopsies were examined for signs of inflammation by immunostaining for CD138+ plasma cells. The CD138+ plasma cells were identified by a strongly stained brown cell membrane or cytoplasm, a displayed nucleus with a ‘fried egg’ appearance.
DNA sequencing of HLA-F and HLA-G gene polymorphisms
Extraction of genomic DNA from peripheral blood was performed with QIASymphony® DNA mini Kit (QIAGEN) following the manufacturer’s instruction and stored at −20°C. HLA-F including rs2523393, rs2523405 and rs1362126 and HLA-G genotyping including the 5′-upstream regulatory region (5′-URR) promoter, the 3′-untranslated region (3′-UTR) and the 14-bp HLA-G insertion/deletion genotype (rs66554220) were performed by PCR amplification and DNA Sanger sequencing or TaqMan analysis. All PCR primers, probes and Sanger sequencing primers (TAG Copenhagen A/S, Copenhagen, Denmark) are listed in Supplementary Table SII and all PCR protocols are shown in Supplementary Table SIII. The procedure for HLA-F has been published (Langkilde et al., 2020). Sanger sequencing was performed using the BigDye™ Terminator v3.1 Cycle Sequencing Kit (Applied Biosystems, Waltham, MA, USA) in reverse direction using M13 primer on an ABI3500 Genetic Analyzer (Applied Biosystems). The sequencing reaction program is outlined in Supplementary Table SIII. The procedure for HLA-G genotyping has been published previously (Nilsson et al., 2016). To determine the 14-bp HLA-G ins/del genotype (rs66554220) a previous published end-point real-time PCR assay was used (Djurisic et al., 2012). The TaqMan PCR assay was performed using a LightCycler480 instrument (Roche Diagnostics A/S). The analysis of DNA sequencing data was performed with Mutation Surveyor (Soft Genetics). To determine haplotypes and subsequently diplotypes, PHASE v2.1.1 was used (Stephens and Donnelly, 2003). The PHASE algorithm was run 5 times with the use of the recombination model and case–control permutation test.
Statistical analyses
Specific a priori hypotheses for the NK cell variables were clearly formulated based on previous findings (Djurisic et al., 2015; Tilburgs et al., 2015; Kofod et al., 2017; Mika et al., 2018; Lin and Yan, 2019; Persson et al., 2020). The effect of progesterone on HLA-F expression has been demonstrated (Mika et al., 2018). Each variable was tested for normal (Gaussian) distribution. In case of paranormal distribution Spearman’s correlation was performed. The difference between Spearman’s rho coefficients was determined using vassarstat.net/rdiff. Bonferroni correction was applied to adjust for multiple comparison in the study parts related to correlation analyses. To show differences between two independent groups the non-parametric Mann–Whitney U test and for more than two unpaired groups the non-parametric Kruskal–Wallis test with Dunn’s multiple comparisons test were used. For standard linear multiple regression analysis, the variables were transformed to logarithmic scale to ensure no violation of the assumptions for multicollinearity, normality, linearity and homoscedasticity. For the evaluation of binary logistic regression models the Omnibus tests for model coefficients were used. All genotypes were tested for deviations from Hardy–Weinberg equilibrium using χ2 tests. For the HLA-F and HLA-G gene polymorphism analyses, the χ2 test or Fisher’s exact test, and Kruskal–Wallis test with Dunn’s multiple comparison test, were used where appropriate. To determine differences among more than two paired groups, the data were transformed to logarithmic scale to provide normal distributions, and a two-way ANOVA with Tukey’s or Sidak’s multiple comparisons test was performed. Specific a priori hypotheses for differences in endometrial expression of either HLA-F or HLA-G according to specific HLA-F/HLA-G genotypes/haplotypes were formulated based on previous findings (Burrows et al., 2016; Meuleman et al., 2018; Mika et al., 2018; Langkilde et al., 2020; Nilsson et al., 2020). Statistical analyses and data visualization were made in SPSS (ver 26, IBM) and GraphPad Prism (ver 9, San Diego, CA, USA) software.
Results
HLA-F protein is expressed in the endometrium
The protein expression on ESCs of HLA-ABC, HLA-F and HLA-G was determined by flow cytometry (Fig. 1A). For HLA-G two different isotype antibodies were included in the antibody panel (three samples with IgG1 PE from BD Biosciences and two samples with IgG1 PE from Exbio, both clone MOPC-21, Supplementary Table SI). The results were inconclusive for HLA-E, and HLA-E was not investigated further. The HLA-F protein expression by ESCs was confirmed by western blot (Fig. 1B). However, no clear HLA-G protein expression was observed in the western-blot analyses. A very faint band could be observed in replicate experiments, but it did not provide a conclusive result. This absent or very low HLA-G protein expression of ESCs is possibly due to low HLA-G expression in the stromal part of the endometrium. As positive control, HLA-G expression was confirmed in the trophoblast surrogate choriocarcinoma cell line JEG-3 by western blot (Fig. 1B); however, HLA-F expression by JEG-3 was not observed (Fig. 1B). Furthermore, there were no measurable sHLA-G levels in the supernatant of ESC cultures. However, intense staining of soluble HLA-G in the endometrial glands was observed by immunohistochemistry (see below and Fig. 2). The anti-HLA-G antibody used for immunohistochemistry (clone 5A6G7) selectively detects the two soluble HLA-G5 and -G6 isoforms (but not shedded HLA-G1), and has been validated previously (Larsen et al., 2011). In conclusion, based on the flow cytometry, western blot and immunohistochemistry data, the endometrial stromal cells express HLA-F protein on the cell surface and the endometrial glands express HLA-F protein and sHLA-G protein.
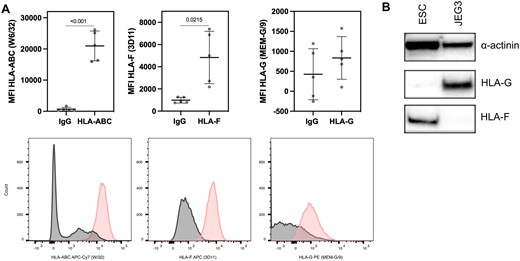
HLA class I expression profiles on primary endometrial stromal cells based on flow cytometry analysis. (A) The expression of the HLA class I molecules is shown in a CD45−CD90+ population. The plots depict Mean Fluorescence Intensity (MFI) of HLA-ABC (HLA class Ia), HLA-F and HLA-G. The data are shown as mean±SD (paired t-test). Below, histograms of HLA-ABC, HLA-F and HLA-G staining within the CD45−CD90+ selection (pink). (B) Western blot of HLA-F (42 kDa) and HLA-G (45 kDa) on endometrial stromal cells (ESC) and on the choriocarcinoma cell line JEG3 (JEG3). α-Actinin (110 kDa) serves as loading control.
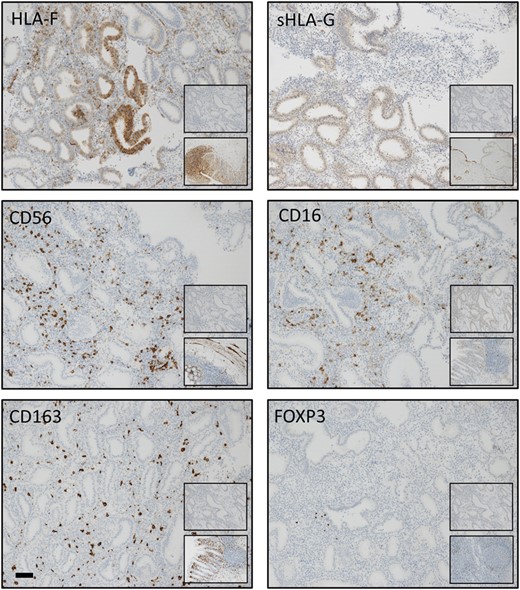
Immunohistochemical staining patterns of HLA-F, sHLA-G, CD56, CD16, CD163 and FOXP3 in the endometrium. The staining was assessed as moderate for all markers. Bar: 100 μm. Upper inserts show negative isotype control staining: HLA-F: rabbit mAb IgG; sHLA-G: mouse mAb IgG1; CD56: rabbit mAb IgG; CD16: mouse mAb IgG2a; CD163: mouse IgG1; and FOXP3: mouse mAb IgG1. Bottom inserts show controls at ×10 magnification: HLA-F: colon; sHLA-G: placenta; CD56, CD16 and CD163: colon; and FOXP3: lymph nodes. (Mean tissue areas analysed were in the range 0.13 mm2 ±0.013 mm2 (HLA-F, glands) to 11.60 mm2 ±8.25 mm2 (FOXP3+) (n = 121)).
Endometrial HLA-F is positively correlated with anti-inflammatory macrophage infiltration
Positive and negative tissue controls performed as tissue microarrays, representative endometrial staining and negative isotype control staining are all shown in Fig. 2. Glandular endometrial HLA-F expression was strongly positively correlated with endometrial HLA-F expression in the stroma (Fig. 3A). Correlation between HLA-F expression and sHLA-G expression in the endometrial glands did not reach statistical significance after correction (Spearman’s rho = 0.191, P = 0.035, Pc=0.175 ns for number of positive cells, and Spearman’s rho = 0.221, P = 0.015, Pc=0.075 ns for H-score; not shown). However, a strong positive correlation between CD163+ M2 macrophages and CD56+ uNK cells was observed (Fig. 3B). A strong positive correlation between endometrial HLA-F and CD163+ anti-inflammatory macrophages was discovered in the whole cohort analysis (n = 121, Fig. 3C) and also confirmed for the RIF group (Spearman’s rho = 0.381, P < 0.001, Pc=0.002 for number of positive cells, and Spearman’s rho = 0.372 P < 0.001, Pc=0.003 for H-score) and the no female infertility subgroup (Spearman’s rho = 0.455, P < 0.001, Pc=0.003 for number of positive cells, and Spearman’s rho = 0.438, P < 0.001, Pc=0.005 for H-score). Moreover, a trend for a positive correlation between endometrial HLA-F and CD16+ cells was observed (Spearman’s rho = 0.181, P = 0.047, Pc=0.235 for number of positive cells, and Spearman’s rho = 0.194 P = 0.033, Pc=0.165 for H-score) along with a negative correlation between endometrial HLA-F and FOXP3+ Tregs (Spearman’s rho = −0.214, P = 0.018, Pc=0.09 for number of positive cells, and Spearman’s rho = −0.196, P = 0.031, Pc=0.155 ns for H-score) in the whole cohort analysis (n = 121). However, these correlations became non-significant after correction. Standard linear multiple regression analysis to assess whether HLA-F H-score in the endometrial stroma, sHLA-G H-score in the endometrial glands, plasma progesterone and the classification of RIF/control group could predict the levels of CD163+ M2 macrophages showed a total variance controlled by the model of 13.8% (F (4,109)=4.363, P = 0.003). The HLA-F H-score (beta = 0.328, P < 0.001) and plasma progesterone levels (beta = 0.203, P = 0.027) were statistically significant in the prediction of macrophage cell numbers.
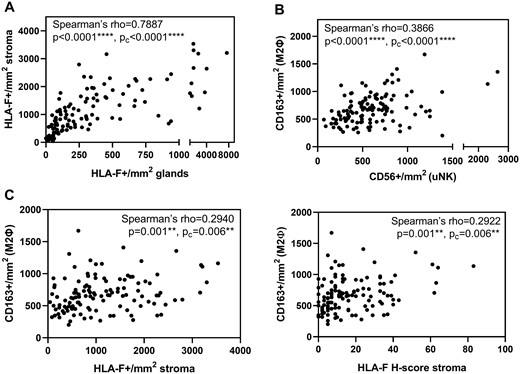
Basic correlations in the endometrium and correlation of endometrial HLA-F with anti-inflammatory macrophages. The figure shows plots of the whole cohort (n = 121). (A) HLA-F expression in the endometrial glands is positively correlated with HLA-F expression in the endometrial stroma. (B) CD56+ uNK cells are positively correlated with CD163+ anti-inflammatory macrophages. (Spearman’s correlation; pc-values were adjusted by Bonferroni’s correction for multiple comparison). (C) The HLA-F expression in the endometrial stroma is positively correlated with the amount of anti-inflammatory M2 macrophages identified as CD163+ cells. (Spearman’s correlation; Pc-values were adjusted by Bonferroni’s correction for multiple comparison.).
Differential HLA-F and sHLA-G expression between RIF and the IVF control group
The entire group of women experiencing RIF showed higher levels of both HLA-F in the stroma (P = 0.02 for HLA-F per mm2, P = 0.025 for H-score) (Fig. 4A) and in the glands (P = 0.02, P = 0.03) (Fig. 4B), respectively, and sHLA-G in the glands (P = 0.0015, P = 0.0017) (Fig. 4C), than the IVF control group. No significant differences in HLA-F expression were observed between the group with female infertility and the group without female infertility nor the different diagnosis groups. The female infertility subgroup showed significantly higher sHLA-G expression in the endometrial glands compared with no female infertility subgroup while analysing the whole cohort (n = 121; Fig. 4D). However, these differences seemed to be driven by high level of HLA-F and sHLA-G expression in the RIF endometrial biopsies that were not in the receptive phase. When only samples in the receptive phase from the RIF and the control group, respectively, were compared, only sHLA-G expression in the glands remained significant (P = 0.014 and P = 0.015). Based on a definition of chronic endometritis as three or more CD138+ plasma cells per section (Liu et al., 2018), a higher prevalence of chronic endometritis in the endometrial biopsies from women experiencing RIF than in the control IVF group was observed (24% versus 6%, respectively). However, there was no specific correlation between CD138+ cells per mm2 and HLA-F expression, or sHLA-G expression, in the RIF group. Furthermore, there were no differences in HLA-F or sHLA-G expression between women with chronic endometritis and women without in the RIF group based on the presence of CD138+ plasma cells (data not shown).
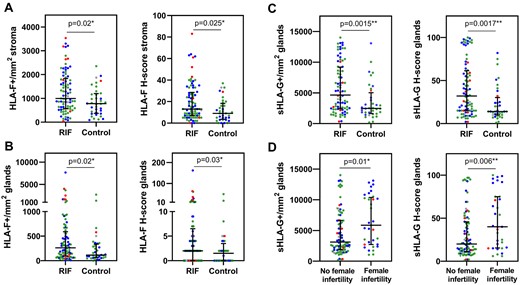
Women experiencing recurrent implantation failure (RIF) express higher levels of HLA-F in the endometrial stroma and higher levels of both HLA-F and sHLA-G in the endometrial glands than women in the control group. (A) HLA-F expression in the endometrial stroma, (B) HLA-F expression in the endometrial glands and (C) sHLA-G expression in the endometrial glands. (Women with RIF: n = 85, and IVF controls: n = 36. The data are presented as median with interquartile range; Mann–Whitney U test). (D) Impact of female infertility on glandular sHLA-G expression. The female factor subgroup shows higher sHLA-G expression compared with the no female factor subgroup. The sHLA-G expression in the endometrial glands of women with female infertility is significantly higher than in women without female infertility diagnosis (whole cohort, n = 121; median with interquartile range; Mann–Whitney U test). However, when only samples in the receptive phase from the RIF and the control group, respectively, are compared only sHLA-G expression in the glands remain significant (P = 0.014 and P = 0.015). (Colours according to the ERA test result: blue=prereceptive/early receptive; green=receptive; red=late receptive/post-receptive; grey=no test result).
A binary logistic regression model to assess the predictive value of HLA-F and sHLA-G H-score containing 6 independent variables (HLA-F H-score, sHLA-G H-score, CD56+/mm2, CD163+/mm2, FOXP3+/mm2 and plasma progesterone) was statistically significant (χ2 (2, n = 121)=21.2, P = 0.002), and able to distinguish between controls and women with RIF. Only HLA-F and sHLA-G H-score made a significant contribution to the model (Wald’s χ2=3.955, B = 0.037, P = 0.047, and Wald’s χ2=6.666, B = 0.025, P = 0.01, respectively). Multiple linear regression analyses assessed whether plasma progesterone, CD56+, CD163+ and FOXP3+ cells and RIF/control group could predict the levels of HLA-F H-score in the endometrial stroma or sHLA-G H-score in the endometrial glands. The total variance controlled by the HLA-F H-score model was 18% (F (5,108)=2.513, P < 0.001) and only CD163+ M2 macrophages were statistically significant (beta = 0.210, P = 0.003). In the multiple linear regression analysis for sHLA-G expression, the total variance was 10% (F (5,115)=2.536, P = 0.032), and the classification of the RIF and the control group was statistically significant (beta = 0.256, P = 0.006).
Correlations of HLA-F and sHLA-G with uNK cells
HLA-F in endometrial stroma showed a positive significant correlation with CD56+ uNK cells in the whole cohort (n = 121; Fig. 5A), in the no female infertility group (n = 55, Spearman’s rho = 0.3112, P = 0.02 for number of positive cells, and Spearman’s rho = 0.2985, P = 0.03 for H-score) and in the male infertility diagnosis subgroup (n = 18, Spearman’s rho = 0.5088, P = 0.03 for number of positive cells and Spearman’s rho = 0.4741, P = 0.047 for H-score). The female infertility group (n = 30) as well as the female infertility diagnosis group (n = 20) and both female and male infertility diagnosis group (n = 10) showed a negative correlation trend (ns). Correlation analyses in female infertility and no female infertility subgroups showed a positive correlation of sHLA-G with uNK cells in the no female infertility group (n = 55; Fig. 5B), while a negative trend in the female infertility group was observed. Moreover, the diagnosis-based analysis showed a significant negative correlation of sHLA-G in the glands with CD56+ uNK cells in the female infertility diagnosis group (n = 20; Fig. 5C), while the three remaining groups showed a positive but non-significant trend. A standard linear multiple regression analysis to assess whether HLA-F H-score in the endometrial stroma, sHLA-G H-score in the endometrial glands, plasma progesterone and the classification of RIF/control group could predict the levels of CD56+ uNK cells showed a total variance controlled by the model of 8.4% (F (4,109)=2.513, P = 0.046). Only HLA-F H-score was statistically significant in the prediction of CD56+ uNK levels (beta = 0.218, P = 0.022).
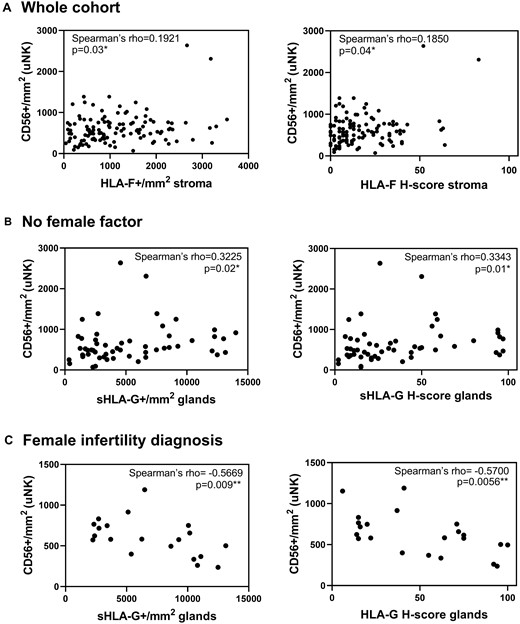
Correlations of uNK cells with HLA-F and sHLA-G. (A) HLA-F expression in the endometrial stroma is positively correlated with CD56+ uNK cells in an analysis of the whole cohort (n = 121). Furthermore, (B) sHLA-G endometrial expression in glands is positively correlated with the amount of CD56+ uNK cells in the no female infertility subgroup (n = 55) and (C) negatively correlated in the female infertility diagnosis (n = 20) (Spearman’s correlation).
Endometrial HLA-F is negatively correlated with infiltrating Tregs in women experiencing RIF but not in the IVF control group
A negative correlation between HLA-F in the endometrial stroma and FOXP3+ Tregs was detected in women experiencing RIF. This negative correlation was not seen in the IVF control group, where a positive trend could be observed. A significant difference between the Spearman’s rho coefficients for the IVF control group and the RIF group was detected (Fig. 6).
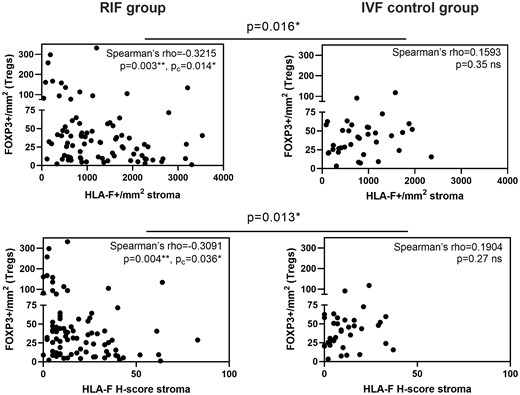
Endometrial HLA-F in the stroma is negatively correlated with infiltrating Tregs in women experiencing RIF. (A) Scatter plots of HLA-F expression in the endometrial stroma show a negative correlation with infiltrating Tregs identified as FOXP3+ cells in the RIF group (n = 85). (B) Scatter plots of endometrial HLA-F having a positive trend for a correlation with FOXP3+ Tregs in the IVF control group (n = 36). The significant differences between correlation coefficients of the RIF and IVF control group are shown above the graphs. (Spearman’s correlation; Pc-values were adjusted by Bonferroni’s correction for multiple comparison. The difference between Spearman’s rho coefficients was determined using vassarstat.net/rdiff.).
Endometrial HLA-F is negatively correlated with plasma progesterone in women with female infertility
HLA-F expression in the endometrial stroma was negatively correlated with plasma progesterone in women with female infertility (n = 55; Fig. 7A) and in women with both female and male infertility diagnoses (n = 10; Fig. 7B, left). A positive HLA-F expression and plasma progesterone correlation was observed in the male infertility diagnosis (n = 18; Fig. 7B, right) and a positive trend was observed in the no female infertility subgroup (n = 30, ns).
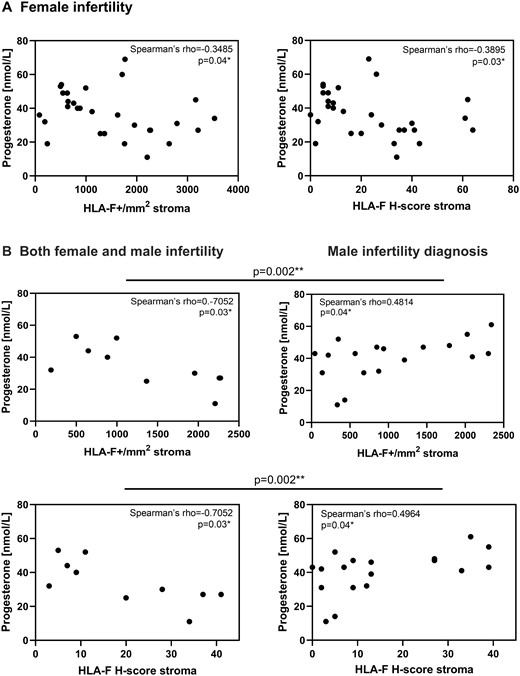
Endometrial HLA-F is negatively correlated with plasma progesterone in women with female infertility. (A) Endometrial HLA-F+ cells and the HLA-F H-score in the stroma are negatively correlated with plasma progesterone levels in all women with female infertility (n = 30). (B) The same is observed for the women in couples with both female and male infertility (n = 10). However, in the male infertility group a positive correlation between both HLA-F+ cells and HLA-F H-score in the stroma, respectively, and plasma progesterone is observed (n = 18). (Spearman’s correlation; the difference between Spearman’s rho coefficients was determined using vassarstat.net/rdiff.).
Endometrial receptivity and HLA-F expression
Transcriptome analysis-based ERA™ test revealed that HLA-F expression and HLA-F H-score in the stroma showed an increasing trend from pre-receptive to receptive phase in the control group (n = 35, P = 0.031, P = 0.029, respectively; Jonckheere–Terpstra test), corresponding with the menstrual cycle (Supplementary Fig. S2). This trend was not observed in the RIF group (n = 76, P = 0.135, P = 0.166, respectively). The late receptive and post-receptive phases were excluded from the analyses due to very low numbers. In a standard linear multiple regression to assess whether the endometrial receptivity phase could predict the levels of HLA-F H-score in the stroma in the control group the total variance controlled by the model was 13.7% (F (1,29)=4.559, P = 0.041). Endometrial receptivity was statistically significant in the prediction of HLA-F H-score in the stroma (beta = 0.370, P = 0.041) in the control group. The predictive value of endometrial receptivity phase for the number of HLA-F-positive cells per mm2 was not statistically significant. Conversely, a standard linear multiple regression to assess whether HLA-F H-score was predictive of endometrial receptivity in the RIF group was not significant.
Endometrial HLA-F protein expression is influenced by HLA-F gene polymorphisms
All HLA-F SNPs were in Hardy–Weinberg equilibrium. Standard linear multiple regression was performed to assess whether the three examined SNP genotypes could predict the levels of HLA-F-positive cells in the endometrial stroma. The total variance controlled by this model was 8.5%, F (4,114)=2.636, P = 0.038. Only rs1362126 was statistically significant in the endometrial HLA-F expression prediction (beta = 0.729, P = 0.020). A similar result was obtained for a model predicting endometrial HLA-F H-score. Standard linear multiple regression was performed to assess, whether HLA-F diplotype and plasma progesterone could predict the levels of HLA-F-positive cells in the endometrial stroma, and the total variance was 6.6% (F (2,116)=4.066, P = 0.020). Only HLA-F diplotype was statistically significant in the endometrial HLA-F prediction (beta = 0.231, P = 0.011). Standard linear multiple regression was performed to assess, whether HLA-F diplotype and plasma progesterone could predict the levels of HLA-F H-score in the endometrial stroma. The total variance controlled by this model was 7.0% (F (2,109)=4.120, P = 0.019). Only HLA-F diplotype was statistically significant (beta = 0.246, P = 0.009). HLA-F rs1362126 showed significantly higher HLA-F expression and H-score in both endometrial stroma and glands for the GG genotype compared with heterozygous GA genotype (Fig. 8A). HLA-F rs2523405 showed a significantly higher HLA-F expression and H-score in the endometrial stroma for the TT genotype compared with the heterozygous TG genotype (Fig. 8B). Lastly, HLA-F rs2523393 showed a significantly higher HLA-F H-score in endometrial glands for the AA genotype compared with the heterozygous AG genotype (Fig. 8C). In an analysis of the three most common diplotypes representing 82% of the women in the whole cohort, the GTA/GTA diplotype showed significantly higher HLA-F levels in the stroma compared with the AGG/GTA diplotype (Fig. 8D). Subsequent analyses of HLA-F genotypes and diplotypes with regards to the RIF and IVF control groups confirmed previous findings of higher endometrial HLA-F expression and H-score in women with RIF compared with the IVF control group (Supplementary Fig. S3). All HLA-G SNPs were in Hardy–Weinberg equilibrium. The HLA-G 3′-UTR 14-bp ins/del was in Hardy–Weinberg equilibrium only for the IVF control group, but not for the RIF group. There was no significant difference in the distribution of insertion or deletion between the IVF control group and the RIF group; however, a significant difference in the group factor was found when evaluating the ins/del genotype with sHLA-G expression in between the IVF control group and RIF group (Supplementary Fig. S4). The HLA-G 5′ promoter haplotypes and 3′-UTR haplotypes were determined as described previously (Castelli et al., 2011; Nilsson et al., 2016). The promoter haplotypes were grouped into four main groups: PROMO-G010101, PROMO-G010102, PROMO-G0103 and PROMO-G010104. Similarly, in the 3′-UTR analysis, UTR-6b and UTR-18 were grouped. Standard linear multiple regression was performed to assess, whether the three most common HLA-G promoter diplotypes and five most common HLA-G 3′-UTR diplotypes could predict sHLA-G expression. Neither of these models reached statistical significance. Furthermore, no significant differences were observed in sHLA-G expression between the different genotypes or promoters.

HLA-F single-nucleotide polymorphisms (SNPs) influence HLA-F expression in the endometrium. (A) The HLA-F rs1362126 GG genotype exhibits significantly higher number of HLA-F-positive cells in the endometrial stroma and H-score in both endometrial stroma and glands than the GA genotype. (B) The HLA-F rs2523405 TT genotype exhibits significantly higher number of HLA-F-positive cells and H-score in the endometrial stroma than the TG genotype. (C) The HLA-F rs2523393 AA genotype exhibits significantly higher H-score in the endometrial glands than the AG genotype. (D) The GTA/GTA HLA-F diplotype shows significantly higher number of HLA-F-positive cells and H-score in the endometrial stroma than the AGG/GTA HLA-F diplotype (n = 119; data are presented as median with interquartile range; Kruskal–Wallis test with Dunn’s multiple comparison; colours according to the ERA test result: blue=prereceptive/early receptive; green=receptive; red=late receptive/post-receptive; grey=no test result).
Discussion
Low polymorphic HLA class Ib molecules show tissue-specific expression with a primary role in immunosuppression and immune regulation, in contrast to the highly polymorphic classical HLA class Ia gene family members, which are widely expressed and with a primary role in antigen presentation and immune system activation (Hviid, 2006; Apps et al., 2009; Wieczorek et al., 2017). The immunoregulatory role of HLA-G in the placenta and in other immune-privileged sites has been extensively studied. HLA-G is known to interact via ILT2 with multiple cell types, with ILT4 on dendritic cells and monocytes, and possibly also with inhibitory KIR2DL4 expressed on NK cells (Rajagopalan and Long, 1999; Parham, 2004; LeMaoult et al., 2005; Ferreira et al., 2017; Persson et al., 2017). HLA-G gene polymorphism and low expression of HLA-G and its soluble isoforms have been linked with pregnancy complications and unsuccessful IVF treatment (Fuzzi et al., 2002; Hviid et al., 2004; Rizzo et al., 2009; Keskin et al., 2013; Kofod et al., 2017). Only little is known regarding the function of HLA-F (Geraghty et al., 1990; Burrows et al., 2016; Dulberger et al., 2017; Kofod et al., 2017). HLA-F is known to interact with ILT2, ILT4 and a number of KIRs (Lepin et al., 2000; Dulberger et al., 2017), and HLA-F gene locus polymorphisms have recently been linked with time-to-pregnancy (Burrows et al., 2016; Mika et al., 2018; Langkilde et al., 2020).
In the present study, we detected HLA-F protein expression on isolated endometrial stromal cells from endometrial biopsies. Furthermore, the expression of HLA-F protein was confirmed by western blot. The immunohistochemistry staining results showed HLA-F expression in both the stromal part and in the glandular part of the endometrium, as previously described (Kofod et al., 2017). It was not possible to make a conclusion regarding HLA-G protein expression by endometrial stromal cells based on the results from the current study. Based on immunohistochemistry, western blot and flow cytometry, we propose that HLA-G is mainly expressed in the surface epithelium and only weakly in the stromal endometrium. Soluble HLA-G was detected in the endometrial glands by immunohistochemistry in the present study, which corresponds to the findings in our previous study (Kofod et al., 2017). In conclusion, HLA-F is mainly found in the stromal part of the endometrium, while sHLA-G is found in the endometrial glands, and therefore, the importance of endometrial stromal-epithelial crosstalk could be interesting to examine further (Pierro et al., 2001; Field et al., 2015).
Examinations of the HLA-F expression in the IVF control group and the RIF group using the ERA™ test revealed that HLA-F expression in the stroma had an increasing trend from the pre-receptive to the receptive phase in the IVF control group. However, this was not observed for the RIF group. This finding corresponds with a higher HLA-F mRNA level in the secretory phase than in the proliferative phase of the menstrual cycle as reported previously (Mika et al., 2018). Interestingly, we observed a significant positive correlation between plasma progesterone concentrations and HLA-F expression in the endometrium in the RIF subgroup with male infertility, where the female partners have no known causes of reduced fertility. On the contrary, high levels of plasma progesterone correlated with low endometrial HLA-F expression in the female infertility diagnosis and in both male and female infertility diagnosis groups. Based on these observations, we propose that there might be progesterone unresponsiveness or resistance in some women experiencing RIF. Progesterone is responsible for endometrial decidualization, which is essential for embryo attachment, implantation, and successful pregnancy and thus improper decidualization may be one of the causes for implantation failure (Kim et al., 2015; Ng et al., 2020). However, it is important to be aware of that in a natural menstrual cycle there is a correlation between plasma progesterone concentrations and the levels in the endometrium (e.g. Bayard et al., 1975). Studies indicate that this is not the case in a hormone replacement therapy cycle with vaginal administration of progesterone (Labarta et al., 2021; Zhang et al., 2021). A recent study shows significant higher progesterone levels in endometrial biopsies compared with the natural cycle, while serum progesterone concentrations are nearly the same (Zhang et al., 2021). Still, progesterone in the uterine vasculature should reflect plasma progesterone concentrations, and both plasma and endometrial progesterone levels may be important for endometrial receptivity and successful pregnancy (Yovich et al., 2015; Devine et al., 2018).
Endometrial HLA-F mRNA expression has been shown to be influenced by genetic variations (Burrows et al., 2016; Mika et al., 2018). Furthermore, others and we have shown that specific HLA-F-linked SNPs are correlated with significant differences in time-to-pregnancy. The rs2523393 SNP is located in a GATA2-binding site in a progesterone responsive enhancer close to the HLA-F gene, which influences HLA-F expression in mid-secretory endometrium. Interestingly, it also loops to the HLA-G promoter. GATA2 acts as a co-factor for the progesterone receptor and mediates the decidualization process of endometrial stromal cells (Burrows et al., 2016; Mika et al., 2018; Langkilde et al., 2020). Here, we show for the first time an association of rs1362126, rs2523405 and rs2523393 SNP genotypes with significant differences in HLA-F protein expression levels in the endometrium. The current results are in accordance with low HLA-F protein expression by endometrial stromal cells in the SNP genotypes that previously have been shown to correlate with a longer time-to-pregnancy and low HLA-F mRNA levels (Mika et al., 2018; Langkilde et al., 2020). The HLA-F diplotype consisting of the three examined SNPs was also predictive of HLA-F endometrial expression, with the GTA/GTA diplotype showing significantly higher HLA-F protein expression compared with the AGG/GTA diplotype. In one of our previous studies, the AGG/GTA diplotype was linked with longer time-to-pregnancy and a lower probability of achieving pregnancy in each IVF cycle compared with the GTA/GTA diplotype (Langkilde et al., 2020).
A range of published studies has reported significant associations between specific HLA-G alleles, genotype and haplotypes, and success of IVF treatment (Hviid et al., 2004; Lashley et al., 2014; Nilsson et al., 2020). One meta-analysis also concluded that the HLA-G 14-bp insertion allele increases the risk for RIF in Caucasians (Fan et al., 2017). Furthermore, several studies have reported significant associations between specific HLA-G polymorphisms and increased, or reduced, risk of recurrent pregnancy loss (Hviid et al., 2004; Christiansen et al., 2012; Amodio et al., 2016; Meuleman et al., 2018). These results have been confirmed in meta-analyses (Wang et al., 2013; Shi et al., 2017; Monti et al., 2019), although no pathophysiological mechanisms have been presented to explain these associations. We hypothesized that a mechanism for higher risk of implantation failure and pregnancy loss could be low HLA-G expression in the endometrium. However, in the present study no differences in sHLA-G endometrial gland expression between the HLA-G 14-bp insertion/deletion alleles or genotypes, or any differences between the IVF control group compared with the RIF group, were found. Furthermore, no differences in endometrial sHLA-G expression were detected for extended haplotypes.
In the immunohistochemistry analyses, we observed a differential expression of HLA-F and sHLA-G between the IVF control group and the RIF group. Based on previous studies, we expected that women with implantation failure express lower levels of HLA class Ib molecules and thus experience insufficient immune suppression for the implantation and maintenance of pregnancy (Keskin et al., 2013; Nowak et al., 2019; Sipak et al., 2019; Nilsson et al., 2020). In the present study, we observed a possible inverse effect (Fig. 4). However, when only women with endometrial biopsies in the receptive phase determined by the ERA test were compared, only sHLA-G expression in the glands remained significant higher in the RIF group compared with the controls. Therefore, at least some of the differences in especially HLA-F expression may be a consequence of the finding that many endometrial biopsies in the RIF group are seemingly not in the receptive stage according to the ERA test and show abnormal HLA-F and/or sHLA-G expression. There might also be other accompanying explanations for these observations. First, it seems that both HLA-F and HLA-G can be upregulated by stress and unfavourable conditions (Gleimer and Parham, 2003; d’Almeida et al., 2019). It might be hypothesized that especially sHLA-G expression in the RIF group might be aberrantly high compared with the levels expressed by the IVF control group as a consequence of inflammation, infection or environmental stress, which are unfavourable for implantation and successful pregnancy. These molecules might also mediate excessive immunosuppression, which could also hinder the post-coitus inflammatory response essential for attachment and implantation (Sharkey et al., 2012; Schumacher et al., 2018). We identified CD138+ plasma cells in the endometrial biopsies as an indicator of chronic endometritis as described by others (Liu et al., 2018), where three or more CD138+ cells in the whole section are classified as chronic endometritis. Based on this definition 24% in the RIF group showed signs of chronic endometritis but only 6% in the IVF control group. However, there were no specific relationships between the abundance of CD138+ cells and HLA-F or sHLA-G expression. Therefore, the RIF group may show more cases of chronic endometritis in general, which in some cases could be followed by a compensatory mechanism with increased sHLA-G and maybe HLA-F expression levels. Second, many of the women in the RIF group and the group with female infertility were diagnosed with polycystic ovarian syndrome (PCOS), which is associated with ‘low-grade inflammation’ (Palomba et al., 2021). Women with PCOS often have disturbances in the progesterone pathways with high levels of 17-hydroxyprogesterone, and low plasma levels of progesterone. Interestingly, the women also showed increased HLA-F expression with decreasing plasma progesterone (Fig. 8). A combination of these factors is also likely with endocrine dysregulation, aberrant timing of endometrial receptivity and some degree of inflammation resulting in an excessive expression of immunomodulating HLA-F and sHLA-G that may compromise the balance in HLA-F’s and sHLA-G’s interaction with receptors on uNK cells, which might have implications for implantation and fertility.
Consistent with our previous findings, we observed a positive correlation between HLA-F in endometrial stroma with CD56+ uNK cells in the whole cohort, in the no female infertility group and in the male infertility diagnosis subgroup (Kofod et al., 2017). Furthermore, the endometrial sHLA-G expression was positively correlated with uNK cells in the no female infertility subgroup, but negatively correlated in the female infertility diagnosis group. This further confirms the importance of NK cells in the endometrium and their role in successful pregnancy achievement (Clifford et al., 1999; Giuliani et al., 2014). We investigated CD163 as a M2-macrophage-specific marker, which is upregulated in anti-inflammatory responses and an alternatively activated phenotype (Etzerodt and Moestrup, 2013). Interestingly, a positive correlation between endometrial HLA-F and the anti-inflammatory M2 macrophages was observed. Macrophages, as antigen presenting cells, are thought to mainly interact via HLA class II molecules (Striz et al., 2014). However, we propose anti-inflammatory macrophage–HLA-F interactions to be of importance for implantation and early pregnancy. In line with the high HLA-F expression in the RIF group and a proposed inflammation and/or stress environment, the high number of anti-inflammatory macrophages may be seen as a compensation for these unfavourable conditions (Brown et al., 2014; Jena et al., 2019). Functional studies will be needed to confirm this hypothesis. Similar to uNK cells, low Treg counts have been associated with multiple pregnancy complications and therefore are considered vital for successful pregnancy (Giuliani et al., 2014; Salvany-Celades et al., 2019). Unexpectedly, endometrial HLA-F expression was negatively correlated with regulatory T cells in the RIF group, but a positive trend was seen in the IVF control group. The high HLA-F expression in women experiencing RIF may have a negative effect on the levels of Tregs at the site of implantation, and therefore a Treg-mediated immuno-tolerogenic effect may be hindered in women with RIF (Kofod et al., 2018). Finally, we observed a highly significant positive correlation between CD163+ M2 macrophages and CD56+ uNK cells. As NK cells and macrophages are the largest populations in the endometrium, a strong positive correlation may further support their interaction and cross-talk (Mor et al., 2017).
The sample material in the present study was collected from women in a hormone-substituted cycle. This may be a strength in relation to the investigations of plasma progesterone and expression levels of HLA class Ib or specific immune cell subsets in the endometrium because the hormone stimulation might be more uniform for most of the women included. On the other hand, samples from women in a natural cycle might be more illustrative in the diversity of immune marker expression and immune cell abundance. It is important to emphasize that ‘RIF’ is a very broad term, including many heterogeneous causes and diagnoses. Likewise, our study cohort includes diverse pathophysiologies and therefore different genetic backgrounds and HLA expression levels. Last, but not least, HLA expression is multifactorial and can be influenced by many other factors such as splice variants, DNA methylation, miRNA-mediated post-transcriptional regulation etc., which were not explored in the current study (Carey et al., 2019).
In conclusion, this is to our knowledge the first report on HLA-F protein expression in the endometrium detected by several techniques. The results consolidate that HLA-F protein is present in the endometrium in the secretory phase of the menstrual cycle at the time of embryo implantation. For all women, but not when restricted to those in the receptive phase regarding HLA-F, we observed significantly higher endometrial HLA-F and sHLA-G levels in women with RIF compared with the IVF control group. This may indicate a stressful environment with inflammation or endocrine dysfunction. We propose that HLA-F-anti-inflammatory macrophage interactions at the time of implantation may mitigate these unfavourable conditions. HLA-F expression increased from the pre-receptive to the receptive phase in the IVF control group, but not in the RIF group. Furthermore, we have shown that the HLA-F protein level is associated with gene polymorphisms near the HLA-F gene locus and haplotypes/diplotypes that according to previous studies were under influence of progesterone and correlated with differences in time-to-pregnancy. In summary, the subgroup of women experiencing RIF and diagnosed with female infertility, primarily with PCOS and anovulation diagnoses, showed the following characteristics: HLA-F expression in the endometrium was negatively correlated with plasma progesterone, and there was no correlation between HLA-F and uNK cells. A negative correlation between sHLA-G expression and uNK cell abundance was detected. Interestingly, these findings might be a part of a profile of an immunological and endocrinological compromised endometrium.
Supplementary data
Supplementary data are available at Human Reproduction online.
Data availability
The data underlying this article will be shared on reasonable request to the corresponding author.
Acknowledgements
The authors wish to thank all referring fertility clinics for their assistance in creating the RIF cohort: Danfert, Fertility Clinic Hvidovre Hospital; Fertility Clinic Rigshospitalet; Fertility Clinic Trianglen; Odense IVF Clinic; and Vivaneo Stork Fertility Clinic. Special thanks to the Fertility Clinic Herlev Hospital for also contributing to the control cohort.
Authors’ roles
H.P. performed all the experimental work and conducted most of the data analyses under supervision of T.V.F.H., and wrote the manuscript together with T.V.F.H.; M.H.S., I.E.J. and N.S.M. developed and conducted the clinical study part; G.P. assisted in and supervised cell culture, flow cytometry and western blot procedures; immunohistochemistry (IHC) data analysis was performed by T.H., H.P., J.O.E. and L.G.L.; J.O.E. developed the IHC algorithms; T.F. and I.W. assisted in and supervised DNA sequencing methods; T.V.F.H. conceived, designed and developed the current specific project together with H.P. All authors reviewed and approved the final version of the manuscript.
Funding
This work was supported by the Region Zealand Health Sciences Research Foundation and the Zealand University Hospital through the ReproHealth Research Consortium ZUH.
Conflict of interest
The authors declare no conflict of interest.
