


Abstract
Have decidual natural killer (dNK) cells a different microRNA (miRNA or miR) expression pattern compared to NK cells circulating in the peripheral blood (pb) of healthy pregnant women in the first trimester of gestation?
dNK cells have a unique miRNA profile, showing exclusive expression of a set of miRNAs and significant up- or down-regulation of most of the miRNAs shared with pbNK cells.
dNK cells differ from pbNK cells both phenotypically and functionally, and their origin is still debated. Many studies have indicated that miRNAs regulate several important aspects of NK cell biology, such as development, activation and effector functions.
Decidua basalis and peripheral blood specimens were collected from women (n = 7) undergoing voluntary termination of gestation in the first trimester of pregnancy. dNK and pbNK cells were then highly purified by cell sorting.
miRNAs expression was analysed by quantitative RT-PCR (qRT-PCR)-based arrays using RNA purified from freshly isolated and highly purified pbNK and dNK cells. Results from arrays were validated by qRT-PCR assays. The bioinformatics tool ingenuity pathway analysis (IPA) was applied to determine the cellular network targeted by validated miRNAs and the correlated biological functions.
Herein, we identified the most differentially expressed miRNAs in NK cells isolated from peripheral blood and uterine decidua of pregnant women. We found that 36 miRNAs were expressed only in dNK cells and two miRNAs only in pbNK cells. Moreover, 48 miRNAs were commonly expressed by both NK cell preparations although at different levels: 28 were upregulated in dNK cells, while 15 were downregulated compared to pbNK cells. Validation of a selected set (n = 11) of these miRNAs confirmed the differential expression of nine miRNAs: miR-10b and miR-214 expressed only in dNK cells and miR-200a-3p expressed only in pbNK cells; miR-130b-3p, miR-125a-5p, miR-212-3p and miR-454 were upregulated while miR-210-3p and miR-132 were downregulated in dNK cells compared to pbNK cells. IPA network analysis identified a single network connecting all the miRNAs as well as their significant involvement in several classes of functions: ‘Organismal injury, Reproductive system disease, Inflammatory disease’ and ‘Cellular development’. These miRNAs target molecules such as argonaute 2, tumour protein p53, insulin and other genes that belong to the same network and significantly influence cell differentiation and pregnancy.
In the present study, the cellular network and biological functions modulated by miRNAs differentially expressed in dNK and pbNK cells were identified by IPA considering only molecules and relationships that were with confidence ‘experimentally observed’ in leucocytes. The decidual and pbNK cells that were analysed here are a heterogeneous population and further study will help to disentangle whether there are differences in miRNA production by the different subsets of NK cells.
This is the first study describing a different miRNA expression profile in dNK cells compared to matched pbNK cells during the first trimester of pregnancy. Our findings improved the body of knowledge on dNK cell biology and strongly suggest further investigation into the roles of miRNAs that are differentially expressed in human dNK compared to pbNK cells. Our results suggest that specific miRNAs can modulate dNK cell origin and functions, highlighting a potential role of this miRNA signature in human development and diseases.
This work was supported by grants from the Istituto Pasteur, Fondazione Cenci Bolognetti, the European NoE EMBIC within FP6 (Contract number LSHN-CT-2004-512040), Istituto Italiano di Tecnologia, and Ministero dell’Istruzione, dell’Università e della Ricerca (Ricerche Universitarie), and from Università Politecnica delle Marche. There are no conflicts of interest to declare.
Introduction
Natural killer (NK) cells, belonging to the innate lymphoid cell family, represent a highly specialized population of large granular lymphocytes (Artis and Spits, 2015). In addition to their traditional well-described role as killers in tumours and microbial infections, in the last few decades, they emerged as immunomodulatory cells acting as key players not only in innate immunity but also in shaping adaptive immune responses (Trinchieri, 1989; Vivier et al., 2008).
NK cells originate from the hematopoietic stem cells CD34+, and their complex and multi-step differentiation process occurs mainly in the bone marrow, although NK cell progenitors can undergo final maturation also in the periphery (Freud and Caligiuri, 2006; Stabile et al., 2018). NK cells are heterogeneous, with distinct phenotypes and functions in diverse tissues. NK cells mainly circulate in the peripheral blood, but they also accumulate in several lymphoid and non-lymphoid organs, such as spleen, tonsils, lymph nodes, intestine, liver, lungs and uterus (Trinchieri, 1989; Fehniger et al., 2003; Gismondi and Santoni, 2006). In humans, during early pregnancy a large number of NK cells are found in the decidua, at the maternal–foetal interface, where they constitute nearly 70% of lymphocytes (King et al., 1996–97; Tabiasco et al., 2006; Santoni et al., 2008). Decidual NK (dNK) cells differ from peripheral blood NK (pbNK) cells both genetically and phenotypically and, due to these differences, they exert different effector functions (Koopman et al., 2003). Unlike pbNK cells, dNK cells are poor cytotoxic lymphocytes and major cytokine and growth and angiogenic factor producers; they display more pronounced characteristics of immune tolerance, necessary to ensure successful pregnancy (Koopman et al., 2003; Hanna et al., 2006). The principal roles described for dNK cells are to facilitate implantation, trophoblast invasion and vascular remodelling, that are processes essential for placental development and to ensure a good outcome of pregnancy (Hanna et al., 2006). However, the origin and the differentiation programme of dNK cells remain unknown. Presently, it is still debated whether they arise from NK cell progenitors present in the uterus or are recruited from other tissues, or from NK cell populations recruited from the blood. Several studies showed that pbNK cells could be recruited to the decidua in response to several chemokines and chemotactic factors and then acquire a receptor pattern profile similar to dNK cells following interaction with decidual stromal cells (Chantakru et al., 2002, Carlino et al., 2008, 2012).
MicroRNAs (miRNAs also referred in the text as miRs) are critical regulatory RNAs that, by controlling gene expression in various biological processes (Bartel, 2004), could be involved in NK phenotypic changes. To date, over 2000 miRNAs have been identified in the human genome (Santulli, 2015). In human, partial pairing between a miRNA and a mRNA target site usually results in reduced protein expression through the degradation of target mRNAs or the inhibition of translation through interactions with target transcripts (Thomas et al., 2010). Human miRNAs control a broad array of biological processes including proliferation, stem cell maintenance, differentiation, cell death and metabolism (Huang et al., 2011). Recently, an increasing number of studies have highlighted a critical role for miRNAs in the regulation of NK cell development, activation and effector functions (Liu et al., 2012; Sullivan et al., 2013). Interestingly, miRNAs were identified as epigenetic modulators of gene expression in different physiological and pathological processes that occur in the endometrium, including implantation of the embryo (Chegini, 2010; Hull and Nisenblat, 2013). To date, no information is available regarding the comparison of miRNA expression between dNK and matched pbNK cells during early pregnancy.
In this study we profiled 377 microRNAs in both pbNK and dNK cells, and identified the microRNAs differentially expressed by these two populations. The validation analysis was focused on nine miRNAs and confirmed that miR-10b and miR-214 are expressed only in dNK cells, miR-200a-3p only in pbNK cells, whereas miR-130b-3p, miR-125a-5p, miR-212-3p and miR-454 are upregulated in dNK compared to pbNK cells, and miR-210-3p and miR-132 are down-regulated in dNK cells. Finally, ingenuity pathway analysis (IPA) identified a network involving all miRNAs and relevant biological functions and diseases involved in reproduction and development.
Material and Methods
Samples
Human pbNK and dNK cells were isolated from peripheral blood and decidua basalis of women undergoing elective pregnancy termination (8–12 weeks of gestation) as previously described (Carlino et al., 2008). Seven different donors were analysed: three donors were used for miRNA analysis through a quantitative RT-PCR (qRT-PCR)-based array, and the other four were used for validation of selected miRNAs through a single-species TaqMan qRT-PCR assay.
NK cell isolation
Briefly, peripheral blood mononuclear cells were isolated by Lymphoprep (Nycomed AS, Oslo, Norway) gradient centrifugation while decidual samples were mechanically and enzymatically digested and then cell suspensions were purified by Lymphoprep density gradient centrifugation.
pbNK and dNK cells were further purified through staining with FITC-conjugated anti-CD14 plus phycoerythrin-conjugated anti-CD56, peridinin chlorophyll-A protein-conjugated anti-CD3 and phycoerythrin cyanin 7-conjugated anti-CD45 monoclonal antibodies (BD Biosciences, San Jose, CA, USA) for 30 min at 4°C, and subsequent selection by cell sorting. Data from single cell events were collected using a FACSAria cell sorter (BD Bioscences). The purity of the resulting pbNK and dNK cell populations was routinely more than 95% CD56+CD45+CD3− and CD56+CD45+CD3−CD14−, respectively. After cell sorting, dNK and pbNK cells were stained with FITC- or allophycocyanin-conjugated anti-CD9 to verify the quality of our samples.
Informed consent was obtained from all donors providing peripheral blood and tissue specimens, and ethical approval was obtained from the university hospital committees.
RNA isolation for miRNA analysis
Total RNA from dNK and pbNK cells was isolated using an RNA purification kit (Norgen Biotek Corporation, Thorold, Ontario, Canada), according to the manufacturer’s protocol. The RNA was stored at −80°C until use.
qRT-PCR-based array analysis of mature miRNAs
About 300 ng of total RNA were converted to cDNA by priming with a mixture of looped primers following the manufacturer’s instructions (MegaPlex kit; Thermo Fisher, Milan, Italy).
Pre-amplification was performed using 6 μl of input RNA with PreAmp kit (Thermo Fisher), while 9 μl of pre-amplified cDNA was used for mature miRNA profiling by a real-time PCR instrument equipped with a 348-well reaction plate (7900 HT; Thermo Fisher) and human miR Array pool A (Thermo Fisher) containing 377 different human miRs assays in addition to four selected small nucleolar RNAs. miRNAs expressed at detectable level in at least two donors were compared based on their relative expression to the overall miRNA expression on each array using median normalization analysis. Each miRNA was defined as the difference of expression between dNK and pbNK cells. It was calculated as previously described (Olivieri et al., 2012, 2013).
qRT-PCR of mature miRNAs
A set of miRNAs were validated with qRT-PCR: we chose the most highly expressed miRNAs of each group and, among miRNAs commonly expressed by both dNK and pbNK cells, we selected miRNAs with a fold change >4.
miRNAs were quantified using a TaqMan MicroRNA Assay (Thermo Fisher) with some modifications. Briefly, total RNA was reverse-transcribed with the TaqMan MicroRNA Reverse Transcription Kit. Each 5 μl of RT reaction contained 1 μl of each miRNA-specific stem-loop primer, 1.67 μl input RNA, 0.4 μl 10 mM dNTPs, 0.3 μl reverse transcriptase, 0.5 μl 10× buffer, 0.6 μl RNAse inhibitor and 0.5 μl H2O2. The mixture was incubated at 16°C for 30 min, 42°C for 30 min and 85°C for 5 min. Subsequently, quantitative real-time PCR (qRT-PCR) was performed in 20 μl PCR reaction containing 1 μl 20× Taqman miR Assay in which PCR primers and probes (5′-FAM) were enclosed, 10 μl 2× TaqMan Universal Master mix no. UNG (Applied Biosystems) and 5 μ RT product. The reaction was first incubated at 95°C for 2 min followed by 40 cycles of 95°C for 15 s and 60°C for 1 min. Data were analysed with real-time Mastercycler ep realplex (Eppendorf, Hamburg, Germany) with the automatic Ct setting for adapting baseline. The detection threshold was set to 35 Ct. The relative amount of each miRNA was calculated using the comparative threshold (Ct) method 2−ΔCt, ΔCt = Ct(miRNA)−Ct (RNU44 or RNU48).
Estimation of miRNAs expression values by qRT-PCR based array and single miRNA qRT-PCR based assay
Briefly, the relative expression of each miRNA analysed by the array was calculated using the equation 2−ΔCt, ΔCt = Ct (single miRNA) – (median Ct value of all miRNAs analysed by the array). To compare the relative expression obtained by the array of pbNK and dNK, the ‘fold changes’ were estimated as the ratio between the expression levels of miRNAs in pNK and dNK cells. A 4-fold or greater difference of miRNA expression of dNK versus pbNK cells was considered a significant finding. According to the literature, this threshold was applied only for data generated by the array.
The relative expressions of a single miRNA validated by the assay were calculated as 2−ΔCt, ΔCt = Ct (single miRNA) – (Ct RNU analysed in the same samples). Statistical analysis was used to compare the mean relative expression values in dNK versus pbNK cells.
Biofunctions and network analysis
IPA (www.ingenuity.com) was used to evaluate the interaction network and biological function of miRNAs confirmed by validation. IPA Core Analysis was performed by uploading our nine validated miRNAs. Both direct and indirect molecule relationships and only those with the confidence ‘Experimentally Observed’ were included in the analysis. The significance of biological functions and interaction networks was analysed by the system using Fisher’s exact test (significance cut-off is P < 0.01). The IPA system identified miRNA-212 (miR-212) and miRNA-132 (miR-132) as the same miRNA, since they belong to the same family with an identical seed sequence (AACAGUC): thus, IPA showed a total input of eight miRNAs in total and the network’ s figure displayed only miR-132.
Statistical analysis
A paired sample Student’s t-test was used to compare miRNA expression between dNK and pbNK cells isolated from the same subject. Statistical significance was defined as a two-tailed P value <0.05. Data analysis was carried out with the SPSS/Win program version 22 (SPSS, Chicago, IL, USA).
Results
Isolation of dNK and pBNK cells
In this study, pbNK and dNK cells were highly purified from pregnant women undergoing elective abortion in the first trimester between 8 and 12 weeks of gestation, by cell sorting. The gating strategy applied for decidual cell analysis was designed to minimize cellular contamination (Fig. 1A). As shown, dNK cells are mainly CD56high, and the majority express the tetraspanin CD9, while pbNK cells are mainly CD56dim and show undetectable levels of CD9 (Fig. 1B). The purity of the resulting CD56+CD45+CD3−CD14− dNK cell and CD56+CD45+CD3− pbNK cell populations was routinely higher than 98%, as detected by flow cytometric analysis (Fig. 1A and B).
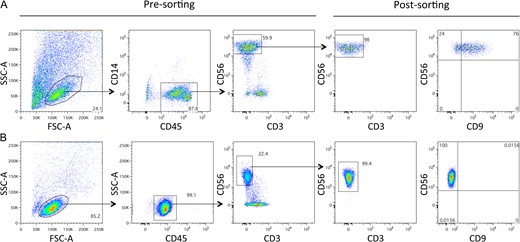
The phenotypic characterization of decidual and peripheral blood natural killer cells. (A) Decidual natural killer (dNK) cells were purified from decidual specimens from elective first-trimester pregnancy terminations and were analysed with 5-colour immunofluorescence and cell sorting. More than 98% of the resulting dNK cells were CD45+CD56+CD3−CD14−; the majority of dNK cells expressed CD9. (B) Peripheral blood mononuclear cells were purified and analysed with 4-colour immunofluorescence and cell sorting. More than 98% of the resulting peripheral blood NK (pbNK) cells were CD45+CD56+CD3−; pbNK cells were negative for CD9 expression. Percentages of total cells within gates are shown on the plots. Forward scatter (FSC) and side scatter (SSC).
dNK cells showed a differential miRNA expression pattern compared to peripheral blood NK cells
To identify a dNK cell signature that may contribute to a dNK cell-specific molecular programme, we analysed the differential miRNA expression profiles of d and pbNK cells during early pregnancy by performing miRNA qRT-PCR-array. To this aim, 377 human miRNAs were profiled in dNK cells and their matched peripheral blood counterparts. A total of three different donors were analysed.
We found that 86 miRNAs were expressed by at least two donors and were thus included in the final analysis. Interestingly, as shown in the Venn diagram of Fig. 2, nearly half of the miRNAs analysed were expressed exclusively in dNK cells. Moreover, among the 48 miRNAs commonly expressed in both dNK and pbNK cells, 28 miRNAs were upregulated whereas 15 were downregulated in dNK cells compared to pbNK cells; only five miRNAs showed similar expression levels in both cellular populations. Only two miRNAs were exclusively detectable in pbNK cells (Fig. 2).
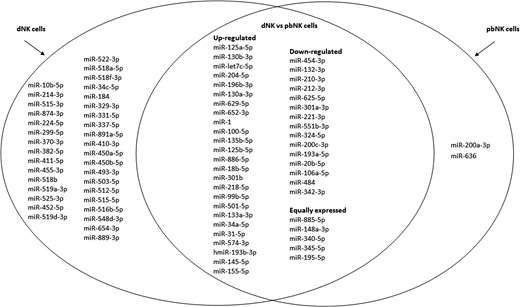
Venn diagram showing the relative expression profiles of microRNAs from dNK and pbNK cells. The microRNAs (miRNAs) differentially expressed in dNK compared to pbNK cells are depicted in the overlapping circle, whereas miRNAs expressed at detectable levels only in dNK and pbNK cells are depicted on right and left circle, respectively.
qRT-PCR validation confirmed miRNA profiling results
The miRNA profiling results were then validated via qRT-PCR in four different donors: we considered only the most highly expressed miRNAs and, among those commonly expressed by both dNK and pbNK cells, we chose miRNAs with a fold change >4. We showed the qRT-PCR-array expression analysis of the highly expressed miRNAs in dNK cells (miR-10b-5p and miR-214-3p, Fig. 3A) and pbNK cells (miR-200a-3p, Fig. 3B), and, among the miRNAs commonly expressed by both cell types, those with higher (miR-125a-5p, miR-130b, miR-196b and let-7c, Fig. 3C) or lower-(miR-210-3p, miR-212-3p, miR-132 and miR-454, Fig. 3D) expression levels in dNK compared to pbNK cells.
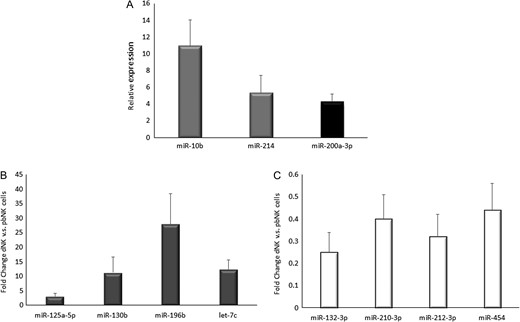
Expression levels of miRNAs differentially expressed in dNK and pbNK cells, analysed through quantitative RT-PCR based array. (A) Gray bars: relative expression of miRNAs expressed only in dNK cells; black bar: miRNA expressed only in pbNK cells. Data are reported as relative expression calculated with the equation: 2−ΔCt, ΔC = (Ct of miRNA – median Ct value of all miRNAs analysed in the array). (B) Upregulated miRNAs in dNK versus (vs) pbNK cells. (C) Down-regulated miRNAs in dNK vs pbNK cells. In panels B and C data are reported as ‘fold changes’ of miRNA values in dNK versus pbNK cells (arbitrary assessed as 1).
Validation analysis confirmed that both miR-10b and miR-214 were expressed only in dNK cells (Fig. 4A) with miR-200a-3p only in pbNK cells in all samples analysed, although patient variability was observed. Among the common miRNAs, miR-130b-3p and miR-125a-5p were confirmed to be upregulated in dNK cells (Fig. 4C), and miR-210-3p and miR-132 to be downregulated (Fig. 4D). Unexpectedly, this analysis showed that miR-212-3p and miR-454 expression levels were significantly increased in dNK cells compared to pbNK cells in all samples (Fig 4C), in contrast to our preliminary profiling data (Fig. 3). miR-196b and let-7c were not confirmed as differently expressed (data not shown).


Validation analysis by quantitative RT-PCR of miRNAs identified as differentially expressed in dNK versus pbNK cells through miRNA array. Data are reported as relative expression, calculated with the equation: 2−ΔCt, ΔC = (Ct of miRNA – Ct of RNU). MiRNAs expressed only in dNK cells (A) and pbNK cells (B). Data are represented both for each subject (#) used for validation (n = 4) on the left, and as average of all subjects on the right. MiRNAs upregulated (C) or downregulated (D) in dNK cells compared to pbNK cells: data are represented as the average of all subjects (n = 4), upper panels, or separately for each subject, lower panels. Statistical analysis was performed using Student’s t-test. Error bars represent SD.
Bioinformatics analysis of biological functions and networks
In order to evaluate the potential biological role and the molecular networks of miRNAs differentially expressed in dNK and pbNK cells, we ran an IPA Core Analysis with all the validated miRNAs (miR-10b, miR-214, miR-200a-3p, miR-130b-3p, miR-125a-5p, miR-210-3p, miR-132, miR-212-3p and miR-454), irrespective of the expression levels or the cell population. The IPA database recognized miR-212-3p and miR-132-3p as belonging to the same family with identical seed sequence (AACAGUC), thus, they were the same miRNA. Therefore, an input of eight total miRNAs was shown in the analysis.
The overview of the relevant categories shared by the validated miRNAs showed that all of them significantly fell into the top scoring categories ‘Reproductive system disease’ and ‘Organismal injury and abnormalities’, six of them in the categories ‘Cellular development’ and ‘Cellular growth and proliferation’ (miR-10a-5p, miR-125b-5p, miR-130a-3p, miR-132-3p, miR-141-3p and miR-214-3p) and four in ‘Cellular movement’ (miR-10a-5p, miR-125b-5p, miR-130a-3p and miR-141-3p) (Fig. 5). Of note, the top gene network most significantly affected, with all the miRNAs included (n = 8) and a relevant score, was in ‘Organismal injury and abnormalities, Reproductive system disease, Inflammatory disease’ (Fig. 6). Interestingly, all the miRNAs within the network were interconnected by direct or indirect interactions. A more in-depth analysis of the network revealed a molecular role of miR subsets (highlighted in the figures with pink coloured border) in ‘Organismal injury and abnormalities’ and ‘Reproductive system disease’ (all eight miRs involved; Fig. 7A and B, respectively), and in ‘Inflammatory response’ (miR-454, miR-210-3p and miR-125a-5p; Fig. 7C) and ‘Cellular development’ (miR-454, miR-200a, miR-132-3p, miR-10b, miR-125a-5p; Fig. 7D).
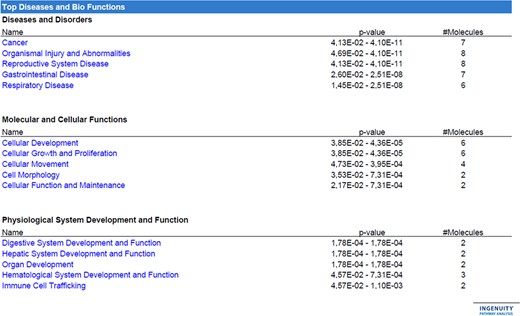
Ingenuity pathway analysis of ‘Top diseases and biofunctions’. The analysis of the ‘top diseases and biofunctions’ was performed using only the miRNAs differentially expressed in dNK versus pbNK cells in exploratory analysis (qRT-PCR based array) and in the subsequent validation step (qRT-PCR single miRNA Assay). Only nine miRNAs were selected for this analysis, namely miR-10b, miR-214, miR-200a-3p, miR-130b-3p, miR-125a-5p, miR-212-3p, miR-454, miR-210-3p and miR-132. This analysis (confidence = Experimentally Observed) shows several categories that can be grouped in three main groups, such as ‘diseases and disorders’, ‘cellular and molecular functions’ and ‘physiological system development and function’. The number of miRNAs belonging to each category is indicated on the right of the panel. Categories ‘organismal injury and abnormalities’, ‘reproductive system disease’, ‘cellular development’, ‘cellular growth and proliferation’ and ‘cellular movement’ are the ones with the higher number of miRNAs target. As explained in the main text, Ingenuity pathway analysis (IPA) identifies miR-212-3p and miR-132 as the same, due to their identical core seed sequence; therefore, the maximum number of molecules present in the analysis is equivalent to eight. The range of P values of each category is indicated within the panel. Statistical analysis was performed using Student’s t-test. Error bars represent SD.
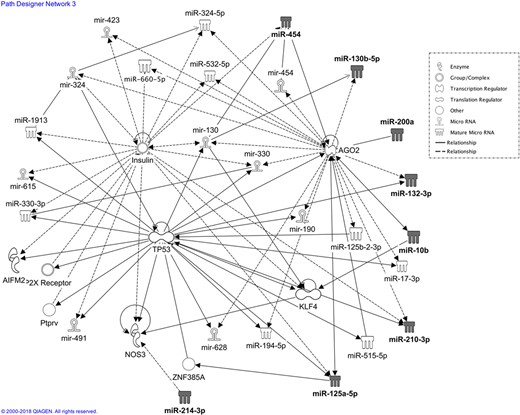
Network analysis with IPA. The network involving miR-10b, miR-214, miR-200a-3p, miR-130b-3p, miR-125a-5p, miR-212-3p, miR-454, miR-210-3p and miR-132 is depicted, highlighting direct (continuous lines) and indirect (dashed lines) interactions between validated miRNAs (grey coloured symbols), other miRNAs (empty symbols) and proteins or protein group/complex. Apoptosis inducing factor mitochondria associated 2 (AIFM2); argonaute 2 (AGO2); Kruppel like factor 4 (KFL4); nitric oxide synthase 3 (NOX3); purinergic receptor P2X (P2XR); tumour protein p53 (TP53); zinc finger protein 385A (ZNF385A).
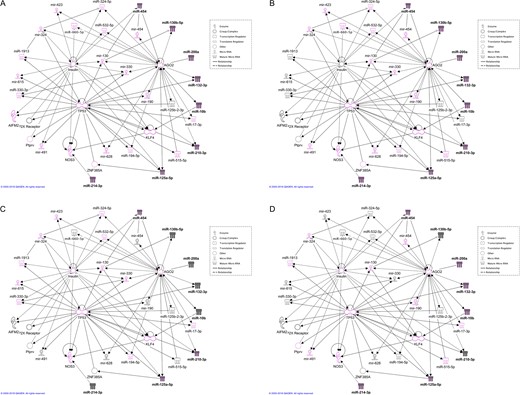
IPA of network functions. The network represented in Fig. 6 was analysed for functions related to reproduction, development and immune system. The most significant functions processed by the system are ‘Organismal injury and abnormalities’ (A), ‘Reproductive system disease’ (B), ‘Inflammatory response’ (C) and ‘Cellular development’ (D). All miRNAs and other molecules belonging to each function are represented with pink coloured borders. Validated miRNAs are filled with black colour.
The network analysis also showed two hubs where signalling converged: argonaute 2 (AGO2) and tumour protein p53 (TP53). They appear to be linked not only to each other but also to the insulin pathway (Figs 6 and 7).
Discussion
Here we showed for the first time that dNK cells have a different miRNA expression pattern compared to their matched NK cells circulating in the peripheral blood of healthy women during the first trimester of pregnancy.
Despite increasing knowledge regarding dNK cell biology, the origin and the regulation of the specific functional programme of dNK cells is still not clear. Evidence suggests that dNK cells could originate from NK cell progenitors present in the uterus or recruited from other tissues, and furthermore several studies from our and other groups support the thesis that dNK cells may arise from NK cell populations recruited from blood and then undergoing tissue-specific differentiation (Chantakru et al., 2002; Carlino et al., 2008; Vacca et al., 2011).
Among the factors involved in NK cell biology regulation, miRNAs are now emerging as key molecules (Liu et al., 2012; Sullivan et al., 2013). They also appear to act as major bioregulatory molecules of pregnancy. A number of studies are aimed at identifying miRNAs playing a critical regulatory role in endometriosis (Pan et al., 2007), pregnancy failure, including unexplained recurrent spontaneous abortion (RSA), pre-eclampsia (Sheikh et al., 2016) and infertility (McCallie et al., 2010), and other reproductive system diseases. For example, Wang et al. (2012) demonstrated that miR-133a is regulated by the HLA-G gene and can reduce RSA, Zhao et al. (2014) demonstrated that decidua-derived mesenchymal stem cells have a differential miRNA expression profile in patients with pre-eclampsia, while a recent paper described the role of microRNAs as circulating markers to predict pre-eclampsia outcome using buffy coat specimens during the first trimester (Winger et al., 2018). Concerning specifically dNK cells, an association of miR-34a-3p/5p, miR-141-3p/5p and miR-24 in dNK cells from women with unexplained RSA was recently suggested (Li and Li, 2016). Nevertheless, no previous studies are available so far showing a possible association between miRNAs and dNK cell regulation leading to their specific phenotype and functional programme.
Here, we characterized the differential miRNA expression profiles of dNK and pbNK cells isolated from the same healthy woman during early pregnancy by performing miRNA expression arrays. In this study, the use of cell sorting allowed us to analyse highly pure decidual and peripheral blood CD56+ CD3– NK cell populations.
A previous report compared miRNA profiles expressed by decidual NK cells with those expressed by NK cell isolated from blood of healthy non-pregnant donors (Ni et al., 2015). Nevertheless, it has been described that specific regulatory signals influence NK cell behaviour, primarily hormones, whose synthesis significantly changes during the course of gestation, i.e. modulating NK cell migratory ability (Carlino et al., 2008). Moreover, miRNA expression is also affected by hormonal regulation. Shirshev et al. showed that several hormones, whose synthesis and levels considerably change in the course of physiological pregnancy, influence the expression of miRNAs relevant for NK cell function (miR-155, miR-30c-1, miR-29a and miR-378b), while Hong et al. have recently demonstrated that progesterone regulates miR-378a-3p expression: its levels are decreased in decidua of early pregnancy loss patients, and this may contribute to decidual apoptosis through caspase-3 activation (Shirshev et al., 2017; Hong et al., 2018). Here, we used dNK and pbNK cells isolated from the same pregnant woman in order to avoid errors in evaluating miRNA expression profiles related to a different hormonal state.
Interestingly, of the 86 significantly expressed miRNAs identified by analysing global miRNA expression profiles in three pairs of pb and dNK cell samples, only 15 miRNAs were expressed by both dNK and pbNK cells at similar levels while the great majority showed a differential expression between these two NK cell populations. Among the 45 miRNAs commonly expressed by dNK and pbNK cells, 28 miRNAs were up- and 15 down-regulated in dNK cells, and 36 miRNAs were expressed exclusively by dNK cells whereas only two by pbNK cell. Of note, validation analysis highlighted a pregnancy-associated signature for NK cells of nine miRNAs: miR-10b, miR-214, miR-130b-3p, miR-125a-5p, miR-212-3p and for miR-454 uniquely expressed or upregulated in dNK cells, and miR-200a-3p, miR-210-3p and miR-132, expressed only or upregulated in pbNK cells.
The role of a miRNA depends on its effect on target genes but usually it suppresses the expression of target mRNAs (Thomas et al., 2010); thus, the orchestrated modulation of miRNAs observed in dNK and pbNK cells from the same pregnant donor could lead to the activation of specific functional programmes typical of these cellular populations, such as the cytotoxic activity of pbNK cells or angiogenic and immunotolerance phenotype of dNK cells.
One hypothesis is that this miRNA pattern may be involved in the modulation of pbNK cell cytotoxic functions and the acquisition of a dNK phenotypical and functional profile, which, in turn could depend, at least in part, on the up-regulation of a selected miRNA pool.
Herein, IPA revealed a possible biological role for these nine validated miRNAs and their contribution to functions compatible with the physiological and pathological role of peripheral and decidual NK cells.
Notably, IPA showed that all or most of the validated miRNAs fall into the top scoring categories compatible with intrauterine development, such as reproductive system disease, organismal injury, cellular development, growth and proliferation, besides cellular movement. Surprisingly, the network with the highest score, named by the IPA system as ‘Organismal Injury and Abnormalities, Reproductive System Disease, Inflammatory Disease’, linked all the validated miRNAs with each other, to other miRNAs and to important regulatory proteins, such as TP53, insulin, AGO2 and other genes playing important roles in pregnancy regulation, by direct and indirect interactions. The presence of AGO2 and TP53 in the network is not surprising as they significantly regulate cell differentiation and pregnancy. AGO2 is a critical component of an RNA-induced silencing complex; as a key regulator of miRNA function and maturation, AGO2 has been implicated in the modulation of many biological processes both in cancer and normal cells, such as stem cell maintenance, cell differentiation and functional acquisition (Iosue et al., 2013; Ye et al., 2015). A role for AGO2 in blastocyst differentiation, as well as in embryonic development, has been reported (Morita et al., 2007; Shen et al., 2010).
TP53 can protect embryos from developmental toxicant inducing oxidative stress (Torchinsky and Toder, 2010) and is associated with idiopathic recurrent pregnancy loss (Su et al., 2011). Furthermore, TP53 interacts with Krüppel-like factor 4 (KLF4), a member of the KLF family of transcription factors (Dang et al., 2000); accordingly, IPA analysis confirms the link of KLF4 with TP53, and also with miR-210 and miR-10a-5p. KLF4 is a versatile molecule described to regulate several molecular and cellular processes, such as cell proliferation, differentiation and apoptosis (Ghaleb and Yang, 2017) and it gained a lot of attention because it is one of four factors regulating the induction of pluripotent stem cells (Takahashi et al., 2007).
Insulin is essential for regulating both intracellular and plasma levels of glucose in different tissues, but cannot cross the placenta; nevertheless, upon binding to its specific receptor on the trophoblast membrane, insulin can contribute to the placental metabolism of nutrients (Desoye et al., 1992; Hiden et al., 2006). Moreover, it was shown that insulin can regulate angiogenesis and vasculogenesis in the foetus by binding to foetal endothelial cells (Liu et al., 2009; Brocato et al., 2014; Chen and Zheng, 2014).
In the present study, among the most significant functions related to the network, we found interesting functions associated with reproduction: ‘Organismal injury and abnormalities’ and ‘Reproductive system disease’, which share all the eight miRNAs, accordingly with the related categories, but differ for the involvement of insulin and other miRNAs; ‘Inflammatory response’ with validated miR-454, -210-3p and -125a-5p directly involved; and ‘Cellular development’ where all validated miRNAs, except for miR-130b and -210-3p, are found. During early pregnancy, maternal–foetal interactions lead to a state of mild systemic inflammation, characterized by the presence of activated vascular endothelium, leukocytosis, increased activities of innate immune cells, such as monocytes, and increased plasma levels of pro-inflammatory cytokines and chemokines (Sargent et al., 2006). Accordingly, these data highlight the importance of such an inflammatory state and suggest first, an interesting relationship between miRNAs and insulin that is intimately connected with gestation (Desoye et al., 1992; Hiden et al., 2006; Liu et al., 2009; Brocato et al., 2014; Chen and Zheng, 2014) and second, a possible miRNA-mediated epigenetic regulation of these responses. Of note, IPA showed that, among the functions and the top scoring categories of Disease and Disorders, ‘Reproductive system disease’ and ‘Organismal injury and abnormalities’ were the ones with all miRNAs involved. We therefore hypothesize that a change in the balance among these miRNAs or their abnormal modulation could affect key cellular and physiological functions, resulting in reproductive dysfunctions and diseases. This hypothesis could lead to the identification of miRNA signatures valuable as biomarkers for disease and for making treatment decisions. The data presented in this article were obtained by bioinformatics analysis, however, the filter applied to IPA to find only molecules and/or relationships experimentally observed on leucocytes, combining databases of molecular interactions reported in the literature, highly strengthen the reliability of our findings.
NK cells are a highly heterogeneous population, and different marker combinations can be used to identify distinct subpopulations. According to CD16 molecule expression, pbNK cells can be distinguished into three major subsets, namely CD56high CD16+/−, CD56lowCD16low and CD56lowCD16high that are phenotypically and functionally distinct (Stabile et al., 2015; Roberto et al., 2018). Moreover, as described in literature, pbNK cells are CD9− while ~80% of dNK cells are CD9+, even though, to the best of our knowledge, this antigen alone does not discriminate between two different dNK cell subsets. Finally, the population of innate lymphocyte CD56+CD3−ILC3 has also been described recently to be present at low levels in decidual tissues (~1.5% of CD45+ lymphoid cells) (Montaldo et al., 2016).
In light of this evidence, a limitation of this work is not considering the heterogeneity of the d and pbNK cell populations used. Nevertheless, the aim of this study was to analyse the miRNA profile in the whole CD56+CD3− population of dNK cells compared to their circulating pbNK cell counterpart but not in a specific subset and our data may represent a starting point for future studies aimed at comparing the expression profiles of miRNA from different subpopulations of NK cells.
In conclusion, the data herein reported increases the body of knowledge on dNK cell biology and provides a reference for future further comprehensive research, aimed at identifying new epigenetic mechanisms and target genes implicated in the acquisition of the specific phenotype and functional programme of dNK cells.
Acknowledgements
We would like to thank all the women who participated in this study, as well as doctors and nurses who assisted with recruitment for this research, and Sonia Ascenzi, who assisted with sample processing.
Authors’ roles
C.C.: NK cells isolation experiments, data analysis and article drafting; M.R.R.: study design, data analysis, help drafting the article; V.M.: IPA network e functions; R.L.: miRNA validation, data analysis, draw graphs; S.M.: cell sorting; S.A.: profiling analysis; E.T.: help in NK isolation experiments; H.S.: help in NK isolation experiments; C.B.: collected clinical samples, P.B.P.: collected clinical samples; M.C.A.: help with profiling analysis; F.O.: help summarize the data; A.P: study design; A.S: supervised the study; and A.G.: plan and supervised the study, revised the article. All authors have approved the final version.
Funding
Grants from the European NoE EMBIC within FP6 (Contract Number LSHN-CT-2004-512040), the Italian Institute of Technology (A2 project), Istituto Pasteur-Fondazione Cenci Bolognetti, Ministero dell’Istruzione, dell’Università e della Ricerca (Ricerche Universitarie), and from Università Politecnica delle Marche.
Conflict of interest
None declared.
References
Author notes
C. Carlino and M.R. Rippo Contributed equally.
