


Abstract
What is the effectiveness of a multifaceted implementation strategy compared to usual care on improving the adherence to guideline recommendations on expectant management for couples with unexplained infertility?
The multifaceted implementation strategy did not significantly increase adherence to guideline recommendations on expectant management compared to care as usual.
Intrauterine insemination (IUI) with or without ovarian hyperstimulation has no beneficial effect compared to no treatment for 6 months after the fertility work-up for couples with unexplained infertility and a good prognosis of natural conception. Therefore, various professionals and policy makers have advocated the use of prognostic profiles and expectant management in guideline recommendations.
A cluster randomized controlled trial in 25 clinics in the Netherlands was conducted between March 2013 and May 2014. Clinics were randomized between the implementation strategy (intervention, n = 13) and care as usual (control, n = 12). The effect of the implementation strategy was evaluated by comparing baseline and effect measurement data. Data collection was retrospective and obtained from medical record research and a patient questionnaire.
A total of 544 couples were included at baseline and 485 at the effect measurement (247 intervention group/238 control group).
Guideline adherence increased from 49 to 69% (OR 2.66; 95% CI 1.45–4.89) in the intervention group, and from 49 to 61% (OR 2.03; 95% CI 1.38–3.00) in the control group. Multilevel analysis with case-mix adjustment showed that the difference of 8% was not statistically significant (OR 1.31; 95% CI 0.67–2.59). The ongoing pregnancy rate within six months after fertility work-up did not significantly differ between intervention and control group (25% versus 27%: OR 0.72; 95% CI 0.40–1.27).
There is a possible selection bias, couples included in the study had a higher socio-economic status than non-responders. How this affects guideline adherence is unclear. Furthermore, when powering for this study we did not take into account the unexpected improvement of adherence in the control group.
Generalization of our results to other countries with recommendations on expectant management might be questionable because barriers for expectant management can be very different in other countries. Furthermore, due to a large variation in improved adherence rate in the intervention group it will be interesting to further analyse the process of implementation in each clinic with a process evaluation on professionals and couples’ exposure to and experiences with the strategy.
Supported by Netherlands Organisation for Health Research and Development (ZonMW, project number 171203005). No competing interests.
Dutch trial Register, www.trialregister.nl NTR3405.
19 April 2012.
10 July 2012.
Introduction
Many fertility treatments are performed without evidence that such treatments indeed increase pregnancy rates (Bensdorp et al., 2007). For couples with unexplained infertility, the last decade has shown an ongoing body of evidence that questions the effectiveness of ART in couples who have good natural fertility prospects (Steures et al., 2006; Bhattacharya et al., 2008; Veltman-Verhulst et al., 2012). Several randomized trials have compared the effect of intrauterine insemination (IUI) with or without ovarian hyperstimulation, with expectant management, and they showed no beneficial effect of these treatments over no treatment for 6 months (Steures et al., 2006; Bhattacharya et al., 2008). Consequently, expectant management saved costs as compared to early fertility treatment, specifically in couples with a good prognosis for natural conception (Chambers et al., 2007; Custers et al., 2012).
Therefore, various professionals and policy makers have advocated the use of prognostic profiles and expectant management in guideline recommendations. The European Society of Human Reproduction and Embryology guidelines emphasize that couples should not be exposed to unnecessary risks or ineffective treatments, and encourage that each couple should receive information about the estimate of their chances of natural conception. The National Institute of Clinical Excellence guideline states that couples with unexplained infertility should not be offered IUI with or without ovarian hyperstimulation and that IVF should only be offered after at least 2 years of infertility (Fields et al., 2013).
The Dutch Network Guideline Infertility published in 2010 recommends 6–12 months of expectant management for couples with unexplained infertility and a high chance of a natural conception within 1 year, also called tailored expectant management (TEM) (NVOG, 2010). Unexplained infertility occurs in 25% of couples who are referred for fertility care and based on previous research we expect that at least one in every eight couples with infertility in the Netherlands is eligible for TEM (Brandes et al., 2010; Kersten, et al., 2015). Despite these guidelines, in the Netherlands one-third of all couples with unexplained infertility is still exposed to early treatment, i.e. starting fertility treatments within 6 months after the fertility work-up (van den Boogaard et al., 2011a; Kersten et al., 2015).
Based on previously identified barriers and facilitators for expectant management we have developed a multifaceted strategy to improve adherence to guideline recommendations on expectant management (van den Boogaard et al., 2012). The strategy that we developed focuses on improving the couple's knowledge on expectant management and to create realistic expectations of possible benefits and complications of fertility treatments. In addition, it focuses on improving the communication and counselling skills of professionals on expectant management and emphasizing the guideline recommendations at an organizational level.
We performed a cluster randomized trial to evaluate the effectiveness of the multifaceted strategy compared to care as usual on the adherence to the guideline recommendations on expectant management.
Materials and Methods
Study design
The study was a cluster randomized controlled trial in 25 Dutch clinics evaluating the effectiveness of a multifaceted implementation strategy versus usual care on the adherence to guideline recommendations on expectant management. The study protocol was published in 2013 (van den Boogaard et al., 2013). The institutional ethics committee of Radboud university medical center provided ethical approval for this study (CMO no.2012/130) and the Board of Directors of each clinic provided local approval. After all clinics gave their approval they were randomly assigned to intervention (implementation strategy) or control (care as usual) group. The intervention period lasted one year (between March 2013 and May 2014). The intervention was implemented at clinic level. The effect of the implementation strategy was evaluated by comparing baseline and effect measurement data of couples that were seen in the participating clinics. Data collection was retrospective.
Tailored expectant management
The multidisciplinary ‘Dutch Network Guideline on Infertility’, published in 2010, makes clear guideline recommendations on TEM that are divided in three steps (NVOG, 2010): (i) calculating the probability of a natural conception within 1 year for couples (female age <38 year) with unexplained infertility with the prognostic model of Hunault, (ii) recommending expectant management for at least 6–12 months for couples with a good prognosis (>30% in 1 year) and (iii) Adherence to the advised expectant management period of at least 6 months.
Settings
All Dutch clinics perform a basic initial fertility work-up, and provide (un)stimulated IUI, while 40 of them can commence and monitor the IVF and ICSI treatments. However, the laboratory phase of IVF and the embryo transfer is carried out in 13 fully licensed IVF clinics. In the Netherlands all treatment cycles of ovulation induction (OI), (un)stimulated IUI, and up to a maximum of three IVF or ICSI cycles are reimbursed by basic health insurance coverage mandatory for all Dutch citizens. To ensure that the 25 clinics were representative for Dutch fertility care, we invited six fully licensed IVF clinics, 11 intermediate fertility clinics and eight clinics without IVF facilities, spread across the county, to participate.
Randomization
Randomization was done at clinic level and was stratified for IVF facilities (fully licensed, intermediate/no IVF facilities). Computer-generated randomization took place after clinics had given approval to participate, and was done by an independent physician. Randomization at patient level and blinding was not possible due to the nature of the intervention.
Participants
Inclusion and exclusion criteria
We studied only couples in whom natural conception was possible, i.e. couples with one-sided tubal pathology, mild male infertility (Total Motile Sperm Count 3–10 million), mild endometriosis (ASRM Stage I/II) or cervical factor as well as couples in whom no cause could be found during the fertility work-up. Apart from that, couples needed a good prognosis (>30%) for natural conception within one year based on the prediction model of Hunault et al., (2004).
Couples who had previously achieved a pregnancy through fertility treatment, couples in whom the woman was >38 years as well as couples with bilateral tubal pathology, severe endometriosis (ASRM Stage III/IV), anovulation or severe male factor (Total Motile Sperm Count <3 million) were excluded.
Recruitment and consent
The participating clinics were recruited in 2011. To include eligible participants in the clinics, all potential couples were selected retrospectively by means of each clinic's financial registration database. A specific code is given to all new patients undergoing diagnostics for infertility (F 11-code). For the baseline measurement, couples that had an active F 11-code between February 2011 and March 2012 were asked to participate. For the effect measurement couples were asked to participate if they had an active F 11-code during the intervention period (March 2013–May 2014). We sent all couples a study information letter and an informed consent form with five questions, to cover some of the exclusion criteria. If couples gave written informed consent and were not excluded based on the five questions, medical record research was conducted to assess if the couple was eligible to participate.
Intervention
In the intervention group, the multifaceted strategy was implemented at clinic level and was targeted at couples, professionals and organization. The elements targeted at patients and at the counselling skills of the professional were developed in collaboration with patients with infertility and Freya (Dutch association for patients with infertility problems, www.freya.nl).
Couples:
Access to a website, including a digital and clear version of the prognostic model (of Hunault), and information about optimizing natural pregnancy chances, TEM and fertility treatments.
A patient information leaflet about what could be found on the website and a clinic-specific code to gain access to the website.
Professional:
Audit and feedback (report) of the baseline measurement for each clinic.
An educational outreach visit to each clinic to discuss the feedback report, background information on expectant management, local barriers and to generate a concrete action plan.
Access to the same website that patients got access to. The website also contained information focused on the professional such as a summary of the guideline recommendations.
Access to an E-learning communication module to improve counselling skills on expectant management. The module contained three different video scenarios showing a professional counselling a couple for expectant management. The quality of the counselling ranged from poor to excellent. The scenarios were written with a team of experienced professionals and actual couples with infertility. The scenarios were taped with a real experienced fertility care professional and actors to portray the couple.
Organization:
Availability of a local protocol based on the guideline recommendations.
Pocket cards with a summary of the guideline recommendations on expectant management and the clinics’ code to gain access to the website.
Clinics that participated in the control group were not exposed to the tools of the multifaceted strategy and continued care as usual.
Primary outcome
The primary outcome was adherence to TEM, i.e. the percentage couples that were advised an expectant management period of at least 6 months and completed the advised period or had a natural conception in the expectant period. This percentage was calculated using all couples with a prognosis of >30% of natural conception within 1 year.
Secondary outcomes
We measured quality indicators that further assessed the adherence to TEM on clinic level.
- The first indicator was based on correctly diagnosing and identifying couples who were eligible for TEM, i.e. the percentage of all included couples with unexplained infertility for whom the prognosis of a natural conception within 1 year was calculated.
- The second indicator was based on advising the correct policy after finalizing the fertility work-up, i.e. the percentage of all included couples that were advised an expectant management of at least 6 months by their doctor if this was appropriate.
- The third indicator was based on following the expectant period of at least 6 months after TEM was advised, i.e. the percentage of couples that were advised an expectant period of at least 6 months after the fertility work-up, and who did not start fertility treatment within these 6 months anyway.
Treatment (outcome)-related measures
We evaluated treatment (outcome)-related measures such as type of treatment, number of treatment cycles received, complications, achievement of conception, mode of conception, ongoing pregnancy rate and the occurrence of multiple pregnancies.
Possible confounders
We investigated potential confounders that could be associated with guideline adherence on TEM. The selection of confounders was based on fertility related literature and included background characteristics and diagnostic outcomes (Mourad et al., 2010; Hermens et al., 2011). For all confounders see Table I. We extracted postal area code to derive the socio-economic status (SES) of the couples (obtained from the Dutch Institute for Social Research/SC based on the mean income level in a postal area code).
Clinic and couple characteristics in the control and intervention group.
| Intervention group | Control group | |||
|---|---|---|---|---|
| Characteristics | Baseline | Effect | Baseline | Effect |
| Per clinic | n = 13 | n = 12 | n = 13 | n = 12 |
| Median no of new couples per year (range) | 398 (93–729) | 351 (120–501) | 348.5 (204–850) | 313 (148–898) |
| Median no of included couples (range) | 25 (11–33) | 19 (6–44) | 17.5 (5–40) | 20 (5–35) |
| Couples | n = 300 | n = 247 | n = 244 | n = 238 |
| Mean age in years (SD)a | ||||
| Female | 30.6 (3.6) | 30.5 (3.6) | 30.9 (3.4) | 31.5 (3.8) |
| Male | 33.2 (5.3) | 33.5 (5.3) | 33.1 (4.4) | 34.5 (5.3) |
| Type of infertility (%)b | ||||
| Primary | 62.9 | 59.1 | 66.0 | 58.0 |
| Secondary | 37.1 | 40.9 | 34.0 | 42.0 |
| Median duration of subfertility in years (IQR)c | 1 (1–2) | 1 (1–2) | 1 (1–2) | 1 (1–2) |
| History ≥1 miscarriage (%) | 19.3 | 23.1 | 16.8 | 23.1 |
| Mean prognosis (%) of natural conception (SD) | 42.3 (8.8) | 41.8 (8.7) | 41.6 (8.6) | 40.5 (7.4) |
| Median BMI woman (IQR) | 23.0 (21.0–26.7) | 22.8 (20.9–26.0) | 22.2 (20.5–24.7) | 23.0 (21.0–25.0) |
| SES (%)d | ||||
| High | 10.5 | 9.7 | 16.9 | 16.8 |
| Median | 76.7 | 79.4 | 71.9 | 69.7 |
| Low | 12.8 | 10.9 | 11.2 | 13.5 |
aAge calculated at the start of basic fertility work-up.
bType of infertility was determined for the couple.
cDuration of infertility was defined as the period between the start of regular unprotected sexual intercourse and the end of the basic fertility work-up when the diagnosis/prognosis was determined.
dSES status was based on the mean income level in a postal code area based on the Dutch institute for Social Research/SC.
IQR, interquartile range; SES, socio-economic status.
Data collection
Data collection was performed retrospectively by using medical records and a patient questionnaire. At baseline measurement, information was collected using paper case report forms (CRF's). For the effect measurement, we used electronic CRF's (eCRF's), based on the paper version of the CRF. To complete the data on the treatment-related outcomes and possible confounders we sent all participating couples a questionnaire (including two reminders in case of non-response). Collected data from the CRF's were entered in a database using SPSS (SPSS 20.0 for Windows, SPSS, Inc., Chicago, IL, USA). The eCRF's were entered into Oracle Clinical Database© and converted using MS Access (2007), before export to SPSS could be performed and data analysed.
Data analysis
All analyses were done at cluster (clinic) level because clinics were randomized, and not patients. Therefore, we used the generalized estimating equation approach with robust estimator covariance, and exchangeable correlation matrix. To analyze the primary outcome, percentage guideline adherence on expectant management in the effect measurement, we used the binary logistic regression model. Included in the model were intervention, all couple characteristics (possible confounders), and baseline guideline adherence on expectant management. Data were presented as odds ratios and corresponding 95% confidence intervals. We carried out secondary analyses using appropriate methods for the outcomes, binary logistic regression for all outcomes except for the number of treatment cycles (Poisson log linear regression), controlling for the same covariates as the primary outcome and adjusting for the clustered nature of the study.
Sample size
Previous studies from the Netherlands indicated that the expected adherence to TEM at baseline was estimated at 60%. To detect a 20% increase in adherence, which we considered clinically relevant, at the 5% significance level with 80% power (with a two-sided test) and an intra class correlation (ICC) of 0.1 to account for potential cluster effects, we estimated that with 25 clusters we would need a total sample size of 450 couples for both baseline and effect measurement. We based the ICC on a previous study on guideline adherence in fertility care (Mourad et al., 2011).
Cost evaluation
In the protocol for this c-randomized controlled trial (RCT), we included a cost-effectiveness analyses of the implementation strategy in case of significant effectiveness of the implementation strategy. Due to the lack of significant effect we performed a cost-consequence analyses. The results can be found in Supplementary data, Table S1.
Results
Study population
Figure 1 presents the recruitment of clinics and eligible couples. All but one fully licensed IVF clinic agreed to participate in the study. For the baseline measurement we sent 9819 couples the information letter. A total of 4283 couples responded (43%) and 3428 couples consented to participate. Based on the questions in the information letter, 1965 couples were excluded. After assessment of the medical records, another 919 couples were excluded. Eventually, 544 couples were eligible to participate. In the effect measurement, we sent 9005 couples the information letter. A total of 3945 couples responded (44%), and 3361 couples consented to participate. Based on the questions in the information letter, 1818 couples were excluded. After medical record research another 963 couples were excluded. Eventually, 485 couples were eligible to participate. Background characteristics of the participating clinics and couples are shown in Table I.
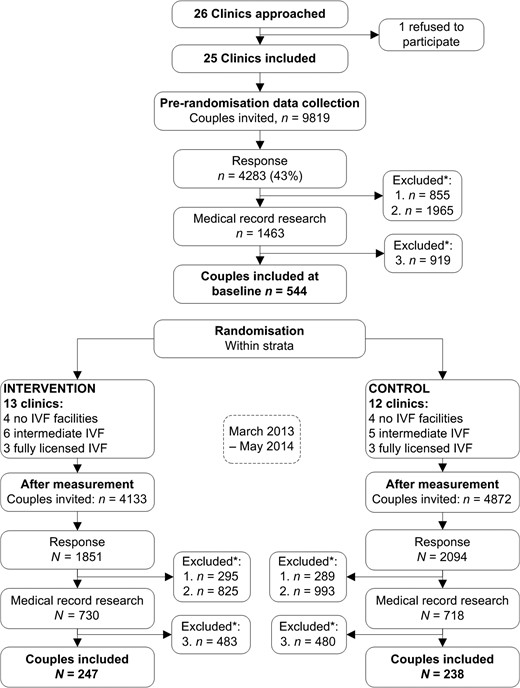
Flowchart and recruitment of the study. *Excluded based on; (1) Couples did not give consent. (2) The five questions in the information letter that were based on some of the exclusion criteria. (3) Couples do not fit the inclusion and exclusion criteria as mentioned in the Materials and Methods section.
Primary outcome
The results of guideline adherence on TEM between the intervention versus control group are presented in Table II. In the intervention group the guideline adherence increased from 49 to 69% (OR 2.66; 95% CI 1.45–4.89); in the control group from 49 to 61% (OR 2.03; 95% CI 1.38–3.00). Multilevel analysis with case-mix adjustment showed that the difference in adherence in the effect measurement of 8% was not statistically significant (OR 1.31; 95% CI 0.67–2.59). The results of the guideline adherence for each clinic separately show that there is a large variation between clinics, especially in the intervention group (Fig. 2).
Guideline adherence and quality indicators for TEM in couples with a good prognosis (>30%) of natural conception within 1 year.
| Intervention group | Control group | Effectiveness intervention | ||||||
|---|---|---|---|---|---|---|---|---|
| Measurement | Baseline N = 300 % (n) | Effect N = 247 % (n) | Adjusted OR [95% CI] | Baseline N = 244 % (n) | Effect N = 238 % (n) | Adjusted OR [95% CI] | Adjusted OR* [95% CI] | ICC (SE) |
| Adherence | ||||||||
| Expectant management period of at least 6 months and correct course of advised treatmenta | 48.7 (146) | 69.2 (171) | 2.66 [1.45–4.89] | 48.8 (119) | 60.9 (145) | 2.03 [1.38–3.00] | 1.31 [0.67–2.60] | 0.01 |
| Quality indicators | ||||||||
| 1. The prognosis of a natural conception was calculatedb | 58.7 (176) | 85.0 (210) | 3.53 [2.43–5.13] | 74.6 (182) | 80.7 (192) | 1.49 [0.94–2.35] | 2.61 [1.44–4.71] | 0.04 |
| 2. The correct course of treatment was advised | 58.0 (174) | 76.5 (189) | 2.44 [1.33–4.46] | 57.4 (140) | 67.6 (161) | 1.97 [1.35–2.87] | 1.26 [0.63–2.52] | 0.01 |
| 3. Correct course of treatment was advised and couples did not start fertility treatment within 6 months. | 85.1 (148) | 90.5 (171) | 1.98 [1.13–3.47] | 85.0 (119) | 90.1 (145) | 1.63 [0.87–3.04] | 1.20 [0.52–2.73] | 0.00 |
aCorrect course of the advised treatment was defined as an expectant period of at least 6 months. This includes couples with a spontaneous pregnancy during this period or couples who started fertility treatment after 6 months.
bThe use of the prognostic model of Hunault (www.zwangerschapskans.nl/www.freya.nl) by the gynaecologist.
*Odds ratio from binary logistic models adjusting for couples’ background characteristics (possible confounders) and baseline variance (only for effectiveness of intervention).
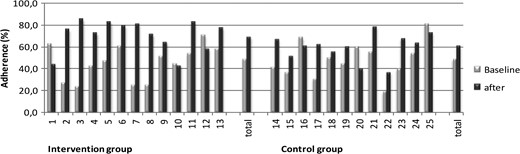
Guideline adherence per clinic. The numbers on the x-axis indicate the 25 Dutch clinics.
Secondary outcomes
Three quality indicators on expectant management
Table II also shows the adherence to the three quality indicators on expectant management. The adherence to the first quality indicator, calculating the prognosis of natural conception, was significantly higher in the intervention group compared to the control group in the effect measurement (20.2%, OR 2.61; 95% CI 1.44–4.71). The adherence to the second and third quality indicators were not significantly different between the intervention and control group.
Treatment-related measures
Table III shows an overview of treatment outcome related measures within 6 months after the fertility work-up. None of the treatment outcome measures showed a significant difference between intervention and control group in the effect measurement. It did show a significant reduction in the number of treatment cycles per couple in the effect measurement compared to the baseline measurement in both groups (intervention: OR 0.61; 95% CI 0.40–0.93, control: OR 0.69; 95% CI 0.52–0.90). The ongoing pregnancy rate did not significantly differ between the baseline and effect measurement in both groups (intervention 26–25%: OR 0.98 [0.66–1.41], control 34–27%: OR 0.75 [0.46–1.20]) but the method of conception did show a significant increase in the percentage of spontaneous conceptions in both groups (intervention 69–86%: OR 3.0 [1.65–5.45], control 68–79%: OR 2.05 [1.21–3.47]).
Treatment-related measures within 6 months after fertility work-up, baseline and effect measurement in both intervention and control group.
| Intervention group | Control group | Effect strategy | |||||
|---|---|---|---|---|---|---|---|
| Baseline | Effect | Adj. OR [95%CI] | Baseline | Effect | Adj. OR [95%CI] | Adj. OR [95%CI] | |
| n = 300 | n = 247 | n = 244 | n = 238 | ||||
| Treatment cycle per couple (no) | 0.87 (262) | 0.55 (136) | 0.61 [0.40–0.93] | 0.92 (225) | 0.67 (160) | 0.69 [0.52–0.90] | 0.92 [0.56–1.50] |
| Type of treatment: | |||||||
| OI | 0.05 (14) | 0.03 (7) | 8 (3.3) | 0.01 (3) | |||
| IUI in natural cycle | 0.29 (88) | 0.14 (34) | 55 (22.5) | 0.21 (50) | |||
| IUI with hormone stimulation | 0.50 (150) | 0.37 (92) | 159 (65.2) | 0.44 (105) | |||
| IVF/ICSI | 0.03 (10) | 0.01 (3) | 3 (1.2) | 0.01 (2) | |||
| Complications, % (no) | |||||||
| Mild OHSS | 0.7 (2) | 2.0 (5) | NA | 2.0 (5) | 0.8 (2) | NA | NA |
| Severe OHSS | 0 | 0 | NA | 0 | 0.4 (1) | NA | NA |
| Twin pregnancy | 1.0 (3) | 0.4 (1) | NA | 1.2 (3) | 0.4 (1) | NA | NA |
| Conception, % (no) | |||||||
| Yesa | 34.0 (102) | 31.6 (78) | 0.78 [0.59–1.05] | 43.0 (105) | 37.8 (90) | 0.70 [0.43–1.15] | 0.89 [0.53–1.51] |
| No | 41.6 (155) | 62.4 (154) | 43.8 (107) | 53.4 (127) | |||
| Unknown | 14.3 (43) | 6.1 (15) | 13.1 (32) | 9.2 (22) | |||
| Pregnancy outcome, % (no) | |||||||
| Ongoingb | 26.3 (79) | 25.1 (62) | 0.98 [0.66–1.41] | 34.4 (84) | 27.3 (65) | 0.75 [0.46–1.20] | 0.72 [0.40–1.27] |
| Miscarriage | 5.3 (16) | 5.3 (13) | 4.9 (12) | 5.9 (14) | |||
| Ectopic pregnancy | 0 | 0 | 0.8 (2) | 1.3 (3) | |||
| Unknown outcomec | 2.3 (7) | 1.2 (3) | 2.8 (7) | 3.4 (8) | |||
| Pregnant: | n = 102 | n = 78 | n = 105 | n = 90 | |||
| Method of conception, % (no): | |||||||
| Spontaneous | 68.6 (70) | 85.9 (67) | 3.00 [1.65–5.45] | 66.7 (70) | 78.9 (71) | 2.05 [1.21–3.47] | 1.46 [0.67–3.16] |
| After treatment | 31.4 (32) | 14.1 (11) | 33.3 (35) | 21.1 (19) | |||
aPregnancy within 6 months was calculated from the end of basic fertility work-up.
bOngoing pregnancy was defined as a pregnancy for >12 weeks.
cUnknown: No follow-up contact/information or <12 weeks pregnant at time of medical record research.
The values that are bold show the significant difference between the baseline and the effect measurement.
OHSS; ovarian hyperstimulation syndrome; OI, ovulation induction.
Discussion
This study shows that the use of a multifaceted implementation strategy did not significantly increase adherence to the guideline regarding expectant management compared to care as usual. The adherence to the guideline recommendations increased in the intervention group but the control group also had an unforeseen improved adherence.
A strength of our study is that we performed a large cluster randomized trial in order to evaluate the multifaceted strategy that targets couples, professionals and organization and to avoid risk of contamination between the intervention and control group. We assured representativeness of the Dutch fertility population because a quarter of all clinics in the Netherland that perform fertility care participated in this trial. Furthermore, the participating clinics were spread across the country and the various types of clinics were represented (IVF facilities no/intermediate/yes).
A second strength of our study is that we recruited new couples that were registered in a financial database with fertility problems and not a preselected group who were already labelled as being eligible for expectant management. The first step of guideline adherence is correctly diagnosing and identifying couples that are eligible for expectant management. We could not assess adherence to the guideline recommendations if we would have recruited participants from a preselected group.
The findings in this report also have limitations. First, the response rate of couples with fertility problems was lower compared to other fertility studies (van Empel et al., 2010; Mourad et al., 2011). This might be a result of the recruitment process. We sent an information letter to all couples presented with fertility problems and not a preselected group of couples with unexplained infertility. After the baseline measurement we performed a non-response research which showed that the responding couples had a higher socio-economic status than non-responders, other background characteristics were similar (Kersten et al., 2015). This means that there is a possible selection bias, but how this might affect guideline adherence is unclear.
A second limitation is that we did not take into account the unexpected improvement of adherence to expectant management in the control group when we calculated the sample size for this study. This is possible due to changes in usual care during the intervention period. As the Dutch government was looking for savings in fertility care, the Dutch Society for Obstetrics and Gynaecology (NVOG) tried to make expectant management obligatory as part of a strategy to improve the cost-effectiveness of fertility care. Furthermore, a Hawthorn effect could be possible; The inclination of people who are the subjects of an experimental study to change or improve the behaviour being evaluated only because it is being studied, and not because of changes in the experiment parameters or stimulus (Sedgwick and Greenwood, 2015). Clinics might have changed their behaviour towards expectant management as a motivational response to participating in this study.
A final limitation is that this study was performed in the Netherlands which makes generalization of our results to other countries questionable because they might have different policies concerning expectant management. We have based our strategy on the specific Dutch guideline recommendations and barriers and facilitators on expectant management (van den Boogaard, et al., 2011b, 2012). Perhaps the barriers are different in other countries. For example, In the Netherlands each citizen has a compulsory basic health insurance that covers all OI/IUI and a maximum of three IVF/ICSI cycles. In other countries different health insurance coverage might apply and, therefore, the incentive to start treatment may be very different for both professionals and couples. Otherwise, the multifaceted strategy could prove to be more effective in countries where there is no strong incentive from the government to abide by the recommendations on expectant management.
The secondary outcomes, i.e. the quality indicators and the treatment-related outcomes, provide further insight in the impact of the strategy and/or the policy change. The first quality indicator showed that in the intervention group there was a significant improvement in the percentage of couples for whom a prognosis of natural conception was calculated compared to the control group (26.3% versus 6.1% [OR 2.61; 95% CI 1.44–4.71]). This shows that the strategy has a positive effect on correctly diagnosing and identifying couples who are eligible for expectant management. However, the lack of effect on the other two quality indicators shows that this does not necessarily lead to a correct recommendation and follow-up on expectant management.
When comparing the baseline and effect measurement in both groups it was shown that the ongoing pregnancy rate was not significantly different but that there were significantly more natural conceptions in the effect measurement and that the number of treatment cycles per couple was also significantly reduced in the effect measurement. This shows that improving the adherence to expectant management reduces the number of fertility treatments without negatively affecting the pregnancy rate.
It is difficult to compare the ongoing pregnancy rates of our study to ongoing pregnancy rates in other RCT's on couples with unexplained infertility for two reasons (Steures et al., 2006; Bensdorp et al., 2015). First, we asked couples to participate in this study after they had already had the basic fertility work-up and possibly already started treatment, were advised an expectant management, or even achieved a pregnancy. It is possible that couples who already achieved a pregnancy were less inclined to respond compared to couples who were still trying to get pregnant. Second, we have missing data on the pregnancy rate because for some couples who were advised expectant management there was no follow-up contact after the fertility work-up and they did not respond to the questionnaire we sent. Both factors can potentially lead to an underestimation of the pregnancy rate in our study population.
To design a potentially effective strategy before disseminating it to other clinics, it is crucial to use a detailed breakdown of the implementation processes of this unsuccessful intervention. Process evaluations can clarify the mechanisms responsible for the result obtained in the intervention group. It enables researchers and implementers to check actual exposure to the intervention, and describe the experience of those exposed (Hulscher et al., 2003). Our results showed that there is a great variance in improved adherence between the clinics in the intervention group (range: −19 to 62%). This shows that there are clinics that had a decrease in adherence despite the effort to increase it. Therefore, it needs to be assessed if this is related to the level of exposure to the strategy, the usefulness of the different tools, or other local barriers. Based on an extensive process evaluation, those tools that are potentially effective and positively rewarded can be selected and used on a national scale.
In conclusion, our results show that implementation of expectant management for couples with unexplained infertility is necessary and feasible. A policy change alone can be effective in achieving improved implementation. In this study we did not find a significant additional effect from a multifaceted implementation strategy.
Supplementary data
Supplementary data are available at Human Reproduction online.
Acknowledgements
The Improvement study group: P.G. Hompes (VUmc, Amsterdam), J.P. de Bruin (Jeroen Bosch Ziekenhuis, Den Bosch), C.H. de Koning (Tergooiziekenhuizen), E. Tepe (Slingeland Ziekenhuis, Doetinchem), A.P. Manger (Diakonessenhuis, Utrecht), G.J.J.M. Muijsers (ziekenhuis Rivierenland, Tiel), J. Kwee (Sint Lucas Andreas Ziekenhuis, Amsterdam), W.K. Kuchenbecker (Isala Klinieken, Zwolle), G.J. Scheffer (Gelre Ziekenhuis, Apeldoorn), J.M. van Rijn (Medisch Centrum Alkmaar, Alkmaar), I.A. van Rooij (TweeSteden ziekenhuis, Tilburg), A. Hoek (UMCG, Groningen), A. Sluijmer (Wilhelmina Ziekenhuis, Assen), T. Spinder (Medisch Centrum Leeuwarden, Leeuwarden), J.H. Vollebergh (Ziekenhuis Bernhoven, Oss), E. Scheenjes (Ziekenhuis Gelderse Vallei, Ede) and J.M. van der Ploeg (Maasziekenhuis Pantein, Boxmeer). Furthermore, we would like to acknowledge Eddy M. Adang for his contribution.
Authors’ roles
R.P.G.M.H., B.W.J.M., D.D.M.B., M.G., N.M.v.d.B., W.L.D.M.N. and F.A.M.K. were involved in conception and design of the study. F.A.M.K. led data collection, performed data analysis and interpretation, and wrote this manuscript. R.P.G.M.H. and W.L.D.M.N. contributed substantially to data-interpretation and manuscript revisions. M.G., M.M.v.R., J.Int.H., H.R.V., M.J.P., D.E.S.B., J.G., F.J.M.B., C.A.K., B.W.J.M. and D.D.M.B. contributed to data-interpretation and provided critical revision. All authors read and approved the final manuscript.
Funding
Supported by The Netherlands Organisation for Health Research and Development (ZonMW, project number 171203005).
Conflict of interest
None declared.
