


Abstract
What are the differences and similarities of pharmacokinetic (PK) and pharmacodynamic (PD) characteristics of the novel recombinant human FSH follitropin epsilon expressed in the human cell line GlycoExpress compared with a Chinese hamster ovary (CHO) derived compound and a urinary derived product?
Overall follitropin epsilon, with a fully human glycosylation, shows a comparable PK profile at single-dose as well as multiple-dose administration compared to recombinant CHO-derived FSH as well as urinary derived FSH, whereas the PD properties differ from product to product with follitropin epsilon being most active in PD parameters.
Recombinant FSH produced in CHO and FSH obtained from the urine of postmenopausal women show comparable PK and PD properties. However, more recently a comparative study of a recombinant FSH produced in the human cell line PerC6 and a CHO-derived FSH preparation revealed differences in PK and PD properties of the molecule.
Both studies were randomized, placebo- and comparator-controlled, single-blind phase I studies in healthy pituitary-suppressed female volunteers aged 18 and 40 years. The single-dose, dose escalation study included 19 women (April 2011 to September 2011) with three ascending dose levels per subject or placebo/comparators with a 14-day washout phase between dosings. The multiple-dose study included 57 women (October 2011 to April 2012) in five cohorts with three dose levels versus placebo and two comparators. Randomization to the respective treatment was performed after successful downregulation of the pituitary gland prior to Investigational Medicinal Product dosing.
In the single-dose study, 12 subjects received follitropin epsilon (25, 75, 150 and 300 IU) in three of four possible ascending doses and seven subjects received one dose of two comparators (150 IU Bravelle and 150 IU Gonal-f) and placebo in random order in each treatment period. In the multiple-dose study, 30 subjects received follitropin epsilon (75 IU or 150 IU once daily [QD], or 150 IU every other day [QAD], 10 subjects each) and 27 subjects received 150 IU Gonal-f, 150 IU Bravelle, or placebo for 7 days (11/10/6 subjects). Blood samples for measuring PK as well as PD parameters were collected systematically before, during and after dosing. Adverse events (AEs) and other relevant safety parameters were recorded. Data were summarized using descriptive statistics.
The single- and multiple-dose PK parameters maximum concentration (Cmax) and area under the concentration-time curve (AUC0-last) increased in a linear fashion with increasing dose levels of follitropin epsilon. Follitropin epsilon showed PK characteristics comparable to the comparators indicating that well established treatment schemes could be applied. There was a dose-response effect of single and multiple doses of follitropin epsilon on follicular growth, which was shown for the biomarker inhibin B as well as for the mean number and size of follicles. Multiple doses of 75 IU follitropin epsilon given daily, as well as 150 IU follitropin epsilon every second day, showed a follicle growth comparable with 150 IU Gonal-f given daily, while in case of daily administration of 150 IU Bravelle only weak follicle stimulation was observed. Multiple doses of 150 IU follitropin epsilon induced a much higher follicle growth compared to the same dose of Gonal-f. All single and multiple follitropin epsilon doses tested were safe and well tolerated, and overall there were no relevant differences between follitropin epsilon and the comparators in terms of safety. The average number of AEs increased with increasing dose levels. No clinically relevant abnormalities were reported for any of the other safety parameters assessed. No follitropin epsilon anti-drug antibodies were observed.
The studies were conducted as a single-blind design. Hormone levels or other parameters assessed in serum are generally not considered as being subject to bias. Other assessments directly performed by the investigators, such as transvaginal ultrasound assessments, may have been subject to personal bias. No prospective calculations of statistical power had been made, as is common practice for first in human and early phase I studies in healthy volunteers.
These early development studies showed that follitropin epsilon exhibits comparable PK characteristics, as well as inducing stronger PD effects in terms of follicle growth and serum inhibin B, than the comparators. Follitropin epsilon induced a dose-dependent increase in follicular growth. The results warrant further studies with this new fully human recombinant FSH.
The studies were sponsored by GLYCOTOPE GmbH, Berlin, Germany.
K.A-E. is an employee of QPS-Netherlands, B.V., which received funding for the studies from Glycotope GmbH; I.D. and C.K. are employees of Dinox B.V., which received funding for the studies from Glycotope GmbH; L.S. and S.G. are employees and shareholders of Glycotope GmbH; B.D. and K.E. are employees of Glycotope GmbH.
www.clinicaltrials.gov: NCT01354886 (single-dose); NCT01477073 (multiple-dose).
The single-dose trial was registered on 11 May 2011 while the multiple-dose trial was registered on 09 November 2011.
First subject was enroled in the single-dose trial in 27 April 2011 and in the multiple-dose trial in 02 October 2011.
Introduction
FSH is a glycoprotein belonging to the group of pituitary gonadotrophin hormones (Baenziger and Green, 1988) and exerts its action through binding to and activation of the FSH-receptor which is found in the ovary (Simoni et al., 1997), testis (Asatiani et al., 2002), and uterus (La et al., 2005). Currently two groups of FSH molecules are on the market: FSH recombinantly produced in Chinese hamster ovary (CHO) cells (Group, 1998), and FSH isolated from the urine of postmenopausal women (Giudice et al., 1994). Both types of product comprise disadvantages resulting from either a non-human glycosylation pattern for the recombinant products (Gervais et al., 2003), batch-to-batch variations due to differing primary material and concerns about viral safety for the urinary products (WHO, 2003) or an altered glycosylation characteristic due to liver clearance of a subset of isoforms prior to renal excretion. Since it has been shown, that the glycosylation pattern is important for the functioning of FSH (Ulloa-Aguirre et al., 1999; Wide et al., 2007), follitropin epsilon (former development name: FSH-GEX) was designed as a fully human molecule with optimized human glycosylation as an alternative to the marketed products.
To obtain the fully human and optimized glycosylation, follitropin epsilon is produced in the GlycoExpress system (GEX), consisting of a human cell expression system suitable for pharmaceutical production and for glycosylation optimization and adjustment.
The aim of these studies was to assess the safety, tolerability, the pharmacokinetic (PK) and pharmacodynamic (PD) properties of follitropin epsilon in comparison to marketed recombinant and urinary products. At present, marketed FSH's show comparable PK and PD properties (Porchet et al., 1993; le Cotonnec et al., 1994; Karlsson et al., 1998). A comparative PK study between a recombinant FSH produced in the human cell line PerC6, with glycosylation properties different from follitropin epsilon, and a CHO-derived FSH preparation revealed differences in PK and PD characteristics of the molecule (Olsson et al., 2014).
Materials and Methods
Study population
The studies were performed in healthy female volunteers according to the Declaration of Helsinki for Medical Research involving Human Subjects. The studies were approved by an Independent Ethics Committee in Assen, the Netherlands, and all subjects gave written informed consent prior to participation. Main inclusion criteria were: age between 18 and 40 years, body weight of minimally 50.0 kg with a BMI between 18.0 and 29.0 kg/m2, use of oral contraceptives for at least one cycle. Major exclusion criteria were: Smoking, abuse of alcohol or drugs, history of (or current) endocrine abnormalities, history or presence of any malignancy, history or presence of impaired renal function and clinical evidence of liver pathology.
Treatment
Subjects in both studies started downregulation of the pituitary gland after a pill-free period of 3 days using combined oral contraceptives (Marvelon; Merck Sharp & Dohme) administered up to 21 days prior to treatment with FSH and continued until the end of study visit to suppress endogenous gonadotrophin secretion. Prior to treatment the plasma FSH levels were measured to verify for adequate downregulation, defined as plasma FSH ≤ 1 IU/L in the single-dose study and plasma FSH ≤ 2 IU/L in the multiple-dose study. Follitropin epsilon was administered into the subcutaneous (s.c.) tissue of the lower abdominal wall. Local tolerance was assessed at different time points after dosing.
Single-dose study
Nineteen subjects were randomized to either receive follitropin epsilon or comparator/placebo using a computer-generated list. The cohorts followed a three-period design with 14 days washout phases in between. Study drugs were administered on days 22, 36 and 50. The volunteers were randomized to cohorts of six subjects each receiving 25 IU, 75 IU and 150 IU follitropin epsilon or 75 IU, 150 IU and 300 IU follitropin epsilon or the comparator cohort receiving 150 IU follitropin alfa (Gonal-f, Merck-Serono), 150 IU urofollitropin (Bravelle, Ferring) and one dose of placebo in random order (Fig. 1 and Supplementary Fig. S1).

Subject flow diagram (single-dose study). *Owing to the drop-out and replacement, the Comparators/Placebo group consisted of seven subjects for all screening data. However, the number of subjects within the dosing groups Gonal-f, Bravelle and Placebo was 6. The first period of the drop-out subject, and second and third period of the replacement subject were included in the analysis. IU, international unit; n, number of subjects.
Multiple-dose study
Fifty-seven subjects were randomized either to be administered follitropin epsilon (30 subjects) or one of two comparators Gonal-f or Bravelle, or placebo in random order (27 subjects) using a computer-generated list.
In the follitropin epsilon treatment groups, 10 subjects each received either daily doses (QD) of 75 IU or 150 IU, or every second day (QAD) doses of 150 IU starting from day 22 until day 28. According to the single-blinded character of the study, subjects who received 150 IU QAD follitropin epsilon were dosed with placebo in the days between active treatments. Subjects who received 150 IU QAD received four administrations whereas in the QD groups the subjects received seven administrations. Of the 27 subjects who were dosed with the comparators or placebo, 11 subjects received 150 IU QD Gonal-f, 10 subjects received 150 IU QD Bravelle, and six subjects received placebo QD (Fig. 2 and Supplementary Fig. S2).
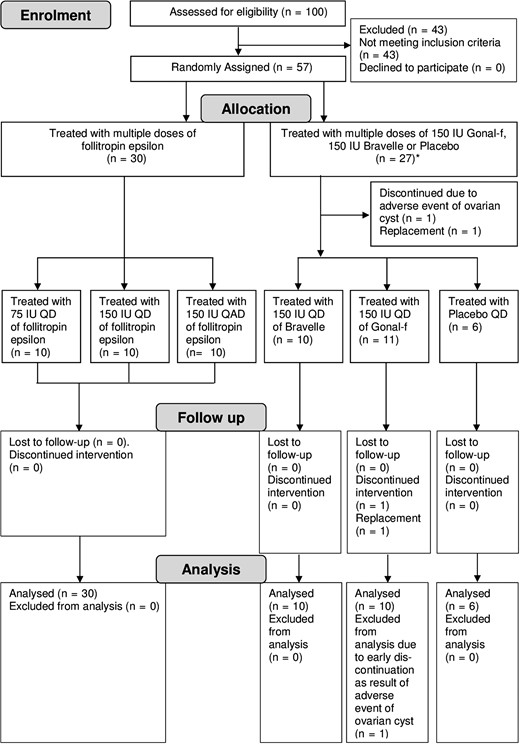
Subject flow diagram (multiple-dose study). *Owing to the drop-out and replacement, the Comparators/Placebo group consisted of 27 subjects for all screening data. However, the number of subjects within the dosing groups Gonal-f, Bravelle and Placebo was 26. QD, once daily; QAD, every other day.
Study drug
Commercially available Gonal-f and Bravelle were used according to the manufacturer's instructions. Follitropin epsilon was provided as a phosphate-buffered solution in a single-use vial for injection. For all three products the FSH activity (IU) is based on the measurement developed by Steelman and Pohley (Steelman and Pohley, 1953).
Assays
Analysis of plasma FSH concentration was performed by validated assays for each analyte using the Immulite 2000 System (Siemens Healthcare, Germany).
Analysis of inhibin B was performed using the commercially available inhibin B Gen II ELISA (Beckman Coulter, USA) according to the manufacturer's instructions. Analyses of 17ß-estradiol (E2) and LH were performed using the Immulite 2000 System (Siemens Healthcare, Germany) according to the manufacturer's instructions.
PK evaluation
The maximum plasma concentration (Cmax) and the time of its occurrence (Tmax) were derived from the measured plasma concentration data. NCmax and NAUC0-last represent the dose-normalized Cmax and AUC0-last and are calculated by Cmax /dose and AUC0-last/dose. The terminal half-life (t1/2) was calculated by linear regression analysis of the log-linear phase of the concentration-time curve by non-compartmental methods using WinNonlin, version 4.1 (Pharsight Corporation Inc., Mountain View, CA, USA)
Measurements
For the single-dose trial blood sampling for PK and PD (inhibin-B, E2) evaluation was performed pre dose and post-dose at fixed time points until 240 h post-dose. Transvaginal ultrasonography (TVUS) was performed pre dose as well as daily, starting 48 h after the gonadotrophin administration, by two examiners in order to minimize measurement bias.
For the multiple-dose trial PK and PD sampling was undertaken pre dose, and in a daily manner starting from first administration for the next 13 days and continued every second day for eight more days. Blood sampling for PK and PD (inhibin-B, E2 and LH) evaluation was performed pre dose on days 22 until 28. TVUS was performed pre dose (on day 20), 48 h after the first gonadotrophin administration as well as daily, starting at day 4 (96 h) after the first gonadotrophin administration for at least 10 days. TVUS was discontinued if all follicles were <8 mm.
Statistical methods
Explorative statistical analyses were performed in both trials; therefore sample size was not based on a formal calculation.
For the valid case population in the single-dose study, drop-outs who completed at least one complete treatment profile were included in the valid case population for that specific treatment. The same applied to replacement subjects. In the multiple-dose study the valid case population included all subjects who completed the full multi-dose regimen and the full PK and PD sampling.
PD and PK parameters were analysed by descriptive statistics. Follicle sizes were additionally converted to size classes 6.0–7.9 (only in the single-dose study), 8.0–9.9, 10.0–11.9, 12.0–13.9, 14.0–15.9, 16.0–17.9, 18.0–19.9 and >19.9 mm. For PK parameters, a one-way ANOVA was performed to test the dose proportionality of Cmax and AUC0-last using the normalized values NCmax and NAUC0-last. The dose independence of t1/2 and differences between the three different FSH preparations dosed at 150 IU were also tested by one-way ANOVA.
Results
Subject characteristics
Subject disposition and demographics
Single-dose: Forty-one female subjects were screened and 19 were randomized. One subject in the comparator group discontinued after the first treatment period due to poor venous accessibility. She was replaced by another subject for periods 2 and 3. Therefore, the comparators/placebo group consisted of seven subjects for all screening data, but of six subjects for all treatment groups and the safety evaluation (Fig. 1).
Multiple-dose: One hundred female subjects were screened and 57 found eligible were randomized. Fifty-six subjects completed the study, one subject in the Gonal-f arm was discontinued from the study due to an unrelated adverse event (AE) of ovarian cyst (Fig. 2).
The mean age, weight and BMI within the different treatment groups were similar in both studies (Supplementary Tables S1 and S2).
PK parameters
Single-dose s.c. PKs
PKs results after single-dose of 25 IU, 75 IU, 150 IU and 300 IU follitropin epsilon indicate that there is dose proportionality for AUC0-last and Cmax (Fig. 3A). After 150 IU follitropin epsilon the mean peak concentration was 5.2 mUI/mL and AUC0-last was 343.1 h*mIU/mL, similar to those values found after a single-dose of 150 IU Bravelle. In comparison, PK parameters of Gonal-f were slightly lower, with a Cmax of 4.2 mUI/mL and AUC0-last of 289.7 h*mIU/mL (Fig. 3B). However, statistical analysis of the dose-normalized values revealed no statistically significant difference between the three compounds dosed 150 IU. The Tmax of Gonal-f (23.0 h) was comparable to 150 IU follitropin epsilon (22.4 h) and Bravelle (22.7 h). The serum half-life (t1/2) was comparable for the recombinant products (follitropin epsilon and Gonal-f) and higher for Bravelle (Table I).
Summary of PK parameters after single-dose and multiple-dose administration of follitropin epsilon, Gonal-f and Bravelle in healthy women.
| Study | Treatment | Mean values (SD) | Dose-normalized values mean values (SD)* | ||||
|---|---|---|---|---|---|---|---|
| AUC0-last (h*mIU/mL) | Cmax (mIU/mL) | Tmax (h) | t1/2 (h) | NAUC0-last (h*mIU/mL/IU) | NCmax (mIU/mL/IU) | ||
| Single-dose | Follitropin epsilon (25 IU) N = 6 | 41.7 (9.4) | 0.9 (0.2) | 14.4 (5.6) | 30.9 (15.8) | 1.7 (0.4) | 0.04 (0.0084) |
| Follitropin epsilon (75 IU) N = 12 | 161.3 (29.9) | 2.5 (0.4) | 19.0 (6.0) | 33.9 (9.0) | 2.2 (0.4) | 0.03 (0.0055) | |
| Follitropin epsilon (150 IU) N = 12 | 343.1 (45.4) | 5.2 (0.9) | 22.4 (7.0) | 29.1 (5.5) | 2.3 (0.3) | 0.03 (0.0058) | |
| Follitropin epsilon (300 IU) N = 6 | 657.2 (96.9) | 9.8 (1.9) | 23.7 (7.3) | 36.5 (6.9) | 2.2 (0.3) | 0.03 (0.0063) | |
| Bravelle (150 IU) N = 6 | 394.5 (160.8) | 5.2 (1.2) | 22.7 (8.2) | 46.5 (10.2) | 2.6 (1.1) | 0.03 (0.0080) | |
| Gonal-f (150 IU) N = 6 | 289.7 (109.1) | 4.2 (1.2) | 23.0 (5.9) | 36.6 (7.4) | 1.9 (0.7) | 0.03 (0.0083) | |
| Mutiple-dose | Follitropin epsilon (75 IU) N = 10 | 420.1 (77.2) | 5.8 (1.3) | 10.4 (6.9) | 42.4 (21.4) | 0.8 (0.1) | 0.01 (0.003) |
| Follitropin epsilon (150 IU) N = 10 | 824.9 (254.8) | 13.0 (3.9) | 10.0 (1.9) | 32.9 (5.5) | 0.8 (0.2) | 0.01 (0.004) | |
| Follitropin epsilon (150 IU QAD) N = 10 | 504.0 (136.5) | 7.3 (2.0) | 18.4 (7.3) | 33.9 (2.2) | 0.8 (0.2) | 0.01 (0.003) | |
| Gonal-f (150 IU) N = 9 | 917.4 (206.4) | 12.3 (3.3) | 9.3 (2.0) | 36.1 (4.2) | 0.9 (0.2) | 0.01 (0.003) | |
| Bravelle (150 IU) N = 10 | 1172.1 (203.7) | 13.4 (2.0) | 11.0 (5.1) | 53.8 (16.5) | 1.1 (0.2) | 0.01 (0.002) | |
*Normalized values based on total administered dose.
NAUC0-last: normalized value of area under the concentration-time curve up to the last measurable concentration.
NCmax: normalized maximum concentration.
AUC0-last: area under the concentration-time curve up to the last measurable concentration.
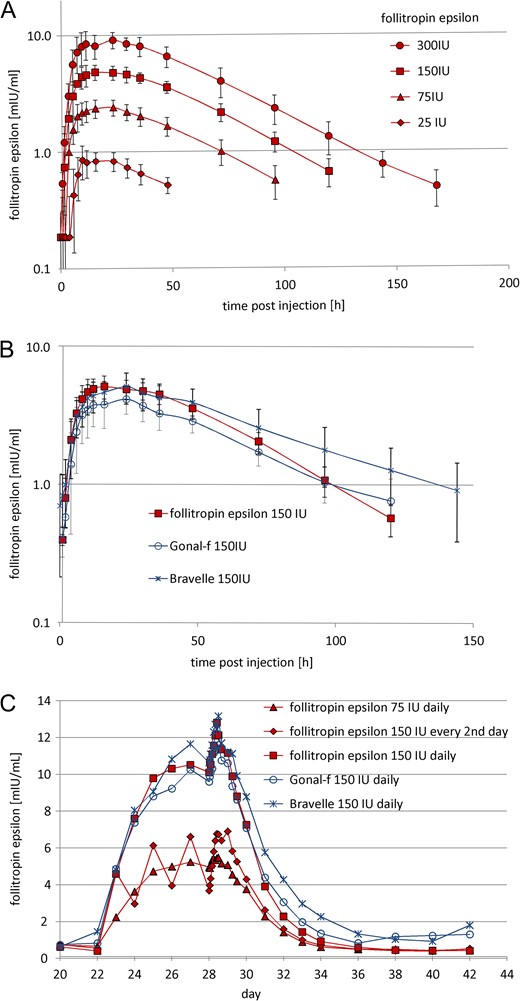
Mean plasma FSH concentration versus time plots. Mean (±SD) plasma FSH concentration versus time plots after (A) a single-dose (s.c.) of 25 (n = 6), 75 (n = 12), 150 (n = 12) and 300 (n = 6) IU follitropin epsilon, (B) after 150 IU follitropin epsilon, 150 IU Bravelle (n = 6) and 150 IU Gonal-f (n = 6). Mean plasma FSH concentration versus time plots (C) during multiple dosing and after the last of multiple doses (s.c.), 75 (n = 10), 150 (n = 10) and 150 IU QAD (n = 10) follitropin epsilon, 150 IU Bravelle (n = 10) and 150 IU Gonal-f (n = 9). Treatment was administered from day 22 until day 28.
Multiple-dose s.c. PKs
The mean Cmax values of the 150 IU QD doses of follitropin epsilon, Gonal-f, and Bravelle were comparable, with 13.0 (95% CI 10.6–15.4), 12.3 (95% CI 10.1–15.4) and 13.4 (95% CI 10.1–16.7) mIU/mL, respectively.
The times to reach the peak plasma FSH levels (Tmax) in the follitropin epsilon dosing groups were comparable for the dose groups which were administered daily (10.0 and 10.4 h) and longer (18.4 h) for the 150 IU follitropin epsilon QAD dose group (Table I and Fig. 3C). The FSH trough concentrations reached steady state level 3 to 5 days after first dose for all dose groups. Follitropin epsilon plasma levels of the 150 IU QAD group showed a characteristic which may be described as oscillating around those of the 75 IU QD group, mirroring their dosing scheme.
PD parameters
LH
In the single and multiple-dose study the treatment groups’ mean LH concentrations were below 0.28 IU/L at all measured time points, indicating adequate pituitary suppression throughout the study (Hall et al., 1990).
Single-dose
Follicular growth
The percentage of responders (subjects with at least one follicle ≥6 mm present at one of the TVUS measurements after treatment) in the single-dose trial increased with an increasing dose level of follitropin epsilon. Follicles of 8.0–9.9 mm were only present after treatment with 300 IU follitropin epsilon in the single-dose trial.
Serum pd marker
Inhibin B response increased with increasing doses of follitropin epsilon (Table II). Single doses of 75 IU, 150 IU and 300 IU follitropin epsilon elicited distinct inhibin B responses, dose dependent from 16.1 pg/mL up to 121.3 pg/mL. Inhibin B levels returned to baseline after 48–72 h dependent on the dose applied. Inhibin B levels after Bravelle and Gonal-f treatment peaked 24 h post-dose at 11.4 pg/mL and 28.5, respectively. The single-dose treatment did not lead to a relevant increase in serum estradiol level in any of the dose groups.
Summary of inhibin-B serum level after single-dose administration of follitropin epsilon, placebo, Gonal-f and Bravelle in healthy women.
| Follitropin epsilon | Placebo | Gonal-f | Bravelle | ||||
|---|---|---|---|---|---|---|---|
| Dose | 25 IU | 75 IU | 150 IU | 300 IU | 150 IU | 150 IU | |
| Inhibin B (pg/mL)* | <9.4 | 16.1 (14.1) | 36.2 (44.2) | 121.3 (123.0) | 10.5 (7.6) | 28.5 (30.3) | 11.4 (10.5) |
| Peak time (h) | n.a. | 24 | 48 | 72 | 96 | 24 | 24 |
*Mean values (SD).
Multiple-dose
Follicular growth
In the multiple-dose study a responder was defined as a subject who had at least one follicle ≥8 mm present during at least one of the TVUS measurements. After treatment with follitropin epsilon over 7 days, follicular growth was observed in all subjects of the 150 IU QD follitropin epsilon dosing group (100.0%), in nine subjects of the 75 IU QD follitropin epsilon dosing group (90.0%), and in nine subjects of the 150 IU QAD follitropin epsilon dosing group (90.0%). Follicular growth occurred in nine subjects of the Gonal-f group (100.0%) and in only four of the Bravelle group (40.0%).
Figure 4A displays the mean number of follicles ≥8 mm over time for each treatment group.
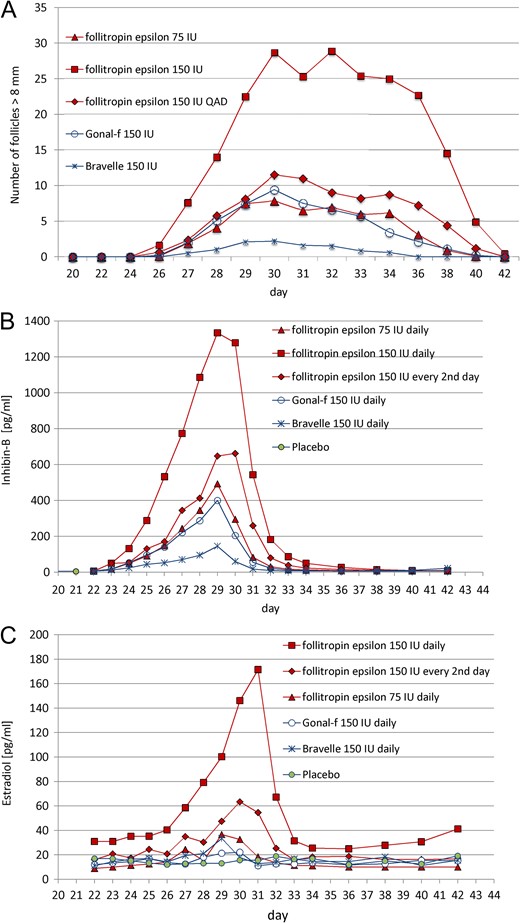
Follicle growth, inhibin-B and estradiol plasma concentration during and after multiple-dose administration. Seven doses of 75 IU QD follitropin epsilon (n = 9), 150 IU QD follitropin epsilon (n = 10), 150 IU QD Bravelle (n = 4) and 150 IU QD Gonal-f (n = 9) as well as placebo (n = 6). Four doses of 150 IU QAD follitropin epsilon with placebo in between (n = 9). (A) Number of follicles >8 mm measured by ultrasound. (B) Plasma inhibin-B level (pg/mL). (C) Plasma estradiol level (pg/mL) during and after dosing. Treatment was administered from day 22 until day 28. Data are mean values.
The largest mean number of follicles ≥8 mm was observed in the 150 IU QD follitropin epsilon group (29 follicles), followed by the 150 QAD group (13 follicles) and the 75 IU group (nine follicles). In comparison, six and nine follicles were observed in the Bravelle and Gonal-f groups, respectively (Supplementary Figs S3 and S4).
Dosing with 150 IU follitropin epsilon, for both QD and QAD the follicles grew up to 18.0–19.9 mm, whereas the dosing with 75 IU only stimulated the follicles to grow up to a size of 14.0–15.9 mm: the latter corresponded with the stimulation in the Gonal-f group, but not with the Bravelle group in which the maximum size observed was only 10.0–11.9 mm.
Inhibin B
After the last of the multiple doses given, the maximum mean level of inhibin-B rose by more than twice as high after 150 IU QD (1334.1 pg/mL) in comparison with 75 IU QD (492.6 pg/mL), whereas 150 IU QAD follitropin epsilon induced an increase slightly above 75 IU QD (662.1 pg/mL). While 150 IU Gonal-f provoked a similar response (399.8 pg/mL) as 75 IU follitropin epsilon QD, 150 IU Bravelle elicited only a small response (145.6 pg/mL). The peak of the serum inhibin-B levels was reached at 24 h after last injection, except in the follitropin epsilon QAD treatment, which was reached after 48 h. Seven to ten days after the last FSH administration the inhibin-B levels returned back to baseline levels (Fig. 4B).
Estradiol
The response of E2 to ovarian stimulation with follitropin epsilon was dose-related, but disproportional in contrast to the inhibin reaction—more than 4-fold higher after 150 IU QD compared with 75 IU, and more than 2-fold higher compared with 150 IU QAD (Fig. 4C). Surprisingly, Gonal-f did not elicit an E2 response, whereas Bravelle provoked a response comparable to 75 IU follitropin epsilon.
Safety
Overall, there were no differences between follitropin epsilon and the comparators in terms of safety. The severity of the AEs did not differ between the different treatment groups, and all AEs were of mild or moderate intensity.
Single-dose
Fifteen out of 19 subjects experienced at least one AE which were all mild or moderate. AEs were equally distributed between subjects receiving follitropin epsilon and those receiving comparator compounds or placebo (66.7% each). The most often reported AEs were headache (8/19 subjects), metrorrhagia (5/19), and vaginal haemorrhage (5/19).
Multiple-dose
The most frequently reported AEs with a possible relationship to the study medication were headache (20/57 subjects), abdominal pain (16/57), fatigue (8/57) and metrorrhagia (8/57). The percentage of subjects experiencing at least one AE after receiving multiple doses of follitropin epsilon increased with ascending dose levels of follitropin epsilon.
Discussion
The PK parameters Cmax and AUC of follitropin epsilon showed clear linearity over the dose levels in the single and multiple-dose trials (Fig. 3A and B). When comparing the plasma concentration versus time plots of 150 IU QD follitropin epsilon with 150 IU QD of the comparators Bravelle and Gonal-f, a similar concentration-time plot of the three compounds was observed (Fig. 3B).
As can be seen in the single-dose, and even more pronounced in the multiple-dose trial, follitropin epsilon dosed equally had a stronger effect on follicle growth than both comparator compounds. Not only was the size of the follicles was larger but also the number of stimulated follicles. Equivalent doses of Gonal-f and Bravelle elicited a smaller response. With respect to follicle size and numbers, 75 IU follitropin epsilon most closely resembled 150 IU Gonal-f, both given daily, whereas 150 IU follitropin epsilon given every second day produced an even slightly stronger effect. Interestingly, while all products and dosages led to responses in all or nearly all volunteers, Bravelle achieved induction of follicle growth in only a few volunteers with a lower size and number of follicles than in all other groups.
A clear dose-response effect of follitropin epsilon on inhibin B and E2 levels was observed. Inhibin B and E2 are produced by maturing follicles and can therefore be considered as a biomarker for follicular growth (Fried et al., 2003; Hohmann et al., 2005; Roudebush et al., 2008). Multiple-dose administration of 150 IU QD follitropin epsilon induced a much stronger inhibin B response compared to the same dose of either of the comparators. Interestingly, follitropin epsilon induced inhibin B as well as E2, while Gonal-f induced inhibin B with only a minor effect on E2, and Bravelle reacted inversely. The follicular response apparently correlated solely with the inhibin B levels in this study.
The data obtained on follicle growth as well as the serum marker inhibin B indicate that 75 IU QD follitropin epsilon induced a response in follicle stimulation comparable with 150 IU QD Gonal-f. Follitropin epsilon 150 IU QAD resembles the daily dosing of 75 IU follitropin epsilon and 150 IU Gonal-f with a somewhat more pronounced effect on follicle size, follicle numbers and inhibin B allowing for an alternative dosing schedule.
The low PD response with Bravelle as compared to Gonal-f and follitropin epsilon was not expected. This low response is not in conformity with results from previous clinical studies in IVF patients (Dickey et al., 2003). One batch of Bravelle was used in each study, and it may be that the low response was related to potential batch-to-batch inconsistencies of the preparation, which could be a disadvantage associated with urinary products. However, the fact that a lower response was seen in both studies may indicate that the lower response is inherent to the product.
Our findings are in line with those for a different FSH compound produced in a human cell line. Olsson and coworkers described a recombinant molecule produced in the human cell line PerC6 (Olsson et al., 2014, 2015). However, whereas the aforementioned study demonstrated a higher Cmax and a longer half-life for that human FSH product, we found major differences for follitropin epsilon only with regard to PD parameters. The differences seen for both molecules indicate that the human glycosylation patterns present on these molecules play an important role in their action on the FSH-receptor and that differences not only exist between material from human cells versus CHO-derived or urinary derived compounds but also between compounds from different human production lines.
Hence, follitropin epsilon is a promising alternative FSH product that combines the advantages of safe and reliable recombinant production with the optimized human glycosylation resulting in improved PD activities at comparable PKs. A phase II dose finding trial in patients in which alternative treatment regimens were also investigated has been successfully accomplished and will be reported separately.
Supplementary data
Supplementary data are available at Human Reproduction online.
Acknowledgements
The authors would like to thank all investigators and staff of the study centre involved in the studies for their effort in conducting these clinical trials.
Authors’ roles
All authors contributed significantly to the studies conception and design. K.A-E., I.D. and C.K. executed the studies. B.D. and K.E. supervised the conduct. All authors interpreted the data. All the authors were involved in revising the manuscript for important intellectual content and approving the final version for publication.
Funding
The studies were funded by Glycotope GmbH, Germany.
Conflict of interest
K.A-E. is an employee of QPS-Netherlands, B.V. which received funding for the studies from Glycotope GmbH; I.D. and C.K. are employees of Dinox B.V., which received funding for the studies from Glycotope GmbH; L.S. and S.G. are employees and shareholders of Glycotope GmbH; B.D. and K.E. are employees of Glycotope GmbH.
