


Abstract
Does a reduced FSH dose in women with a predicted hyper response, apparent from a high antral follicle count (AFC), who are scheduled for IVF/ICSI lead to a different outcome with respect to cumulative live birth rate and safety?
Although in women with a predicted hyper response (AFC > 15) undergoing IVF/ICSI a reduced FSH dose (100 IU per day) results in similar cumulative live birth rates and a lower occurrence of any grade of ovarian hyperstimulation syndrome (OHSS) as compared to a standard dose (150 IU/day), a higher first cycle cancellation rate and similar severe OHSS rate were observed.
Excessive ovarian response to controlled ovarian stimulation (COS) for IVF/ICSI may result in increased rates of cycle cancellation, the occurrence of OHSS and suboptimal live birth rates. In women scheduled for IVF/ICSI, an ovarian reserve test (ORT) can be used to predict response to COS. No consensus has been reached on whether ORT-based FSH dosing improves effectiveness and safety in women with a predicted hyper response.
Between May 2011 and May 2014, we performed an open-label, multicentre RCT in women with regular menstrual cycles and an AFC > 15. Women with polycystic ovary syndrome (Rotterdam criteria) were excluded. The primary outcome was ongoing pregnancy achieved within 18 months after randomization and resulting in a live birth. Secondary outcomes included the occurrence of OHSS and cost-effectiveness. Since this RCT was embedded in a cohort study assessing over 1500 women, we expected to randomize 300 predicted hyper responders.
Women with an AFC > 15 were randomized to an FSH dose of 100 IU or 150 IU/day. In both groups, dose adjustment was allowed in subsequent cycles (maximum 25 IU in the reduced and 50 IU in the standard group) based on pre-specified criteria. Both effectiveness and cost-effectiveness were evaluated from an intention-to-treat perspective.
We randomized 255 women to a daily FSH dose of 100 IU and 266 women to a daily FSH dose of 150 IU. The cumulative live birth rate was 66.3% (169/255) in the reduced versus 69.5% (185/266) in the standard group (relative risk (RR) 0.95 [95%CI, 0.85–1.07], P = 0.423). The occurrence of any grade of OHSS was lower after a lower FSH dose (5.2% versus 11.8%, RR 0.44 [95%CI, 0.28–0.71], P = 0.001), but the occurrence of severe OHSS did not differ (1.3% versus 1.1%, RR 1.25 [95%CI, 0.38–4.07], P = 0.728). As dose reduction was not less expensive (€4.622 versus €4.714, delta costs/woman €92 [95%CI, −479–325]), there was no dominant strategy in the economic analysis.
Despite our training programme, the AFC might have suffered from inter-observer variation. Although strict cancellation criteria were provided, selective cancelling in the reduced dose group (for poor response in particular) cannot be excluded as observers were not blinded for the FSH dose and small dose adjustments were allowed in subsequent cycles. However, as first cycle live birth rates did not differ from the cumulative results, the open design probably did not mask a potential benefit for the reduced dosing group. As this RCT was embedded in a larger cohort study, the power in this study was unavoidably lower than it should be. Participants had a relatively low BMI from an international perspective, which may limit generalization of the findings.
In women with a predicted hyper response scheduled for IVF/ICSI, a reduced FSH dose does not affect live birth rates. A lower FSH dose did reduce the incidence of mild and moderate OHSS, but had no impact on severe OHSS. Future research into ORT-based dosing in women with a predicted hyper response should compare various safety management strategies and should be powered on a clinically relevant safety outcome while assessing non-inferiority towards live birth rates.
This trial was funded by The Netherlands Organization for Health Research and Development (ZonMW, Project Number 171102020).
SCO, TCvT and HLT received an unrestricted research grant from Merck Serono (the Netherlands). CBL receives grants from Merck, Ferring and Guerbet. BWJM is supported by a NHMRC Practitioner Fellowship (GNT1082548) and reports consultancy for OvsEva, Merck and Guerbet. FJMB receives monetary compensation as a member of the external advisory board for Ferring pharmaceutics BV and Merck Serono for consultancy work for Gedeon Richter (Belgium) and Roche Diagnostics (Switzerland) and for a research cooperation with Ansh Labs (USA). All other authors have nothing to declare.
Registered at the ICMJE-recognized Dutch Trial Registry (www.trialregister.nl). Registration number: NTR2657.
20 December 2010.
12 May 2011.
Introduction
The optimization of ovarian response to controlled ovarian stimulation (COS) for IVF continues to be an important topic of debate and research in the field of reproductive medicine. Over the last decade a shift has been taking place from ‘the more oocytes, the better’ towards an optimal range of number of retrieved oocytes at ovum pick-up (OPU) to maximize the chances of conceiving (van der Gaast et al., 2006; Sunkara et al., 2011), while controlling costs and side effects (Chen et al., 2015). The most severe complication of an excessive response to COS is the ovarian hyperstimulation syndrome (OHSS). Cycles are often cancelled before OPU or a freeze-all approach is chosen when a woman turns out to have a high risk of developing OHSS during stimulation (Humaidan et al., 2016). OHSS is not only associated with an increased risk of thromboembolism (Hignett et al., 1995) but also women are withheld a chance of conceiving in the cancelled cycle. In an attempt to avoid a hyper response, the clinician often adjusts the FSH dose pragmatically based on known response predictors, which usually include a woman's age combined with one or more ovarian reserve tests (ORTs). Anti-Müllerian hormone (AMH) and the antral follicle count (AFC) have been shown to be the most accurate ORTs in the prediction of ovarian response to COS (Broekmans et al., 2006, Broer et al., 2009).
However, it remains unclear whether lowering the FSH dose in women with a predicted hyper response influences treatment outcome in terms of live birth rates and safety, as recently reviewed by van Tilborg et al. (2016). Therefore, the aim of the present RCT was to assess whether a reduced gonadotrophin dose in women scheduled for IVF/ICSI with a predicted hyper response based on a high AFC influences cumulative live birth rates and safety.
Materials and Methods
Study design and population
This open-label, multicentre RCT in predicted hyper responders was embedded in a Dutch prospective, multicentre cohort study in women scheduled for a first IVF/ICSI cycle (the OPTIMIST study). The study protocol was published previously (van Tilborg et al., 2012) and details can also be found in van Tilborg et al. (2017a,b).
Most importantly, inclusion criteria included a regular indication for IVF/ICSI, female age <44 years, and a regular cycle (average cycle length of 25–35 days). Women with polycystic ovary syndrome (PCOS) (Rotterdam ESHRE/ASRM-Sponsored PCOS consensus workshop group) were excluded. After written informed consent was obtained, all participating women underwent a transvaginal ultrasound (TVS) for measurement of their AFC.
Study procedures
The AFC was performed in the early follicular phase (cycle Day 1–3) of the stimulation cycle (Broekmans et al., 2010). If the total AFC of both ovaries was >15 follicles, women were classified as a predicted hyper responder and randomized to receive a reduced dose of 100 IU of FSH or a standard dose of 150 IU of FSH daily. No consensus exists for precise AFC cut-off levels for predicting a hyper response, however, a cut-off between 14 and 16 antral follicles seems to provide the best balance between sensitivity and false positive rate (Broer et al., 2011; La Marca and Sunkara, 2014).
Further details of the COS and IVF/ICSI procedures have been published previously (van Tilborg et al., 2012) and are written in van Tilborg et al. (2017b). All participating women were followed for 18 months after randomization and all treatment cycles (fresh and cryo/thaw) within that period were reported.
Dose adjustments during stimulation were not allowed. Between treatment cycle dose adjustments were allowed in both study arms following strict, pre-determined criteria. In the reduced dose group the FSH dose could be adjusted with a step of 25 IU in case of a poor or hyper response. Poor response was defined as the cancellation of a stimulation cycle if <2 follicles >12 mm in diameter or <3 follicles >17 mm were observed on TVS, or if <5 oocytes were retrieved. Hyper response was defined as cancellation of a stimulation cycle because >20 follicles >12 mm in diameter were growing and estradiol levels exceeded 11 700 pmol/l (= 3187,08 ng/l), if >30 follicles >12 mm were growing or if >15 oocytes were retrieved. For the standard dose group a dose adjustment between cycles was allowed with a maximum of 50 IU FSH, following the criteria mentioned above.
Outcome measures
The primary outcome was the cumulative live birth rate of which the ongoing status had to be achieved within 18 months of randomization. Pregnancies could be achieved by fresh or cryo/thawed embryo transfers. Spontaneous pregnancies and pregnancies from IUI after cancellation of IVF/ICSI cycles were also considered. Secondary outcome measures consisted of: other pregnancy stages (definitions given in van Tilborg et al., 2017b), number of treatment cycles, number of dose adjustments and amount of dose adjustment between the first and second treatment cycle, cycle cancellation rate, number of retrieved oocytes, the occurrence of a poor or hyper response (for definitions see above), occurrence of OHSS (mild, moderate or severe) and number of frozen embryo transfers. These outcomes measures were assessed and reported for all treatment cycles within 18 months of follow-up and for the first treatment cycle only, as dose adjustments were allowed in subsequent cycles and the first treatment cycle results therefore reflect the two strategies most plainly.
Definitions of OHSS classification
OHSS was divided into three categories. Mild OHSS was defined as abdominal bloating or mild abdominal pain, with ovarian size usually <8 cm. Moderate OHSS was defined as moderate abdominal pain, nausea with or without vomiting or ultrasound evidence of ascites, and ovarian size usually 8–12 cm, while severe OHSS was defined as clinical ascites (occasionally hydrothorax), oliguria, haemoconcentration with haematocrit >45% or hypoproteinaemia, and ovarian size usually >12 cm (adapted from Golan and Weissman, 2009 and Navot and Bergh, 1993 in the Dutch guideline ‘Ovarieel Hyperstimulatiesyndoom’ by the Dutch society of Obstetrics and Gynaecology).
Sample size calculation
This RCT was embedded in a larger cohort study the design of which was published previously (van Tilborg et al., 2012). The total sample size of the cohort study was 1500, of which we expected 300 women to be predicted hyper responders.
Statistical analyses
Statistical analysis was performed using SPSS Statistics for Windows (version 21.0: IBM Corp, Armonk, NY, USA) and R (version 3.1.3, R Foundation for Statistical Computing, Vienna, Autria). Further details on the statistical and cost-effectiveness analyses can be found in van Tilborg et al. (2017a,b). In addition, as it has been suggested that using a GnRH-antagonist in predicted hyper responders can prevent the occurrence of OHSS (Tarlatzis and Kolibianakis, 2007), a pre-specified sensitivity analysis of first treatment cycles was performed in women using GnRH agonists only. The subgroup of women using antagonists was too small to also perform this sensitivity analysis for antagonist co-treatment only.
Results
Between 12 May 2011 and 5 May 2014, we included 1515 women in the OPTIMIST cohort of whom 521/1515 (34.4%) had an AFC > 15 and were classified as a predicted hyper responder. Of these women, 255 were randomized to receive the reduced dose of 100 IU and 266 were randomized to receive the standard dose of 150 IU of FSH daily (Fig. 1). Expecting a clinically relevant gain in pregnancy rate from 35–42% in the reduced dose group as compared to the standard dose group, the group size provided a power of 37% to detect this difference (two-sided alpha, 0.05). Baseline characteristics of the women are listed in Table I.
Baseline characteristics of predicted hyper responders in a study comparing a reduced versus a standard FSH dose for IVF/ICSI.
| Baseline characteristics FSH dose | 100 IU (n = 255) | 150 IU (n = 266) |
|---|---|---|
| Age (years) | 32.0 (4.3) | 31.6 (4.5) |
| Duration of infertility (years) | 2.7 (1.7) | 2.5 (1.4) |
| Smoking | 38/246 (15.4%) | 45/256 (17.6%) |
| BMI - kg/m2 | 23.8 (3.6) | 23.9 (3.8) |
| Primary infertility | 166/254 (65.4%) | 167 (62.8%) |
| Cause of infertilitya | ||
| Unexplained | 74 (29.4%) | 81 (30.5%) |
| Male factor | 153 (60.0%) | 162 (60.9%) |
| Endometriosis | 20 (7.8%) | 6 (2.3%) |
| Tubal factor | 27 (10.6%) | 24 (9.0%) |
| AFC (median, IQR) | 20.0 (7.0) | 21.0 (8.0) |
| AMH (ng/ml) (median, IQR) | 3.26 (1.98) | 3.00 (1.89) |
| GnRH co-treatmentb | ||
| GnRH-agonist | 187 (73.9%) | 196 (73.7%) |
| GnRH-antagonist | 66 (26.1%) | 70 (26.3%) |
Data are presented as mean (SD) or number (%) unless otherwise specified. AFC, antral follicle count; IQR, interquartile range, AMH, anti-Müllerian hormone.
aMore than one cause of infertility can be present in a given couple.
bTwo women in the reduced group have missing cycle data.
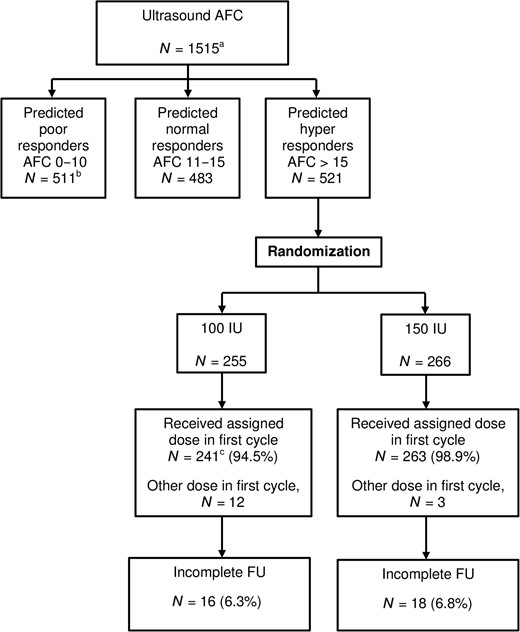
Flowchart of total study cohort and included hyper responders. AFC, antral follicle count; FU, follow-up. aThe overall strategy analysis is reported in van Tilborg et al. (2017a). bThe predicted poor responder trial is reported in van Tilborg et al. (2017b). cN = 2 women in the reduced dose group have missing cycle data.
Loss to follow-up was minimal in both groups (16/255 (6.3%) in the reduced dose group versus 18/266 (6.8%) in the standard dose group, P = 0.820). Mean duration of follow-up for women with incomplete follow-up was 213 days (SD 177) for the reduced and 269 days (SD 135) for the standard group (P = 0.304).
Table II and Fig. 2 depict cumulative pregnancy results. There was no statistically significant difference in our primary outcome, cumulative live birth rate, in the reduced (169/255, 66.3%) versus the standard group (185/266, 69.5%), RR 0.953 [0.85–1.07], P = 0.423), nor in the time to achieving this pregnancy (mean 185.4 days (SD 129.4) versus 191.4 days (SD 129.8), P = 0.664).
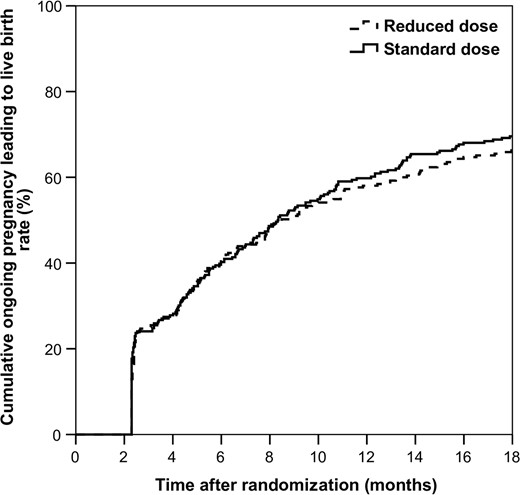
Cumulative live birth incidence curve. Log rank = 0.504.
Pregnancy data per woman.
| Pregnancy data per womana | 100 IU (n = 255) | 150 IU (n = 266) | RR [95% CI] | P-value |
|---|---|---|---|---|
| Ongoing pregnancy within 18 months of FU resulting in live birth | 169 (66.3%) | 185 (69.5%) | 0.953 [0.85–1.07] | 0.423 |
| First cycle | 91 (36.0%) | 104 (39.1%) | ||
| Second cycle | 39 (15.3%) | 45 (16.9%) | ||
| Third cycle | 24 (9.4%) | 18 (6.8%) | ||
| Fourth cycle | 4 (1.6%) | 6 (2.3%) | ||
| Fifth cycle | 0 | |||
| Biochemical pregnancy | 190 (74.5%) | 215 (80.8%) | 0.922 [0.84–1.01] | 0.083 |
| Clinical pregnancy | 180 (70.6%) | 207 (77.8%) | 0.907 [0.82–1.00] | 0.059 |
| Miscarriage | 18 (7.1%) | 32 (12.0%) | 0.587 [0.34–1.02] | 0.054 |
| Ongoing pregnancy | 173 (67.8%)e | 189 (71.1%)f | 0.955 [0.85–1.07] | 0.426 |
| Multiple pregnancyb | 5 (3.0%) | 12 (6.5%) | 0.434 [0.16–1.21] | 0.101 |
| Conception mode (% of live birth) | 0.748 | |||
| Spontaneous | 9 (5.3%) | 8 (4.3%) | ||
| IVF/ICSI freshc | 118 (69.8%) | 123 (66.8%) | ||
| IVF/ICSI cryo | 40 (23.7%) | 50 (27.2%) | ||
| Otherd | 2 (1.2%) | 4 (1.6%) | ||
| Time to ongoing pregnancy leading to live birth (days) | 185.4 (129.4) | 191.4 (129.8) | 0.664 |
Data are presented ad mean (SD) or number (%) unless otherwise specified.
FU, follow-up, RR, relative risk. P-value calculated by using a Chi-square test.
aShown with a maximum of one event per woman.
bPercentage based on the number of multiple pregnancies.
cIncluding live births from escape IUI treatments.
dAfter treatment in another centre without cycle data.
e2 × Loss to FU, 1 × Foetal demise, 1 × Immature birth.
f2 × Foetal demise, 1 × Loss to FU, 1 × Termination of pregnancy for trisomy 21.
Data for all treatment cycles performed within 18 months after randomization are listed in Table III. Women in both groups underwent a similar number of fresh treatment cycles. After completion of the first cycle, the dose was increased in 77/135 (57.3%) of the women in the lower dose group as compared to 19/136 (14.0%) in the standard group (P < 0.001) in cycle 2. Conversely, the dose was reduced in 6/135 (4.4%) in the lower dose group versus 53/136 (39.0%) in the standard group (P < 0.001). A lower number of oocytes was obtained at OPU in the reduced dose as compared to the standard dose group (9.0 versus 11.9, P < 0.001). When combining cancellation rate and oocyte yield, a poor response was more often seen in the reduced dose group than in the standard group (133/459 (29.0%) versus 68/474 (14.3%), P < 0.001). In contrast, a hyper response occurred more often in the standard dose group as compared to the reduced dose group (144/474 (30.4%) versus 48/459 (10.5%), P < 0.001). Mild and moderate OHSS occurred less often in the reduced dose group as compared to the standard group (mild 18/456 (3.9%) versus 40/474 (8.4%), P = 0.008, RR 0.47 [0.27–0.81] and moderate 0/456 versus 11/474 (2.3%), P = 0.001, respectively). The incidence of severe OHSS was low and did not differ between groups (6/456 (1.3%) in the reduced dose versus 5/474 (1.1%) in standard dose group, P = 0.712, RR 1.25 [0.38–4.07]).
Cumulative treatment results.
| Results 18 months follow-up | 100 IU (n = 253a) | 150 IU (n = 266) | P-value |
|---|---|---|---|
| Number of fresh cycles per woman | 1.8 (0.9) | 1.8 (0.9) | 0.722 |
| Total number of fresh cycles | 461 | 476 | 0.761b |
| First cycle | 253 (54.9%) | 266 (55.9%) | |
| Second cycle | 136 (29.5%) | 136 (28.6%) | |
| Dose increase between first and second cycle | 77/135 (57.3%) | 19/136 (14.0%) | <0.001 |
| Amount of increase (IU/L) Median (IQR) | 25.0 (25) | 50.0 (0) | <0.001 |
| Dose reduction between first and second cycle | 6/135 (4.4%) | 53/136 (39.0%) | <0.001 |
| Amount of reduction (IU/L) Median (IQR) | 25.0 (12.5) | 50.0 (14.6) | 0.002 |
| Third cycle | 56 (12.1%) | 58 (12.2%) | |
| Fourth cycle | 14 (3.0%) | 16 (3.4%) | |
| Fifth cycle | 2 (0.4%) | 0 | |
| Cycle cancellation | 82/461 (17.8%) | 65/475 (13.7%) | 0.104b |
| Cancellation reason | |||
| Insufficient growth | 72/461 (15.6%) | 25/475 (5.3%) | |
| Excessive response | 6/461 (1.3%) | 32/475 (6.7%) | |
| Other | 4/461 (0.9%) | 8/475 (1.7%) | |
| Number of oocytesc | 9.0 (4.9) | 11.9 (6.0) | <0.001b |
| Poor response | 133/459 (29.0%) | 68/474 (14.3%) | <0.001b |
| Hyper response | 48/459 (10.5%) | 144/474 (30.4%) | <0.001b |
| Number of embryo transfers | 349/461 (75.7%) | 376/475 (79.2%) | 0.219b |
| Number of OHSS events | 24/456 (5.2%) | 56/474 (11.8%) | 0.001b |
| Classification OHSS | 0.001b | ||
| Mild | 18/456 (3.9%) | 40/474 (8.4%) | 0.008b |
| Moderate | 0/456 | 11/474 (2.3%) | 0.001d |
| Severe | 6/456 (1.3%) | 5/474 (1.1%) | 0.712b |
| Number of cryo embryo transfers per woman | 0.9 (1.4) | 1.0 (1.4) | 0.314 |
Data are presented ad mean (SD) or number (%) unless otherwise specified. OHSS, ovarian hyper stimulation syndrome.
aTwo women have missing cycle data.
bP-value calculated by using a generalized estimating equation (GEE) model.
cBased on the women who had an ovum pick-up.
dCould not be tested with GEE for no events in the reduced dose group. No clustering took place (all moderate OHSS events occurred in different women), so Chi-square was used.
First cycle
Almost all included women received the assigned dose in the first treatment cycle (241/255 (94.5%) in the reduced dose and 263/266 (98.9%) in the standard dose group). In the reduced dose group, first cycles were more often cancelled because of insufficient follicle growth (53/253 (20.9%) versus 9/266 (3.4%, P < 0.001) and less often because of excessive response (5/253 (2.0%) versus 21/266 (7.9%), P = 0.002). Other results for the first cycle were comparable to those of all treatment cycles (Table IV).
Treatment results for the first cycle.
| 100 IU (N = 253a) | 150 IU (N = 266) | P-value | |
|---|---|---|---|
| Cycle cancellation | 61 (24.1%) | 33 (12.4%) | 0.001 |
| Cancellation reason | <0.001 | ||
| Insufficient growth | 53 (20.9%) | 9 (3.4%) | <0.001 |
| Excessive response | 5 (2.0%) | 21 (7.9%) | 0.002 |
| Other | 3 (1.2%) | 3 (1.1%) | 0.95 |
| Number of oocytesb | 8.8 (5.0) | 13.2 (6.1) | <0.001 |
| Poor response | 91 (34.0%) | 20 (7.5%) | <0.001 |
| Hyper response | 28 (11.6%) | 102 (38.3%) | <0.001 |
| Number of embryo transfers | 175 (69.2%) | 212 (79.7%) | 0.006 |
| Number of OHSS events | 12 (4.7%) | 39 (14.7%) | <0.001 |
| Classification OHSS | <0.001 | ||
| Mild | 8 (3.2%) | 29 (10.9%) | 0.001 |
| Moderate | 0 | 7 (2.6%) | 0.009 |
| Severe | 4 (1.6%) | 3 (1.1%) | 0.66 |
| Number of cryo embryo transfers per woman | 0.5 (1.1) | 0.7 (1.2) | 0.079 |
| Live birth (fresh only)c | 65 (25.7%) | 67 (25.2%) | 0.90 |
| Live birth (fresh and cryo)c | 91 (36.0%) | 104 (39.1%) | 0.46 |
Data are presented ad mean (SD) or number (%) unless otherwise specified. OHSS, ovarian hyper stimulation syndrome.
aTwo women missing cycle data.
bBased on women who had an ovum pick-up.
cIncluding pregnancies obtained after escape IUI in cancelled cycles.
Sensitivity analyses
The per protocol analysis for all treatment cycles showed similar results to the intention-to-treat analysis (Supplementary Table SI). The sensitivity analysis in women treated with a GnRH-agonist did not change the first cycle results (Supplementary Table SII).
Health economic evaluation
No significant difference in cost-effectiveness was found in the reduced versus the standard FSH dose group (Supplementary Table SIII and Supplementary Fig. S1).
Discussion
This study shows that in women undergoing IVF/ICSI with a predicted hyper response (defined as AFC > 15, but without PCOS), a first cycle FSH dose reduction of 50 IU does not influence live birth rates or the incidence of severe OHSS as compared to a standard FSH dose (150 IU), despite a clearly reduced number of retrieved oocytes. As reduced dosing was only slightly and non-significantly less expensive, there was no dominant strategy in the economic analysis.
A recent systematic review by van Tilborg et al. concluded that there was a lack of evidence favouring individualized dosing over standard treatment for the IVF population as a whole (van Tilborg et al., 2016). Since the studies on which this review was based did not compare live birth rates or cost-effectiveness and did not provide sufficient data on predicted hyper responders only, it is difficult to directly compare these results to the current RCT. The review by van Tilborg et al. (2016) stated that there might be a benefit of individualized dosing with respect to safety in predicted hyper responders. This is based on two studies assessing safety as a secondary outcome. Popovic-Todorovic et al. (2003) reported that individualized FSH dosing based on an algorithm leads to a lower number of retrieved oocytes in women predicted to be hyper responders (12.7 versus 15.3 in the standard group, P < 0.001). However, the occurrence of OHSS was low, did not differ between groups (0% in the individualized versus 2.3% in the standard group) and was not assessed for predicted hyper responders alone. The second RCT by Olivennes et al. (2015) stated a safety benefit for individualized dosing. This was based on the observation that both the cancellation rate for excessive response and the rate of OHSS were lower in the individualized strategy. However, no statistical test was performed for this combined outcome measure, while the outcome measures separately did not differ significantly between groups (calculated only in the review, not in original article, van Tilborg et al., 2016).
A very recent RCT studying individualized dosing using a gradual dosing system based on AMH and body weight also showed no difference in single cycle ongoing pregnancy rates (Nyboe Andersen et al., 2017). In contrast to our results, no difference in the occurrence of any grade of OHSS was observed. The authors suggest that OHSS was averted by cancellation of stimulation or using an agonist trigger instead of hCG and a statistically significant difference in this combined outcome measure (prevention and occurence of all OHSS) was observed (5.6% in the individualized group versus 8.0% in the standard group, P = 0.037). A similar conclusion may be drawn from our first cycle data, however as this combined outcome (cycle cancellation and occurrence of OHSS) was not predefined, we did not perform a statistical test on our data.
AFC and AMH have been shown to be the most accurate ORTs in the prediction of ovarian response to stimulation, but do not add relevant information when applied simultaneously, or in combination with female age (Broer, et al., 2013a, Broer et al., 2013b). Therefore, we consider that using the AFC alone is, in principle, sufficient for ORT-based dosing. A fixed dose strategy was used as van Hooff et al. (1993) have demonstrated that dosage alterations during ovarian stimulation in actual poor responders do not affect the cycle outcome in terms of pregnancy or response. Unfortunately, there are no other studies available demonstrating the relevance of dose adjustments during stimulation.
A first strength of this trial is that it is a RCT embedded in a large, multicentre cohort study using the easily applicable AFC as an ORT. Because this was a multicentre study it is pragmatic, which increases generalizability and results in better knowledge of and implementation of study outcomes in participating centres (Litjens et al., 2013), Another strength is that we chose live birth rate as our primary outcome, the most important outcome for the patient, which is in contrast to most other studies that do not look beyond ovarian response or pregnancy rates (Wilkinson et al., 2016). In addition, we not only reported first cycle results, but also cumulative results, which is a better reflection of clinical practice, as most women undergo multiple treatment cycles after failure of previous ones (Scholten et al., 2016). For this study, it was especially important to report both first cycle and cumulative treatment cycle data as dose adjustments were allowed between cycles. The first cycle therefore most clearly reflects the effects of the two treatment strategies. As no differences in live birth rate and safety were found between first and cumulative cycle data, our interpretation of the results remains the same. Finally, a health economic evaluation was performed, which provides essential information on costs of the two treatment strategies before implementation can be considered.
Several limitations must be mentioned. The limitations for the OPTIMIST study as a whole have been addressed in the overall strategy paper and the paper including predicted poor responders (van Tilborg et al., 2017a,b). In addition to those limitations, for the current paper we first need to point out that the sample size calculation of the OPTIMIST study was based on 80% power to detect a difference in live birth rates in the expected poor responders only (van Tilborg et al., 2012, 2017b). The number of women included in the current RCT provided a power of only 37% to detect the pre-specified clinically relevant difference in live birth rate of 7%. A small difference of 3.2% in live birth rate was observed, which is not considered to be clinically relevant. Moreover, a sample size of over 3000 women in both study arms would have been needed to prove that this small difference is statistically significant. As the difference observed was in the advantage of the standard dose group, we can still conclude that a reduced FSH dose in predicted hyper responders does not improve live birth rates.
Second, we need to point out that the BMI of the women included was relatively low (23.8 kg/m2 in the reduced dose group and 23.9 kg/m2 in the standard dose group) when viewed from an international perspective. The results may therefore not be generalizable to women with a higher BMI, although the relationship for BMI or body weight and ovarian response may be subject to a considerable degree of variation, making translation towards dosing a difficult task (Oudshoorn et al., 2017). Further planned OPTIMIST analyses should elucidate if BMI or body weight play a role in FSH dose individualization.
Third, our results indicate that the dose reduction of 50 IU (from 150 IU to 100 IU) might have been too rigorous. In the reduced dose group, 91 of 133 poor responses (68%) occurred in the first cycle and the dose was increased between the first and second cycle in 77 of 135 women (57%). Since a dose-response relation is present when an FSH starting dose <150 IU is given (Sterrenburg et al., 2011), a smaller decrease of the starting dose (e.g. 125 IU/day) will probably reduce the occurrence of a poor response. On the other hand, it might still increase the incidence of a hyper response, which could jeopardize safety. A previous patient preference study has shown that women are willing to trade off pregnancy rate for a decreased risk of OHSS (van den Wijngaard et al., 2014). From this perspective, the standard dose of 150 IU may be slightly too high for predicted hyper responders, as a lower dose did reduce the incidence of mild and moderate OHSS, with no detrimental effect on live birth rates. In all, this could suggest that FSH dose reduction might have to be done using a more gradual dosing system.
Finally, in recent years consensus has been increasing that women with a predicted hyper response should be treated with a GnRH-antagonist for pituitary suppression and, if needed, a GnRH-agonist trigger to increase safety without affecting efficacy. This was not yet common practice at the time the trial was designed and so only one-third of the women in the current trial received a GnRH-antagonist. Moreover, only hCG triggering was allowed. As the percentage of women receiving GnRH-antagonist co-treatment was equal in the dosing groups, this should not have affected the results. It still has to be established whether antagonist with agonist triggering leads to a more optimal balance between efficacy and safety as compared to first line preventive management by FSH dose reduction.
In conclusion, this RCT demonstrates that a first cycle FSH dose reduction in predicted hyper responders based on the AFC does not influence live birth rates. With respect to safety, the current study shows that using a reduced FSH dose of 100 IU/day does not reduce the risk of severe OHSS in predicted hyper responders, although the rate of any grade of OHSS was reduced. The occurrence of severe OHSS alone may not be the most meaningful safety outcome in women undergoing COS. Future studies should therefore also include the effect of prevention measures such as cancellation for hyper response, GnRH-agonist triggering and a freeze-all policy. However, as cycle cancellation occurred twice as often in the first cycle in the reduced dose group, a definite claim advocating FSH dose reduction in predicted hyper responders cannot be made until results from future studies comparing various safety management approaches have become available.
Supplementary data
Supplementary data are available at Human Reproduction online.
Acknowledgements
We thank the women who participated in this study, the staff of the participating hospitals, and the office members of the Dutch Consortium for their contribution.
Authors’ roles
M.J.C.E., H.L.T., F.J.M.B. and B.W.J.M. designed the trial. T.C.v.T., H.L.T, F.J.M.B and B.W.J.M. coordinated the trial. T.C.v.T., S.C.O., G.J.E.O., J.F., M.A.H.v.H., E.J.P.v.S., E.A.B., J.M.J.S., J.K., C.H.d.K., C.B.L., F.J.M.B. and all other members from the OPTIMIST study group collected data. S.C.O. performed the statistical analyses. H.G. and M.J.C.E. provided input on the statistical analyses. S.C.O., M.J.C.E., H.L.T., F.J.M.B. and B.W.J.M. interpreted the data. S.C.O. drafted the manuscript. All authors revised the report, and approved the final submitted version.
Funding
This trial was funded by The Netherlands Organization for Health Research and Development (ZonMW, Project Number 171102020).
Conflict of interest
S.C.O., T.C.v.T. and H.L.T. received an unrestricted research grant from Merck Serono (the Netherlands). C.B.L. receives grants from Merck, Ferring and Guerbet. B.W.J.M. is supported by a NHMRC Practitioner Fellowship (GNT1082548) and reports consultancy for OvsEva, Merck and Guerbet. F.J.M.B. receives monetary compensation as a member of the external advisory board for Ferring pharmaceutics BV and Merck Serono for consultancy work for Gedeon Richter (Belgium) and Roche Diagnostics (Switzerland) and for a research cooperation with Ansh Labs (USA). All other authors have nothing to declare.
References
Author notes
OPTIMIST study group: Theodora C. van Tilborg, Simone C. Oudshoorn, Marinus J.C. Eijkemans, Monique H. Mochtar, Carolien A.M. Koks, Ron J.T. van Golde, Harold R. Verhoeve, Annemiek W. Nap, Gabrielle J. Scheffer, A. Petra Manger, Annemieke Hoek, Bendictus C. Schoot, G. Jur E. Oosterhuis, Walter K.H. Kuchenbecker, Kathrin Fleischer, Jan Peter de Bruin, Alexander V. Sluijmer, Jaap Friederich, Arie Verhoeff, Marcel H.A. van Hooff, Evert J.P. van Santbrink, Egbert A. Brinkhuis, Jesper M.J. Smeenk, Janet Kwee, Corry H. de Koning, Henk Groen, Madelon van Wely, Cornelis B. Lambalk, Joop S.E. Laven, Ben Willem J. Mol, Frank J.M. Broekmans, Helen L. Torrance.
