


Abstract
Does an increased FSH dose result in higher cumulative live birth rates in women with a predicted poor ovarian response, apparent from a low antral follicle count (AFC), scheduled for IVF or ICSI?
In women with a predicted poor ovarian response (AFC < 11) undergoing IVF/ICSI, an increased FSH dose (225/450 IU/day) does not improve cumulative live birth rates as compared to a standard dose (150 IU/day).
In women scheduled for IVF/ICSI, an ovarian reserve test (ORT) can predict ovarian response to stimulation. The FSH starting dose is often adjusted based on the ORT from the belief that it will improve live birth rates. However, the existing RCTs on this topic, most of which show no benefit, are underpowered.
Between May 2011 and May 2014, we performed an open-label multicentre RCT in women with an AFC < 11 (Dutch Trial Register NTR2657). The primary outcome was ongoing pregnancy achieved within 18 months after randomization and resulting in a live birth. We needed 300 women to assess whether an increased dose strategy would increase the cumulative live birth rate from 25 to 40% (two-sided alpha-error 0.05, power 80%).
Women with an AFC ≤ 7 were randomized to an FSH dose of 450 IU/day or 150 IU/day, and women with an AFC 8–10 were randomized to 225 IU or 150 IU/day. In the standard group, dose adjustment was allowed in subsequent cycles based on pre-specified criteria. Both effectiveness and cost-effectiveness of the strategies were evaluated from an intention-to-treat perspective.
In total, 511 women were randomized, 234 with an AFC ≤ 7 and 277 with an AFC 8–10. The cumulative live birth rate for increased versus standard dosing was 42.4% (106/250) versus 44.8% (117/261), respectively [relative risk (RR): 0.95 (95%CI, 0.78–1.15), P = 0.58]. As an increased dose strategy was more expensive [delta costs/woman: €1099 (95%CI, 562–1591)], standard FSH dosing was the dominant strategy in our economic analysis.
Despite our training programme, the AFC might have suffered from inter-observer variation. As this open study permitted small dose adjustments between cycles, potential selective cancelling of cycles in women treated with 150 IU could have influenced the cumulative results. However, since first cycle live birth rates point in the same direction we consider it unlikely that the open design masked a potential benefit for the individualized strategy.
Since an increased dose in women scheduled for IVF/ICSI with a predicted poor response (AFC < 11) does not improve live birth rates and is more expensive, we recommend using a standard dose of 150 IU/day in these women.
This study was funded by The Netherlands Organisation for Health Research and Development (ZonMW number 171102020). T.C.T., H.L.T. and S.C.O. received an unrestricted personal grant from Merck BV. H.R.V. receives monetary compensation as a member on an external advisory board for Ferring pharmaceutical BV. B.W.J.M. is supported by a NHMRC Practitioner Fellowship (GNT1082548) and reports consultancy for OvsEva, Merck and Guerbet. F.J.M.B. receives monetary compensation as a member of the external advisory board for Ferring pharmaceutics BV (the Netherlands) and Merck Serono (the Netherlands) for consultancy work for Gedeon Richter (Belgium) and Roche Diagnostics on automated AMH assay development (Switzerland) and for a research cooperation with Ansh Labs (USA). All other authors have nothing to declare.
Registered at the ICMJE-recognized Dutch Trial Registry (www.trialregister.nl). Registration number NTR2657.
20 December 2010.
12 May 2011.
Introduction
The objective of controlled ovarian stimulation (COS) in women undergoing IVF or ICSI is to obtain multiple oocytes. The ovarian response to COS is an expression of the quantitative ovarian reserve (De Boer et al., 2002) and can differ significantly between women of the same age, as women have a wide variation in the timing of decline of their ovarian reserve (te Velde and Pearson, 2002). Approximately 20% of all women undergoing IVF/ICSI show a poor ovarian response (defined as ≤4 oocytes retrieved) to COS (Broer et al., 2013a), which leads to higher drop-out rates (Verberg et al., 2008) and results in lower live birth rates as compared to women with a normal response (van der Gaast et al., 2006; Sunkara et al., 2011; Drakopoulos et al., 2015). An increase in the proportion of normal responders by optimizing COS is thought to improve the live birth rate. Assessment of the ovarian reserve is potentially useful for the prediction of poor response, and both the antral follicle count (AFC) and serum anti-Müllerian Hormone (AMH) are accurate predictors of ovarian response, even if used as single tests (Broer et al., 2013a).
The majority of previously published RCTs on ovarian reserve test (ORT) based dosing in predicted poor responders have shown that an increased gonadotrophin dose does not increase pregnancy rates (van Tilborg et al., 2016). In contrast, one study revealed a decrease in the proportion of poor ovarian response after individualized dosing and also reported higher ongoing pregnancy rates (Popovic-Todorovic et al., 2003). Nonetheless, as most of the previously published RCTs were underpowered to assess the outcomes pregnancy or live birth and suffered from methodological weaknesses (Harrison et al., 2001; Popovic-Todorovic et al., 2003; Klinkert et al., 2005; Berkkanoglu and Ozgur, 2010; Jayaprakasan et al., 2010; Lefebvre et al., 2015; Olivennes et al., 2015), it is still unclear whether women with a predicted poor response who are undergoing IVF/ICSI benefit from a higher gonadotrophin dose. As multiple treatment cycles reflect clinical practice most accurately and live birth is the endpoint that matters most to the patient (Legro et al., 2014; Scholten et al., 2016), we aimed to assess whether an increased gonadotrophin dose in women scheduled for IVF/ICSI with a predicted poor response based on a low AFC resulted in higher cumulative live birth rates.
Materials and Methods
Study design and population
This open-label, multicentre RCT in predicted poor responders in which we compared an increased FSH dose with standard dosing was part of a Dutch prospective cohort study (the OPTIMIST study, registration number Dutch Trial Register NTR2657; www.trialregister.nl). This paper reports data from the predicted poor responders only (AFC < 11). Women with an AFC > 15 were included in the predicted hyper responder RCT, of which the results are reported separately (Oudshoorn et al., 2017). Ethical approval was obtained from the Institutional Review Board of the University Medical Centre Utrecht (MEC 10–273) and the study was approved by the board of directors of all participating sites. The study protocol was published previously (van Tilborg et al., 2012).
All infertile women starting their first IVF or ICSI treatment, or the first IVF or ICSI treatment after a live birth, who were younger than 44 years of age, had a regular menstrual cycle (on average 25–35 days) and a normal transvaginal ultrasound were eligible for inclusion in the OPTIMIST study. Women with polycystic ovary syndrome (PCOS) (PCOS Consensus Workshop Group, 2004), endocrine or metabolic abnormalities or starting oocyte donation could not be included. Eligible women were recruited by their physicians or by dedicated research nurses prior to the start of their IVF/ICSI treatment, and before the ORT was performed. Written informed consent was obtained from all participants.
Study procedures
Eligible women scheduled for IVF/ICSI were counselled by physicians or research nurses for inclusion in the cohort study, with possible randomization if the AFC was <11 or >15. After providing informed consent, women had their AFC measured. The AFC was determined by counting follicles sized between 2 and 10 mm, and performed following previously published recommendations (Broekmans et al., 2010). At the start of the study, physicians of participating sites were trained in AFC through workshops. Furthermore, instructions on how to measure AFC, including video images, were sent to all participating sites.
Women with an AFC < 11 were included in the RCT reported here. Women were randomly assigned using a web-based randomization program to an increased or standard FSH dose using a 1:1 ratio and variable block-sizes (maximum 6). Randomization was stratified per AFC group and centre. Women assigned to the higher dose group received 450 IU/day FSH if they had an AFC ≤ 7, and 225 IU/day FSH if their AFC was 8–10. In the standard dose group, women received 150 IU/day FSH in both AFC groups. Centres were only allowed to use one type of GnRH analogue protocol as co-medication (GnRH antagonist or a long GnRH agonist schedule). So, stratification per centre also includes stratification per GnRH analogue treatment. The clinicians, participants and investigators were not masked for the assigned FSH dose. A fixed dose strategy was used. In the standard group, a maximum dose adjustment of 50 IU/day was allowed between cycles if women had a poor response (i.e. cycle cancellation owing to insufficient growth: <2 follicles >12 mm or <3 follicles ≥17 mm; or <5 oocytes at retrieval) or hyper response (i.e. cycle cancellation owing to excessive response: >20 follicles >12 mm and estradiol levels exceeding 11.700 pmol/l (= 3187.08 ng/l) or >30 follicles >12 mm; or >15 oocytes at retrieval).
Ovarian stimulation was performed using recombinant-FSH or urinary-FSH. Final oocyte maturation was achieved by administration of HCG (10 000 IU Pregnyl® or 6500 IU Ovitrelle®, according to local protocol). Oocyte retrieval was carried out 36 h after HCG administration. Embryo transfer took place on Day 3–5 after oocyte retrieval, depending on local protocol. Luteal phase supplementation consisted of vaginal progesterone. Frozen/thaw treatment cycles were conducted according to local protocol.
All treatment cycles performed within 18 months after randomization were recorded. After the first fresh treatment cycle, women had to use their cryopreserved embryos before continuing to the next fresh treatment cycle. Further details of the OPTIMIST study procedures have been published elsewhere (van Tilborg et al., 2012).
Outcome measures
The primary outcome of this study was ongoing pregnancy achieved within 18 months after randomization leading to live birth, which was defined as the delivery of a live foetus after 24 weeks of gestation. All ongoing pregnancies achieved within 18 months of follow-up, irrespective of the conception mode, were taken into account. Secondary outcomes included number of cycle cancellations, reason for cycle cancellations (i.e. insufficient follicle growth, excessive response or other reason (e.g. personal reason)), number of ovum retrievals performed, number of obtained oocytes, poor response (i.e. cycle cancellation owing to insufficient growth or <5 oocytes at retrieval), hyper response (i.e. cycle cancellation owing to excessive response or >15 oocytes at retrieval), number of embryos available for transfer, number of embryo transfers, number of cryopreserved embryos, number of treatment cycles started, ovarian hyperstimulation syndrome (OHSS; i.e. mild, moderate and severe (for definitions see Oudshoorn et al. 2017)), biochemical pregnancy (defined as a positive pregnancy test), miscarriage (defined as the absence of a foetal heartbeat at 7 or 10 weeks of gestation) and clinical pregnancy (defined as the presence of a gestational sac). Ongoing pregnancy was defined as the detection of a foetal heartbeat on ultrasound at a gestational age of at least 10 weeks, and time to ongoing pregnancy leading to live birth as the time from randomization to an ongoing pregnancy that led to a live birth. Multiple pregnancy was defined as an ongoing pregnancy with at least two foetuses.
For the cost-effectiveness analysis, data on direct medical costs were collected. All outcomes were pre-specified in the study protocol and statistical analysis plan. We chose to adapt our protocol definitions for clinical and ongoing pregnancy in order to follow the recent consensus of ESHRE (Kolte et al., 2015).
Sample size calculation
We expected that an increased FSH dose would improve the cumulative live birth rate by 15% (from 25 to 40%) in women included in the OPTIMIST study as compared to treatment by the standard approach (Popovic-Todorovic et al., 2003). In order to be able to detect this difference, at least 300 women were needed in RCT1 (80% power, alpha-error 5%). Derived from previous data (Broer et al., 2013a, 2013b), we assumed that 20% of the eligible women would be classified as predicted poor responders and another 20% as predicted hyper responders. This meant that in total 1500 women were planned to be included in the cohort of the OPTIMIST study (van Tilborg et al. 2017).
Statistical analysis
All analyses were performed according to the intention-to-treat principle. Continuous data are presented as mean (SD) and categorical data as numbers (%). Descriptive analyses were performed with independent samples t-test and chi-square tests for continuous and categorical data, respectively. In the cumulative analyses, clustering of multiple treatment cycles per woman had to be taken into account. We used three generalized estimating equations models: normal response and identity link for continuous variables, binominal response and a log link for binominal variables, and multinomial response and cumlogit link for categorical variables, assuming independent working correlations in all models.
For the pregnancy and live birth outcomes relative risks (RR) and 95% CI were calculated. Time to ongoing pregnancy leading to live birth was graphically depicted by cumulative incidence curves. The log-rank test was used to measure whether significant differences existed in the cumulative incidence curves. Women who did not reach the primary outcome (live birth) and for whom the follow-up could not be completed because of loss of contact (despite repeated attempts) were considered as ‘not having an ongoing pregnancy’ at 18 months after randomization. Following our statistical analysis plan, pre-specified additional analyses were performed: the primary outcome and some of the secondary outcomes within the AFC subgroups (AFC ≤ 7 and AFC 8–10), first cycle treatment results and a per-protocol analysis of the primary outcome by excluding women with protocol violations related to their first cycle FSH starting dose, by excluding treatment cycles from a woman from their first protocol violation regarding dose-adjustments within and between treatment cycles onwards, and by excluding pregnancies that had a spontaneous or ‘other’ mode of conception. All comparisons were tested two-sided. P-values below 0.05 were considered to indicate statistical significance. Data were analysed in SPSS (version 21.0, IBM Corp Armonk, NY, USA) and R (version 3.1.3, R Foundation for Statistical Computing, Vienna, Autria).
Since the economic evaluation was performed from a healthcare perspective, we focused on direct medical costs. The effectiveness outcome was the proportion of couples with an ongoing pregnancy achieved within 18 months after randomization and leading to live birth. In order to test the robustness of the results of our cost-effectiveness analysis, bootstrap resampling with 5000 resamples was performed. Based on the bootstrapped results, a Cost-effectiveness Acceptability Curve was derived. Further details regarding the cost-effectiveness analysis are described in van Tilborg et al. (van Tilborg et al. 2017).
Results
Between 12 May 2011 and 5 May 2014, we included 1515 women in the OPTIMIST cohort of whom 511/1515 (33.7%) had an AFC < 11 and were classified as a predicted poor responder (Fig. 1). In total, 250/511 (48.9%) women were allocated to an increased and 261/511 (51.1%) women to a standard FSH dose.

Flowchart of total study cohort and the included predicted poor responders. AFC, antral follicle count; FU, follow-up. aThe overall strategy analysis is reported in van Tilborg et al. 2017; bThe predicted hyper responder trial is reported in Oudshoorn et al. 2017. cn = 1 never started ovarian stimulation, n = 1 never started treatment.
A similar proportion of women allocated to the increased and standard FSH dose did not reach the primary outcome and could not be contacted 18 months after randomization [44/250 (17.6%) versus 45/261 (17.2%), respectively; P = 0.89], with a comparable mean duration of follow-up [295.2 (121.2) versus 270.1 days (154.6), respectively; P = 0.40].
Baseline characteristics did not differ between groups (Table I). Our primary outcome, ongoing pregnancy achieved within 18 months of follow-up and leading to live birth, occurred in 106/250 (42.4%) women in the higher versus 117/261 (44.8%) women in the standard dose group [RR 0.95 (95%CI, 0.78–1.15), P = 0.58; Table II]. Time to ongoing pregnancy leading to live birth was comparable between groups [mean 212 (SD 133) versus 197 (SD 135) days for the increased versus standard dose group, P = 0.40; Table II and Figure 2]. Cumulative treatment results are shown in Table III. In the standard group more poor response and less hyper response occurred, with no difference in the proportion of normal ovarian responses as compared to an increased dose.
Baseline characteristics of predicted poor responder women in a study comparing an increased versus a standard FSH dose for IVF/ICSI.
| AFC 0–10 | ||
|---|---|---|
| Baseline characteristics | 450/225 IU (n = 250) | 150 IU (n = 261) |
| Age (years) | 35.6 (4.2) | 35.8 (4.4) |
| Duration of infertility (years) | 2.7 (1.8) | 2.5 (1.7) |
| Smoking | 44/238 (18.5%) | 48/252 (19.0%) |
| BMI - kg/m2 | 24.1 (4.2) | 24.0 (4.3) |
| Primary infertility | 138/248 (55.6%) | 143 (54.8%) |
| Cause of infertilitya | ||
| Unexplained | 96 (38.4%) | 124 (47.5%) |
| Male factor | 123 (49.2%) | 114 (43.7%) |
| Endometriosis | 10 (4.0%) | 9 (3.4%) |
| Tubal factor | 30 (12.0%) | 25 (9.6%) |
| AFC (median, IQR) | 8.0 (3.0) | 8.0 (3.0) |
| AMH (ng/ml) (median, IQR) | 1.00 (0.96) | 0.88 (0.96) |
| GnRH co-treatment | ||
| GnRH agonist | 202 (80.8%) | 208/260 (80.0%) |
| GnRH antagonist | 48 (19.2%) | 52/260 (20.0%) |
Data are presented as mean (SD) or number (%) unless otherwise reported. AFC, antral follicle count; AMH, anti-Müllerian hormone; IQR, interquartile range.
aIncluding patients with >1 cause of infertility.
Pregnancy data per woman.
| AFC 0–10 | ||||
|---|---|---|---|---|
| Pregnancy data per womana | 450/225 IU (n = 250) | 150 IU (n = 261) | RR (95%CI) | P-value |
| Ongoing pregnancy resulting in live birth within 18 months of FU | 106 (42.4%) | 117 (44.8%) | 0.95 (0.78–1.15) | 0.58 |
| First cycle (250 versus 260) | 44 (17.6%) | 52 (20.0%) | 0.88 (0.61–1.26) | 0.49 |
| Second cycle (165 versus 176) | 24 (14.5%) | 32 (18.2%) | 0.80 (0.49–1.30) | 0.37 |
| Third cycle (79 versus 87) | 16 (20.3%) | 14 (16.1%) | 1.26 (0.66–2.41) | 0.49 |
| Fourth cycle (18 versus 27) | 4 (22.2%) | 1 (3.7%) | 5.99 (0.73–50.0) | 0.05 |
| Fifth and sixth cycle | 0 | 0 | ||
| Ongoing pregnancy | 108 (43.2%)d | 119 (45.6%)e | 0.95 (0.78–1.15) | 0.29 |
| Multiple pregnancyb | 5 (2.0%) | 8 (3.1%) | 0.65 (0.22–1.97) | 0.45 |
| Conception mode (% of live birth) | 0.29 | |||
| Spontaneous | 18 (17.0%) | 14 (12.0%) | ||
| IVF/ICSI freshc | 74 (69.8%) | 85 (72.6%) | ||
| IVF/ICSI frozen | 14 (13.2%) | 15 (12.8%) | ||
| Unknown | 0 | 3 (2.6%) | ||
| Time to ongoing pregnancy leading to live birth, days (mean, SD) | 212 (133) | 197 (135) | 0.40 | |
FU, follow-up; RR, relative risk. P-value are calculated by using a Chi-square test or an independent samples t-test.
aShown with a maximum of one event per woman.
bBased on the number of multiple ongoing pregnancies.
cIncluding live births from escape IUI treatments.
dOne woman with an immature birth and one woman with a foetal demise.
eOne woman with an immature birth and one woman with a foetal demise.
Cumulative treatment cycle results.
| AFC 0–10 | |||
|---|---|---|---|
| Results 18 months follow-up | 450/225 IU (n = 250) | 150 IU (n = 260) | P-value |
| Number of fresh cycles per woman | 2.1 (0.9) | 2.1 (1.1) | 0.29 |
| Total number of fresh cycles started | 513 | 558 | |
| First cycle | 250 (100%) | 260/261 (99.6%) | |
| Second cycle | 165 (66.0%) | 176 (67.7%) | |
| Third cycle | 79 (31.6%) | 87 (33.3%) | |
| Fourth cycle | 18 (7.2%) | 27 (10.3%) | |
| Fifth cycle | 1 (0.4%) | 6 (2.3%) | |
| Sixth cycle | 0 | 2 (0.8%) | |
| Cancellation classification | <0.001c | ||
| No cancellation | 464 (90.4%) | 444/557 (79.7%) | <0.001c,d |
| Insufficient growth | 36 (7.0%) | 99/557 (17.8%) | <0.001c,d |
| Excessive response | 3 (0.6%) | 1/557 (0.2%) | 0.34c,d |
| Other | 10 (1.9%) | 13/557 (2.3%) | 0.67c,d |
| Number of oocytesa | 7.6 (5.0) | 6.4 (4.3) | 0.002c |
| Poor response | 178/510 (34.9%) | 275/556 (49.5%) | <0.001c |
| Hyper response | 44/510 (8.6%) | 19/556 (3.4%) | 0.003c |
| Number of fresh embryos for transfera | 3.6 (3.1) | 3.1 (2.7) | 0.04c |
| Number of fresh embryo transfers | 399 (77.8%) | 385/557 (69.1%) | 0.005c |
| Number of fresh embryos/transfer | 1.3 (0.5) | 1.3 (0.5) | 0.60c |
| Number of frozen embryosb | 3.0 (2.2) | 2.6 (1.7) | 0.11c |
| OHSS overall | 6/509 (1.2%) | 10/555 (1.8%) | 0.45c |
| Number of cryo cycles with transfer/woman | 0.7 (1.2) | 0.6 (1.1) | 0.49 |
| Number of frozen embryos/transfer | 1.1 (0.4) | 1.1 (0.3) | 0.42c |
Data are presented as mean (SD) or number (%). OHSS, ovarian hyperstimulation syndrome.
aBased on the women who had an ovum pick-up.
bBased on the women who had frozen embryos.
cP-value calculated by using a generalized estimating equation model.
dPost hoc testing, P-value is considered to be significant when <0.013 (Bonferroni correction (0.05/4)).
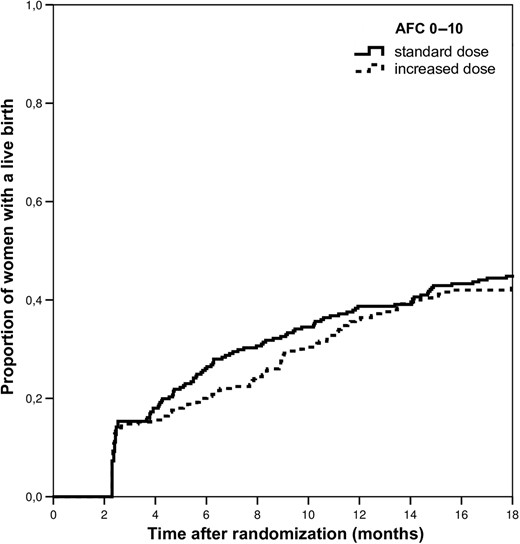
Cumulative live birth incidence in predicted poor responders. Log-rank = 0.511.
First cycle results
First cycle treatment results are summarized in Table IV. Despite a lower number of oocytes and a lower fresh embryo transfer rate in the standard dose group, first cycle live birth rates were not significantly different [17.6% versus 20.0%, RR 0.88 (95% CI, 0.61–1.26), P = 0.49].
First treatment cycle results.
| AFC 0–10 | |||
|---|---|---|---|
| First cycle results | 450/225 IU (n = 250) | 150 IU (n = 260) | P-value |
| Total FSH used IU | 3705 (1616) | 1871 (542) | <0.001 |
| Cancellation classification | <0.001 | ||
| No cancellation | 231 (92.4%) | 199 (76.5%) | <0.001c |
| Insufficient growth | 16 (6.4%) | 58 (22.3%) | <0.001c |
| Excessive response | 1 (0.4%) | 0 | 0.31c |
| Other | 2 (0.8%) | 3 (1.2%) | 0.69c |
| Number of oocytesa | 7.9 (5.3) | 6.5 (4.2) | 0.003 |
| Poor response | 86 (34.4%) | 134 (51.5%) | <0.001 |
| Hyper response | 26 (10.4%) | 7 (2.7%) | <0.001 |
| Number of embryos for transfera | 3.8 (3.5) | 3.2 (2.6) | 0.04 |
| Number of fresh embryo transfers | 195 (78.0%) | 175 (67.3%) | 0.007 |
| Number of frozen embryosb | 3.3 (2.5) | 2.7 (1.7) | 0.09 |
| OHSS | 5/249 (2.0%) | 7 (2.7%) | 0.61 |
| Number of cryo cycles with transfer/woman | 0.4 (0.8) | 0.4 (0.8) | 0.85 |
| Number of cryo embryos per transfer | 1.1 (0.3) | 1.2 (0.4) | 0.36d |
| Live birth (fresh only) | 37 (14.8%) | 41 (15.8%) | 0.76 |
| Live birth (fresh and cryo) | 44 (17.6%) | 52 (20.0%) | 0.49 |
Data are presented as mean (SD) or number (%).
aBased on the women who had an ovum pick-up.
bBased on the women who had frozen embryos.
cPost hoc testing, P-value is considered to be significant when <0.013 (Bonferroni correction (0.05/4)).
dP-value calculated by using a generalized estimating equation model.
Pre-specified additional analyses
In women with an AFC 8–10, an increased FSH dose led to a higher number of oocytes and a higher proportion of hyper responses but without improving cumulative live birth rates as compared to a standard dose [live birth rates 47.4% versus 47.1%, respectively; RR 1.01 (95%CI, 0.78–1.29), P = 0.96, see Supplementary Table SI, Supplementary Figure 1]. The first treatment cycle showed similar results, except for a higher proportion of poor responses in the standard dosing group (Supplementary Table SII).
For women with an AFC 0–7, cumulative results revealed less poor response and more normal- and hyper responses in women allocated to the increased dose strategy as compared to the standard strategy. Despite more fresh embryo transfers in women allocated to the increased dose, no significant effect on live birth rates was found [36.3% versus 42.1%, respectively, RR 0.86 (95%CI, 0.62–1.19), P = 0.36; Supplementary Table SI, Supplementary Figure S2]. With respect to the first cycle results, women in the standard group more often showed a poor response, were more likely to be cancelled in case of insufficient follicle growth and had less fresh embryo transfers (Supplementary Table SII). These results however did not lead to significant differences in first cycle live birth rates between treatment strategies (Supplementary Table SII).
In the per protocol analysis, 73/246 (29.7%) women that were allocated to the increased FSH dose had an ongoing pregnancy resulting in live birth compared to 82/250 (32.8%) women that were allocated to the standard FSH dose [RR 0.90 (95%CI, 0.70–1.18), P = 0.45].
Health economic evaluation
An increased FSH dose is more expensive [€6397 versus €5298, mean difference costs per woman €1099 (95%CI, 562–1591)] while it does not increase live birth rates (Supplementary Table SIII). Therefore, standard dosing has to be considered the dominant strategy in predicted poor responders (Supplementary Figure S3 and S4).
Discussion
This study shows that in women undergoing IVF/ICSI with a predicted poor response (defined as AFC < 11) increased FSH dosing does not improve live birth rates, while it increases treatment costs as compared to a standard dose regimen. Subgroup analyses in women with an AFC 0–7 or AFC 8–10 further strengthen the overall result as increased dosing is not beneficial with respect to live birth rates in either of these groups.
It is difficult to directly compare our results with previous findings as none of the available RCTs evaluated the effect of an increased FSH dose on cumulative live birth rates nor assessed the cost-effectiveness of such a strategy. Nonetheless, our results are in line with several previous RCTs on increased FSH dosing in predicted poor responders (Harrison et al., 2001; Klinkert et al., 2005; Berkkanoglu and Ozgur, 2010; Lefebvre et al., 2015). These RCTs, however, suffered from methodological weaknesses which were summarized in a recent systematic review on individualized dosing (van Tilborg et al., 2016). Most studies on poor responders included a heterogeneous group of women with both predicted and proven poor responders. Such a heterogeneous study population makes it more difficult to assess the true effect of an intervention as it is likely that expected and unexpected poor responders have a different prognosis (Klinkert et al., 2004). In contrast to our findings, one small study by Popovic-Todorovic et al. (2003) reported that individualized FSH dosing based on a multi-factor algorithm resulted in a higher ongoing pregnancy rate after the first IVF/ICSI treatment cycle as compared to a standard dose of 150 IU/day. This study mainly included women with a good prognosis and was not powered to find a difference in ongoing pregnancy rates.
A recently published RCT showed that mild ovarian stimulation consisting of a GnRH antagonist protocol with a daily FSH dose of 150 IU led to similar single cycle ongoing pregnancy rates in predicted or actual poor responders as compared to treatment with a GnRH agonist protocol and 450 IU/day HMGs (Youssef et al., 2017). Although this study compared two totally different stimulation protocols instead of just two different FSH dosages, it confirms that high dosages of gonadotrophins will not improve IVF outcomes in predicted poor responders (Land et al., 1996).
For women with an AFC 0–7, the cumulative incidence curves for live birth indicated that women in the increased dose group had a 10% lower cumulative live birth rate after 8 months of randomization, despite a lower cancellation rate, as compared to the standard dose group (Supplementary Figure 2). At 18 months of follow-up, a possible clinically relevant (though statistically non-significant) difference of 6% remained in the advantage of the standard FSH dose group (see Supplementary Table I). A retrospective study analysing over 600 000 fresh COS cycles showed that an average daily FSH dose >300 IU resulted in a statistically decreased live birth rate irrespective of the number of oocytes retrieved or a woman's age, even in women without a diagnosis of a diminished ovarian reserve (Baker et al., 2015). As an explanation for this observation, one might hypothesize that a high exogenous FSH dose induces chromosomal abnormalities in embryos derived from IVF/ICSI (Munne et al., 1997; Katz-Jaffe et al., 2005; Baart et al., 2006). Another explanation might be found in the disturbed endometrial receptivity in women treated with a high FSH dose, as the pregnancy results from fresh cycles were lower but no difference was found in pregnancy rates from cryo/thaw cycles (Munch et al., 2017).
One of the main strengths of this multicentre RCT is the fact that the study was powered to report live birth rates, which is the outcome of interest for infertile couples (Fauser et al., 2005; Legro et al., 2014). Furthermore, not just single cycle live birth rates, but results from consecutive cycles performed within an 18-month period of follow-up were evaluated thereby mimicking daily practice (Scholten et al., 2016). Other strengths include the low proportion of loss to follow-up and the performance of an intention-to-treat analysis, both leading to an increased reliability of our outcomes (Higgins and Altman, 2011). Besides, this is the first RCT that performed a cost-effectiveness analysis, which provides essential information before implementation of study results might be considered.
Some limitations of the study need to be addressed. A potential weakness concerns the multiple AFC observers since inter-observer variability is known to be present (Scheffer et al., 2002; Broekmans et al., 2010). To minimize inter-observer variation, observers were trained by arranging AFC workshops and offering instructions for the AFC procedure prior to the start of the study (Broekmans et al., 2010). The remaining variability reflects daily practice variation and could also be seen as a strength of the study as this increases the generalizability of the results. Furthermore, based on the baseline characteristics from the OPTIMIST trial as a whole, we can conclude that the AFC is an adequate response predictor because age and AMH distributions, other factors associated with response prediction, show expected patterns over the AFC subgroups (van Tilborg et al. 2017). Live birth rates in predicted poor responders, normal responders (data not shown) and hyper responders (Oudshoorn et al., 2017) further confirm the assumption that AFC is an adequate tool. Nonetheless, some concern regarding the AFC operator accuracy may be raised as OHSS events occurred in predicted poor responders randomized to 150 IU/day. These OHSS events were spread over many centres and most of these women had less than 15 oocytes at oocyte retrieval (data not shown). As the AFC has a certain inter- and intra-observer variation we also studied the data from women classified as predicted poor responders based on AMH and treated with a standard dose. A similar proportion of women classified as predicted poor responder based on AMH (AMH ≤ 0.769 ng/ml and AMH 0.770–1.330 ng/ml) developed OHSS (data not shown). So, it is likely that using AMH will not prevent misclassification with respect to response prediction. These results are in line with previous studies that show similar test accuracy (receiver operating characteristic) for AMH and AFC for the prediction of both poor and excessive response (Broer et al., 2013a, 2013b). Unfortunately, test accuracy will never be perfect, as there will always be some misclassification in response prediction (i.e. false positives and false negatives). Nevertheless, recent reports suggest that AMH is a better ovarian response predictor, and could therefore be a better tool for dose individualization (Iliodromiti et al., 2015; Nelson et al., 2015a) but evidence directly comparing AMH- with AFC-based dosing is scarce (Lan et al., 2013). AMH is likely to be a more stable biomarker, but challenges remain with different assays and different laboratories (Broer et al., 2014; Nelson et al., 2015b). An additional analysis by using AMH cut-offs for response prediction and subsequent individualized dosing on the overall OPTIMIST data revealed comparable treatment and live birth results as compared to AFC-based dosing (van Tilborg et al., 2017). Another limitation might be the permitted between-cycle dose adjustments in the standard dose strategy. Although, criteria for those adjustments were pre-specified in the protocol it might have introduced performance bias due to selective cancellation in the standard dose group since this was an open-label trial. In the first cycle results of the AFC 0–7 subgroup, we found more cancellations in the standard group for not fulfilling the HCG criterion. Nonetheless, despite fewer cancellations in the increased dose group, no benefit on first cycle live birth rates was found (see Supplementary Table II). So, if this selective cancelling in the standard dose group would have negatively influenced the live birth rate, it is hypothetically possible that standard dosing would have been superior to increased dosing in women with an AFC 0–7.
The choice to allow two different types of GnRH analogues could be considered a flaw in the study design. In total, 80% of the women were treated by GnRH agonist co-treatment with a similar proportion between both strategy groups. Although, there is no consensus about what is the best protocol for predicted poor responders, a long GnRH agonist protocol has been claimed to be co-treatment of choice for predicted poor responders, especially in older women (Sbracia et al., 2005, 2009). However, based on more recently published papers, it is unlikely that the inclusion of both types of GnRH analogue co-treatment influenced the overall live birth rate (Al-Inany et al., 2016; Toftager et al., 2017; Youssef et al., 2017).
As our study was designed prior to the publication of the Bologna criteria, the poor response definition used in this study does not fully match the Bologna criteria (Ferraretti et al., 2011). Recently, the POSEIDON group published a new classification for ‘low prognosis’ patients based on either age, ovarian reserve parameters prior to ovarian stimulation, with or without the number of oocytes retrieved (Humaidan et al., 2016; Poseidon Group et al., 2016). In contrast to our study design, their groups all include a combination of age and ORT. Further OPTIMIST data analyses are planned to evaluate whether the efficacy of individualized dosing based on AFC is influenced by age. Furthermore, the OPTIMIST data provide the opportunity to evaluate whether unexpected poor responders benefit from a dose-adjustment in a subsequent treatment cycle as it is unclear from current literature what policy should be recommended for these women. Unexpected poor responders seem to have other biological characteristics and prognosis and may form a different entity than the predicted poor responder (Klinkert et al., 2004).
As this RCT indicates that increased FSH dosing should not be used in predicted poor responders, the question remains whether it is (cost-)effective to perform an ORT in all women starting IVF/ICSI treatment with the objective to personalize the FSH strategy in certain subgroups of women. In line with this RCT, the overall OPTIMIST study shows that standard dosing (150 IU/day), so without performing an AFC, is the dominant strategy (van Tilborg et al., 2017). The results for reduced FSH dosing in predicted hyper responders are described by Oudshoorn et al. (2017), in which no benefit on cumulative live birth rates was reported, although an advantage regarding safety could not be ruled out.
In conclusion, in women with a predicted poor response starting their IVF/ICSI treatment, increased FSH dosing based on the AFC does not improve live birth rates while it increases costs. Therefore, physicians should accept that prescribing above standard FSH doses in predicted poor responders is not effective.
Supplementary data
Supplementary data are available at Human Reproduction online.
Acknowledgement
We thank the women who participated in this study, the staff of the participating hospitals, and the office members of the Dutch Consortium for their contribution.
Authors’ roles
M.J.C.E., H.L.T., F.J.M.B. and B.W.J.M. designed the trial. T.C.T., H.L.T., F.J.M.B. and B.W.J.M. coordinated the trial. T.C.T., S.C.O., C.A.M.K., H.R.V., A.W.N., G.J.S., A.P.M., B.C.S., A.S., A.V., J.S.E.L., F.J.M.B. and all other members from the OPTIMIST study group collected data. M.J.C.E. and H.G. provided input on the statistical analyses. T.C.T. and M.J.C.E. performed the analyses. T.C.T. drafted the manuscript. T.C.T., M.J.C.E., H.L.T., F.J.M.B. and B.W.J.M. interpreted the data. All authors revised the report, and approved the final submitted version.
Funding
This study was funded by The Netherlands Organisation for Health Research and Development (ZonMW number 171102020).
Conflict of interest
T.C.T., H.L.T. and S.C.O. received an unrestricted personal grant from Merck BV. H.R.V. receives monetary compensation as a member on an external advisory board for Ferring pharmaceutical BV. B.W.J.M. is supported by a NHMRC Practitioner Fellowship (GNT1082548) and reports consultancy for OvsEva, Merck and Guerbet. F.J.M.B. receives monetary compensation as a member of the external advisory board for Ferring pharmaceutics BV (the Netherlands) and Merck Serono (the Netherlands) for consultancy work for Gedeon Richter (Belgium) and Roche Diagnostics on automated AMH assay development (Switzerland) and for a research cooperation with Ansh Labs (USA). All other authors have nothing to declare.
References
Author notes
OPTIMIST study group: Theodora C. van Tilborg, Simone C. Oudshoorn, Marinus J.C. Eijkemans, Monique H. Mochtar, Carolien A.M. Koks, Ron J.T. van Golde, Harold R. Verhoeve, Annemiek W. Nap, Gabrielle J. Scheffer, A. Petra Manger, Annemieke Hoek, Bendictus C. Schoot, G. Jur E. Oosterhuis, Walter K.H. Kuchenbecker, Kathrin Fleischer, Jan Peter de Bruin, Alexander V. Sluijmer, Jaap Friederich, Arie Verhoeff, Marcel H.A. van Hooff, Evert J.P. van Santbrink, Egbert A. Brinkhuis, Jesper M.J. Smeenk, Janet Kwee, Corry H. de Koning, Henk Groen, Madelon van Wely, Cornelis B. Lambalk, Joop S.E. Laven, Ben Willem J. Mol, Frank J.M. Broekmans, Helen L. Torrance.
