


Abstract
Could we construct and validate a preoperative score to predict rectosigmoid involvement in endometriosis (RE)?
We developed a simple preoperative score (ENDORECT) to predict RE.
Accurate preoperative classification is important to optimize the surgical approach for patients with endometriosis but there is currently no reliable first-line examination to determine RE.
This was a single-centre observational study including all women (N = 119) who underwent complete surgery for endometriosis between January 2011 and June 2016 in the Gynaecological Department of the University Hospital of Poissy Saint-Germain en Laye.
Of the 119 women, 47 had RE and 72 did not. Two-thirds of the patients were randomly selected to derive the predictive score based on multiple logistic regression with internal validation by bootstrap. We used information from a self-assessment questionnaire, digital and speculum examination, transvaginal ultrasound and MRI. The score was then applied to the remaining sample of patients for validation.
Four variables were independently associated with RE: palpation of a posterior nodule on digital examination (aOR=5.6; 95%CI [1.7–21.8]); a UBESS score of 3 on ultrasonography (aOR=4.9; 95%CI [1.4–19.8); RE infiltration on MRI (aOR=6.8; 95%CI [2–25.5]); and presence of blood in the stools during menstruation (aOR=5.2; 95%CI [1.3–24.7]). The ROC-AUC of the model was 0.86 (95%CI [0.77–0.94]) and the bootstrap procedure showed that the model was stable. The ENDORECT score was derived from these four criteria and three risk groups were identified: the high-risk group (score>17) had a probability of RE of 100% with an specificity (Sp) of 100%, postive likelihood ratio (Lr+)>10; the intermediate-risk group (score: 7–17) had a probability of RE of 42%; and the low-risk group (score=0), with a sensitivity (Se) of 97%, negative likelihood ratio (Lr-) of 0.07 and a probability of RE of 5%. In the validation cohort, a score >17 predicted RE with an Sp of 96, Lr+ of 9.2, and probability of RE of 83%. Patients in this sample with a score=0, had an Se of 100%, Lr- of 0 and a probability of RE of 0%.
The single-centre recruitment and over-representation of RE could constitute a referral bias.
The use of a preoperative predictive score could facilitate patient counselling and guide surgical management. Both MRI and transvaginal ultrasound provide independent information and are useful before surgery for RE.
No financial support was specifically received for this study. The authors declare no conflict of interest
N/A.
Introduction
Rectosigmoid involvement in endometriosis (RE) occurs in 33% of women with deep infiltrating endometriosis (DIE) and is the most common site of extragenital endometriosis (80%) (Squifflet et al., 2002; Darai et al., 2007; Lewis and Nezhat, 2007). Preoperative detection of intestinal lesions in women with endometriosis is crucial to ensure optimal surgical management of both gynaecological and intestinal endometriotic lesions (Slack et al., 2007). Consequently, visceral and gynaecological surgeons must collaborate before surgery to inform the patients of the risks of intestinal resection, stomia and complications (Kondo et al., 2011)). However, accurate preoperative diagnostic assessment of endometriosis is currently hard to perform.
The predictive performance of both transvaginal ultrasonography (TVUS) and pelvic magnetic resonance imaging (MRI) to diagnose rectal endometriosis has been shown to have a sensitivity and specificity of more than 90% (Bazot et al., 2004; Nezhat et al., 2017). Thus, either of these examinations may be considered sufficient to decide whether there is a need for digestive surgery. However, patients included in these studies are selected from specialized endometriosis referral centres. This suggests that the diagnostic performance of the examinations may be overestimated due to the high level of expertise of the radiologists compared to those in less experienced centres (Rosefort et al., 2018).
If RE is suspected, third-line imaging, such as a colonoscanner or endorectal ultrasonography (ERUS), is usually carried out as part of the preoperative assessment to confirm the digestive involvement and to specify its characteristics (uni- or multifocality, the diameter of the lesion, depth of infiltration, height, circumference, stenotic character) (Collinet et al., 2018). These examinations are of excellent diagnostic value to detect RE (Bazot et al., 2009; Philip and Dubernard, 2018). However, unlike MRI and TVUS, ERUS is an invasive procedure which is poorly tolerated by patients (Chapron et al., 2004) Furthermore, these procedures are time- and cost-consuming. Consequently, they should be considered as third-line examinations and conducted only in patients with a high suspicion of RE. To date there are no reliable preoperative criteria to indicate whether a patient should undergo thorough imaging sequences before having surgery for DIE.
This study makes it possible to predict, among patients who will be operated on for endometriosis, those who have a high risk for rectal involvement (requiring a more risky and more invasive surgical procedure).
Thanks to the elements available during the pre-operative check-up (clinical examination, interrogation, results of the ultrasound and the pelvic MRI), the surgeon will be able to calculate a score which will make it possible to evaluate this risk.
This will provide better information to patients prior to surgery and better planning of preoperative assessment and surgery.
The aim of the present study was to identify the best combination of preoperative information available from routine evaluation to predict RE and to construct a predictive score for colorectal involvement to minimize unnecessary examinations before surgery.
Materials and methods
This was a single-centre observational study in the Gynaecological Department of the University Hospital of Poissy Saint-Germain en Laye (France).
Study population
The patients were extracted from a prospective database that included all patients who underwent surgery for endometriosis because of chronic pelvic pain or infertility between January 2011 and June 2016. For the purpose of the present study, we included consecutive patients over 18 years old who had completed a standardized pelvic pain symptoms and quality-of-life (QoL) self-assessment questionnaire (Chapron et al., 2005), and who had undergone systematic TVUS examination and MRI before surgery. We excluded patients without histologically proven endometriosis, those who had already had surgery for posterior DIE, and those who had intestine localizations other than rectosigmoid (appendicular, ileocecal, small intestine). Patients for whom there was a suspicion of RE on preoperative evaluation or during laparoscopy, but who did not undergo a complete surgical exploration and excision of the endometriotic foci of the posterior compartment, were considered as having an uncertain diagnosis and were thus excluded.
Data collection
The characteristics of pelvic pain and complaints about the lower urinary and gastrointestinal tracts were collected from a self-assessment questionnaire specifically developed to predict posterior DIE (Chapron et al., 2005).
A standardized form was used to collect the medical data of the prospective cohort including lesions of vaginal endometriosis on speculum examination and palpation of a posterior nodule on digital examination.
All the imaging data were recorded retrospectively from the MRI and TVUS reports by one assessor who was blinded to the surgical and anatomopathological data. If DIE was identified on TVUS or MRI, its location, aspect (nodule or infiltration), size and rectosigmoid involvement were recorded, as well as the presence of endometrioma (number, size and side) and adenomyosis (location, depth). Ovarian mobility and obliteration or adhesion of the pouch of Douglas on TVUS was also collected and the UBESS staging (Ultrasound Based Endometriosis Staging System) (Menakaya et al., 2016) was calculated. MRI and TVUS were performed by one of our expert radiologists in endometriosis. However, we did not repeat these exams for patients who had undergone imaging in another centre before their consultation. When information of an item needed to calculate the UBESS score was missing from the ultrasound report, it was considered to be free from the item.
The locations of the endometriosis implants and the subtype of endometriosis (superficial endometriosis only, endometriomas and DIE) were reported on a standardized description sheet of anatomical endometriotic lesions. For cases of DIE, the depth of infiltration was reported to define the type of endometriosis according to a previously published DIE classification system (Chapron et al., 2003). The extent of the disease was also assessed according to the standards set by the American Society of Reproductive Medicine (ASRM, 1997). Surgical procedures were described according to the Consensus on Recording Deep Endometriosis Surgery (CORDES) statement (Vanhie et al., 2016).
Gold standard
RE was defined as one or more nodules infiltrating the muscle layer of the intestinal wall during complete excisional surgery. RE excisional surgery included intra-muscularis bowel shaving resection without suture of the muscularis defect, bowel partial thickness discoid excision with suture of the muscularis defect, bowel full thickness discoid excision, bowel resection and re-anastomosis (Vanhie et al., 2016).
Patients who did not have intestinal surgery to remove the endometriotic implants or those who had a serosal resection which did not involve the rectosigmoid muscularis (e.g. radical Douglasectomy) were considered as not having RE.
Statistical analysis
A random sample of two-thirds of the patients was obtained prior to analysis to derive a prediction model (derivation sample). The remaining one-third of the patients were retained for validation (validation sample).
The patients from the derivation sample with and without RE were compared using Pearson’s χ2 test for qualitative variables (or Fisher’s exact test for small samples) and the Student’s T-test for quantitative variables. Ordinal and continuous variables that yielded p-values of 0.10 in the univariate analysis were dichotomized based on the area under the receiver operating characteristic (ROC) curve (ROC-AUC). For each variable that was significantly associated with having RE, we computed the Crude diagnostic odds ratios (OR) with their 95% confidence intervals (95% CI), sensitivity (Se), specificity (Sp), positive likelihood ratio (Lr+) and negative likelihood ratio (Lr-).
Multiple logistic regression analysis was then used to select the best model for predicting RE. Variables yielding p-values lower than 0.05 in the univariate analysis were included into the logistic regression model. Several forward and backward stepwise procedures were used to obtain the best combination of variables associated with RE with a p threshold < 0.05 (Harrell et al., 1996). A bootstrap resampling procedure was applied to the model to estimate the distribution of each logistic regression coefficient to remove variables potentially responsible for instability in the model (Steyerberg, 2009). Calibration of the predictive model was tested by the Hosmer and Lemeshow test and QQ plots. Missing data were handled by multiple imputations.
Adjusted diagnostic odds ratios (aOR) of the variable entered in the final prediction model were computed with their 95% confidence intervals (95% CI). A score was then calculated based on items of the best predictive model. The number of predictive score points contributed by each score item was obtained by rounding up the bootstrapped aOR to generate a simple scale. The ROC-AUC of the score was then compared with the ROC-AUC of the logistic regression using the DeLong test (Demler et al., 2012) to check that the two values were not significantly different from each other. The probability of RE (P = 1/ [1 + exp (-(α-β*score))]), Se, Sp, Lr+ and Lr- were calculated for each score value in the derivation cohort.
We classified patients as having a high, intermediate or low risk of RE by choosing two cut-off values of the score: (i) to rule out RE, Se had to be at least 95% and the Lr- lower than 0.25; (ii) the rule-in cut-off was an Sp of at least 90% and an Lr+ greater than 4 (Buckley et al., 1998).
Finally, the two prediction rules were applied to the validation sample and the results were compared with the final diagnosis to assess their predictive abilities.
Analyses were carried out using R 3.3.2 (2016-10-3).
Our work complied with French statutes and regulations, which authorize epidemiological surveys without advance approval of an ethics committee. Our survey involved no intervention and was thus exempt from the French statute on biomedical research (Huriet-Serusclat law, dated 20 December 1998). We complied with all French statutes concerning subjects’ data, confidentiality and restrictions (e.g. no religious or racial data).
Results
During the study period, 215 women underwent surgery for endometriosis and 153 met the inclusion criteria. However, 34 patients were excluded (Fig. 1) leaving 119 patients included for analysis. Among these, 47 had RE (39.5%) (Fig. 1). After random selection, the derivation sample comprised 79 patients, of whom 31 had RE and 48 did not, and the validation sample 40 patients of whom 16 had RE and 24 did not. The main characteristics of the patients from the derivation and validation datasets are summarized in Table I.
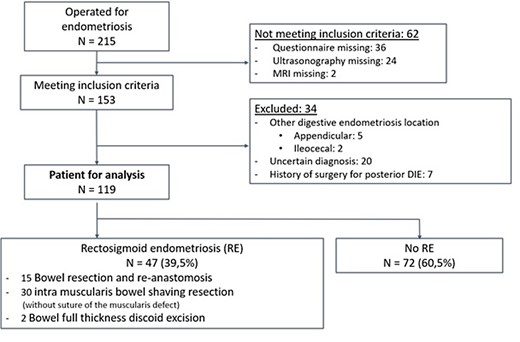
Flow-chart.
Population characteristics in the derivation and validation samples: N = 119
| Derivation sample | Validation sample N = 40 | pb | ||||
|---|---|---|---|---|---|---|
| All N = 79 | RE + N = 31 | RE – N = 48 | pa | |||
| Age (years), mean ± SD | 33.3 ± 7.4 | 33.7 ± 5.9 | 33.1 ± 8.3 | 0.72 | 33.6 ± 6.7 | 0.862 |
| BMI (Kg/m2), mean ± SD | 23.2 ± 3.41 | 23.4 ± 4.1 | 23.1 ± 2.9 | 0.70 | 24.3 ± 5.62 | 0.262 |
| Gravidity, mean ± SD | 0.79 ± 1.23 | 0.77 ± 1.14 | 0.80 (1.2) | 0.92 | 1.13 ± 1.64 | 0.297 |
| Parity, mean ± SD | 0.54 ± 0.834 | 0.5 ± 0.7 | 0.6 (0.9) | 0.44 | 0.63 ± 0.964 | 0.634 |
| Previous pelvic surgery, n (%) | 30 (38) | 10 (32.3) | 20 (41.7) | 0.40 | 25 (64.1)5 | 0.007 |
| Previous endometriosis surgery, n (%) | 22 (28.2)5 | 14 (45.2) | 8 (16.7) | 0.007 | 16 (41)5 | 0.163 |
| TVUS by expert radiologist, n (%) | 37 (48.1)6 | 15 (48.4) | 22 (45.83) | 0.78 | 18 (48.6)2 | 0.952 |
| MRI by expert radiologist, n (%) | 36 (46.8)6 | 15 (48.4) | 21 (43.8) | 0.81 | 18 (45) | 0.857 |
| Endorectal ultrasonography, n (%) | 42 (54.5)6 | 28 (90.3) | 14 (29.2) | <0.001 | 26 (66.7)5 | 0.211 |
BMI: Body Mass Index – Derivation sample: 2/3 (N = 79) of the whole sample (N = 119), used to develop the predictive model and score - n: Number of patients - p: p-value - RE: Presence (+) or absence (-) of Rectal Endometriosis – SD: Standard deviation – Validation sample: the remaining 1/3 (N = 40) of the whole sample (N = 119) used to validate the score.
a: p-value of the comparison between RE+ and RE- groups in the derivation sample.
b: p-value of the comparison between all women in the derivation and validation samples.
1: 4 missing values.
2: 3 missing values.
3: 13 missing values.
4: 10 missing values.
5: 1 missing value.
6: 2 missing values.
The percentages are calculated on the entire patient population despite some missing values
Derivation cohort
The diagnostic performance characteristics of the variables associated with RE in the univariate analysis are shown in Table II.
Diagnostic performance characteristics of the selected criteria in the univariate analysis in derivation sample (N = 79)
| Variable | n/Na | Se (%) | Sp (%) | Lr+ | Lr- | OR[95%CI] | p | AUC |
|---|---|---|---|---|---|---|---|---|
| Lesion of vaginal endometriosis on speculum examination | 11/78 | 26.7 | 93.8 | 4.27 | 0.78 | 5.5 [1.3–22.6] | 0.018 | 0.60 |
| Palpation of a posterior nodule on digital examination | 37/76 | 75.9 | 68.1 | 2.38 | 0.36 | 6.7 [2.3–19.1] | <0.001 | 0.72 |
| Posterior DIE on TVUS | 38/78 | 66.7 | 62.5 | 1.8 | 0.5 | 3.3 [1.3–8.7] | 0.012 | 0.65 |
| Visualization of a posterior nodule on TVUS | 21/73 | 44.4 | 80.4 | 2.3 | 0.7 | 3.29[1.1–9.4] | 0.02 | 0.62 |
| Posterior nodule > 5 mm on TVUS | 13/66 | 40 | 92.7 | 5.5 | 0.6 | 8.44 [2–35] | 0.003 | 0.66 |
| Rectosigmoid infiltration on TVUS | 14/78 | 30 | 89.6 | 2.9 | 0.8 | 3.7 [1.1–12.4] | 0.03 | 0.60 |
| TVUS UBESS stage = 3 | 27/78 | 53.3 | 77.1 | 2.3 | 0.6 | 3.8 [1.4–10.3] | 0.006 | 0.65 |
| Posterior DIE on MRI | 60/79 | 90.3 | 33.3 | 1.4 | 0.3 | 4.7 [1.2–17.7] | 0.019 | 0.62 |
| Visualization of a posterior nodule on MRI | 27/72 | 58.6 | 76.7 | 2.5 | 0.5 | 4.7 [1.7–13] | 0.002 | 0.68 |
| Rectosigmoid infiltration on MRI | 23/78 | 54.8 | 87.2 | 4.3 | 0.5 | 8.3 [2.7–25.2] | < 0.001 | 0.71 |
| Defecation pain (during or outside of menstruation) | 56/78 | 86.7 | 37.5 | 1.4 | 0.4 | 3.9 [1.2–13] | 0.023 | 0.62 |
| Abdominal bloating during menstruation | 53/69 | 96.4 | 36.6 | 1.5 | 0.01 | 15.6 [1.9–127] | 0.001 | 0.67 |
| Blood in stools (during or outside of menstruation) | 16/77 | 32.3 | 87 | 2.5 | 0.8 | 3.2 [1.01–9.9] | 0.041 | 0.60 |
AUC: Area Under the ROC curve – DIE: Deep Infiltrating Endometriosis – Lr+ or -: Positive or negative likelihood ratio – MRI: Magnetic Resonance Imaging – n: patients with criterion – N: Total of patient– OR: Diagnostic Odds ratio – p: p-value – Se: Sensitivity – Sp: Specificity – TVUS: Transvaginal ultrasonography - UBESS: Ultrasound Based Staging System - 95%CI: 95% Confidence Interval
a: Because of missing data, total may differ from 79 (for example, N = 78 implies one missing value).
Multiple regression analysis allowed us to build a robust predictive model for RE with four variables: palpation of a posterior nodule on digital examination; a UBESS score of 3 on TVUS (bowel DIE +/- immobile endometrioma +/− abnormal pouch of Douglas); rectosigmoid infiltration on MRI; and presence of blood in the stools during menstruation. The aORs and their 95% CIs are reported in Table III. The ROC-AUC of the model was 0.86 (95%CI [0.77–0.94]) (Fig. 2) and the bootstrap procedure showed that the CIs of the estimated coefficients of the logistic regression were stable (Table III). Calibration of the model was satisfactory (Hosmer and Lemeshow test: P = 0.393).
Multiple regression logistic model to predict RE in the derivation sample (N = 79)
| Variables | aOR [95%CI] | aOR [95%CI] after bootstrap | p |
|---|---|---|---|
| Palpation of a posterior nodule on digital examination | 5.6 [1.7–21.8] | 8.2 [1.6–38.3] | 0.008 |
| Ultrasonographic UBESS stage = 3 | 4.9 [1.4–19.8] | 7.5 [1.6–42.7] | 0.016 |
| Rectosigmoid infiltration on MRI | 6.8 [2–25.5] | 9.5 [1.8–60.9] | 0.003 |
| Blood in stools (during or outside of menstruation) | 5.2 [1.3–24.7] | 7.3 [1.3–38.2] | 0.025 |
AUC = 0.86.
aOR: Adjusted diagnostic odds ratio – [95%CI]: 95% confidence interval – UBESS: Ultrasound Based Staging System – MRI: Magnetic Resonance Imaging – AUC: Area Under the ROC curve – p: p-value.
All women in the derivation sample were included in the analysis. Missing data were handled by multiple imputations.
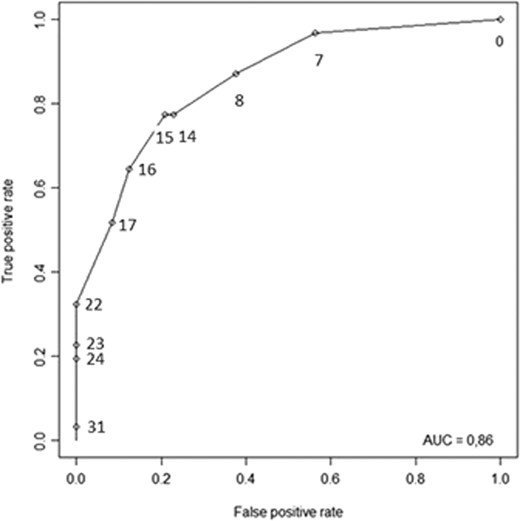
ROC curve of the ENDORECT score. Points illustrate the values of Se and 1-Sp for each possible value of the endorect score.
The RE predictive score (ENDORECT) was thus calculated as follows: RE score = (8 x palpation of a posterior nodule at digital examination) + (7 x TVUS UBESS stage = 3) + (9 x rectosigmoid infiltration on MRI) + (7 x blood in the stools (during or outside of menstruation) (Table IV). The risk of RE was calculated by logistic transformation: risk of RE = exp(score*0.27–3.37) / (1 + exp(score*0.27–3.37)). The calculated risk for each value of the ENDORECT score are shown in Fig. 3. The ROC curve of the ENDORECT score is reported in Fig. 2. The ROC-AUC of the score was 0.86 (95%CI [0.77–0.94]), and there was no significant difference between the ROC curves of the model and of the score (DeLong test: P = 0.872).
ENDORECT score and prediction rules:
| Variables | Points | Predicted risk of RE, % [95%CI] |
|---|---|---|
| Palpation of a posterior nodule on digital examination | 8 | |
| Ultrasonographic UBESS stage = 3 | 7 | |
| Rectosigmoid infiltration on MRI | 9 | |
| Blood in stools (during or outside of menstruation) | 7 | |
| Total ENDORECT score | /23 | |
| Score > 17: high-risk group | 100 (72–100) | |
| Score = 7–17: intermediate group | 42 (30–57) | |
| Score = 0: low-risk group | 5 (1–22) | |
MRI: Magnetic Resonance Imaging—n: patients RE+ - UBESS: Ultrasound Based Staging System—[95%CI]: 95% confidence interval.

Calculated risk of RE according to each value of the ENDORECT score.
The high-risk group was identified by a cut-off value of 17 with an Sp of 100% and Lr+ > 10. Patients with an RE predictive score > 17 points had a probability of RE of 100%. The low-risk group comprised patients with a score of 0, giving a probability of RE of 5% (Se = 97% and Lr- = 0.07).
Validation cohort
Distribution of predictive variables were not significantly different between the validation and derivation samples (P < 0.05). The ROC-AUC of predictive variables associated with RE and diagnostic ORs with their 95% CIs are shown in Table V. The diagnostic performances of the two RE prediction rules are shown in Table VI. The Se, Sp, Lr+ and Lr- in the validation sample were in the expected range and the observed frequency of RE in the high-risk group was 83% (44–97). For the low-risk group, the observed frequency of RE was 0%.
Performances of the two cut-off values in the derivation and validation samples.
| Sample | Risk group | Se | Sp | Lr + | Lr - | n/N | Predicted risk of RE, % [95%CI] |
|---|---|---|---|---|---|---|---|
| D | high | 32 | 100 | >10 | 0.7 | 10/10 | 100 (72–100) |
| intermediate | 20/47 | 42 (30–57) | |||||
| low | 97 | 44 | 1.7 | 0.07 | 1/22 | 5 (1–22) | |
| V | high | 38 | 96 | 9.2 | 0.6 | 5/6 | 83 (44–97) |
| intermediate | 8/18 | 44 (25–66) | |||||
| low | 100 | 21 | 1.3 | 0 | 0/5 | 0 (0–43) |
D: Derivation sample - Lr: Positive or negative likelihood ratio – MRI: Magnetic Resonance Imaging – n: patients RE+ - N: patient in each group - RE: Rectal Endometriosis - Se: Sensitivity – Sp: Specificity - UBESS: Ultrasound Based Staging System – V: Validation sample [95%CI]: 95% confidence interval
Selected predictive variables in the validation sample.
| Variable | n/Na | OR [95%CI] | p-value in comparison with derivation sample b | AUC |
|---|---|---|---|---|
| Lesion of vaginal endometriosis on speculum examination | 6/40 | 10.45 [1.1–100.6] | 0.895 | 0.67 |
| Palpation of a posterior nodule on digital examination | 24/40 | 5.12 [1.2–22.7] | 0.246 | 0.64 |
| Posterior DIE on TVUS | 16/40 | 8.36 [2–35.5] | 0.368 | 0.74 |
| Visualization of a posterior nodule on TVUS | 8/39 | 17.1 [1.8–159.8] | 0.342 | 0.70 |
| Posterior nodule > 5 mm on TVUS | 7/38 | 14.7 [1.5–139.8] | 0.874 | 0.70 |
| Rectosigmoid infiltration on TVUS | 7/40 | 13.8 [1.5–130.1] | 0.952 | 0.67 |
| TVUS UBESS stage = 3 | 15/40 | 6.33 [1.5–26] | 0.757 | 0.71 |
| Posterior DIE on MRI | 31/40 | 2.88 [0.5–16.2] | 0.851 | 0.71 |
| Visualization of a posterior nodule on MRI | 18/37 | 3.5 [0.88–13.9] | 0.263 | 0.65 |
| Rectosigmoid infiltration on MRI | 12/40 | 3 [0.73–11.9] | 0.954 | 0.61 |
| Defecation pain (during or outside of menstruation) | 29/39 | 0.62 [0.1–2.6] | 0.769 | 0.45 |
| Abdominal bloating during menstruation | 26/33 | 0.4 [0.1–2.2] | 0.823 | 0.42 |
| Blood in stools (during or outside menstruation) | 10/37 | 1.33 [0.2–7.4] | 0.457 | 0.53 |
abecause of missing data, total may differ from 79 – b: p-value of the chi-2 test for the distribution of the variables in the validation versus derivation samples – AUC: Area Under the ROC curve – MRI: Magnetic Resonance Imaging – n: patients with criterion – N: Total of patient– OR: Diagnostic Odds ratio – p: p-value – TVUS: Transvaginal ultrasonography - 95%CI: 95% Confidence Interval.
Discussion
We developed a preoperative predictive score of RE, the ENDORECT score, based on four simple preoperative YES or NO items: palpation of a posterior nodule on digital examination, a UBESS score of 3 on TVUS, rectosigmoid infiltration on MRI, and the presence of blood in the stools during menstruation. Our predictive model identified three RE risk groups (high, intermediate and low) with good accuracy.
The strengths of our study are the following. First, although the study was retrospective as the data were not initially gathered for this study, the database was prospectively constituted from all women consulting for endometriosis (apart from the imaging data). This ensured that all women operated on for endometriosis since 2011 by our team were included. Almost all the patients underwent a complete and systematic assessment of their disease, including TVUS and MRI. Second, we selected a population of patients with histologically-proven endometriosis who had undergone complete surgical exploration of endometriosis, including surgical and histological verification of RE involvement. Third, we took into account overfitting, the most important bias in predictive studies (Altman and Royston, 2000), by using two statistical methods to minimize this risk: the bootstrap resampling procedure, which allowed us to detect and remove variables potentially responsible for instability in the model (Efron and Gong, 1983), and the validation procedure in a specific population (Steyerberg, 2009). While data splitting based on 2/1 randomization is historically the most popular internal validation method, it is no longer recommended because it produces unstable models especially when the number of events is low (below 100 in practice for the validation sample) (references?). These authors infer that the bootstrap and cross validation procedures give better results. Nevertheless, these methods do not allow validation of the identified cut-off thresholds to transform a logistic model into a clinical decision rule. This is why we chose to use data splitting. The model was validated in the whole sample with the same procedure, which confirmed that our method did not induce a detrimental loss of power.
However, our study has several limitations. First, it was a single-centre study and the score thus requires external validation (Steyerberg, 2009). Moreover, we only included patients who underwent complete surgery, which implies that those with a suspicion of RE but who were medically treated or who underwent incomplete surgical exploration were not included. These patients may differ from those who underwent complete surgery, in particular in terms of symptoms: it can be assumed that women who undergo complete surgery have more severe disease than those who do not. Furthermore, we excluded patients who did not have complete imaging exploration. All in all, we can surmise that the patients included in our analysis presented more severe disease, as attested by the 40% rate of RE, than the women constituting our recruitment population. This could have increased the link between the variables studied and RE and may affect the diagnostic accuracy of our model (Miller et al., 2002).
Two criteria of our score are derived from TVUS and MRI which are both highly recommended in the diagnostic work-up of endometriosis (Dunselman et al., 2014). The UBESS score is a well-defined, reproducible ultrasound score that has shown excellent correlation with the complexity of laparoscopic surgery for endometriosis according to the Royal College of Obstetricians and Gynaecologists classification (RCOG 2001, n.d.), particularly for UBESS three stages that were correlated with Level three surgery with a kappa coefficient of 0.95 (Menakaya et al., 2016). However, the diagnostic performance of imaging in our study is poorer than that found in the literature: the sensitivity for RE was only 30.0 for TVUS and 50.8 for MRI in our study compared to 90.0 and 92.0 for TVUS and MRI, respectively, reported in a recent meta-analysis (Nisenblat et al., 2016). This could be explained by the fact that half of the patients in our study underwent imaging examinations in a different centre and not by an expert radiologist in endometriosis (Rosefort et al., 2018).
Surprisingly, despite using a specifically dedicated questionnaire including the most common digestive symptoms (Fauconnier et al., 2013), the only digestive symptom we found to be related to RE involvement was rectal bleeding. This result is consistent with that of Roman et al. who studied the different digestive symptoms of women according to the localization of endometriosis (Roman et al., 2012) and did not find a statistical relationship between digestive symptoms and rectal involvement. This can be explained by the very high frequency of digestive signs in women with DIE, even without rectal involvement, and suggests that these symptoms are secondary to pelvic inflammation rather than mechanical damage caused by the intrarectal nodule which presents with stenosis in only 12% of cases (Mabrouk et al., 2012). Rectal bleeding is a classically sought-after sign but very rarely found, which makes it a debatable criterion; especially since it may be related to other pathologies such as haemorrhoids.
In daily clinical practice, our predictive score could be useful to plan the surgical management of patients with endometriosis. Patients belonging to the low-risk RE group would be eligible for resection surgery without any complementary assessment and with a low risk of incomplete resection due to unexpected findings of RE involvement. Conversely, those belonging to the high-risk group should undergo second-line complementary examinations (ERUS, CT enteroclysis) and be managed by a multidisciplinary team. Finally, those belonging to the intermediate group (with a 38% probability of RE) could benefit from having their imaging results re-examined by a radiologist with expertise in endometriosis as well as being seen by a specialized surgeon. Women in this latter group should be informed of the possibility of a two-stage surgery in case of intraoperative discovery of RE.
When performed by an expert physician, TVUS alone is considered sufficient to determine the need for digestive surgery (Dunselman et al., 2014). MRI may also be of great value for diagnosing the extent of DIE, including RE, before surgery (Bazot et al., 2007; Saba et al., 2012). It has therefore been recommended to use only one of these examinations, depending on the expertise and organization of the centre (Collinet et al., 2018). However, in a prospective single-centre study of 59 patients meeting the STARD criteria (Bossuyt et al., 2015), sensitivity increased from 73% (for MRI or TVUS alone) to 95% by combining the two techniques (TVUS and MRI) suggesting that they are complementary (Saba et al., 2012).
The strength of the ENDRECT score is that it combines the diagnostic performance of the two recommended imaging examinations, with simple criteria that do not require a high level of radiology expertise. Our study also confirms that both MRI and TVUS provide independent data for the surgical strategy.
Authors’ roles
C.C, A.F and C.H conceived and designed the study and approved the final version of the manuscript. C.C and C.H analysed the data. C.C and A.F interpreted the data and wrote the manuscript. C.C, J.D.C and A.P contributed to data collection. A.F and E.C performed surgical procedures.
Funding
No grant supported the study.
Conflict of interest
None declared.
