


Abstract
What is the cumulative live birth rate following a ‘freeze-all’ strategy compared with a ‘fresh-transfer’ strategy?
The ‘freeze-all’ strategy resulted in a similar cumulative live birth rate as the ‘fresh-transfer’ strategy among high responders (>15 oocytes retrieved) but did not benefit normal (10–15 oocytes) and suboptimal responders (<10 oocytes).
Frozen-thawed embryo transfer is associated with a decreased risk of adverse obstetric and perinatal outcomes compared with fresh embryo transfer. It is unclear whether the ‘freeze-all’ strategy should be offered to all women undergoing ART treatment.
A population-based retrospective cohort study using data collected by the Victorian Assisted Reproductive Treatment Authority. This study included 14 331 women undergoing their first stimulated ART cycle with at least one oocyte fertilised between 1 July 2009 and 30 June 2014 in Victoria, Australia. Demographic characteristics, type of ART procedures and resulting pregnancy and birth outcomes were recorded for the stimulated cycle and associated thaw cycles until 30 June 2016, or until a live birth was achieved, or until all embryos from the stimulated cycle had been used.
Women were grouped by whether they had undergone the ‘freeze-all’ strategy (n = 1028) where all embryos were cryopreserved for future transfer, or the ‘fresh-transfer’ strategy (n = 13 303) where selected embryo(s) were transferred in the stimulated cycle, and remaining embryo(s) were cryopreserved for future use. A discrete-time survival model was used to evaluate the cumulative live birth rate following ‘freeze-all’ and ‘fresh-transfer’ strategy.
A total of 1028 women undergoing ‘freeze-all’ strategy and 13 303 women undergoing ‘fresh-transfer’ strategy had 1788 and 22 334 embryo transfer cycles resulting in 452 and 5126 live births, respectively. Most women (61.3%) in the ‘freeze-all’ group had more than 15 oocytes retrieved in the stimulated cycle compared with 18.1% of women in the ‘fresh-transfer’ group (P < 0.001). For high responders (>15 oocytes), the cumulative live birth rate in the ‘freeze-all’ group was similar to the ‘fresh-transfer’ group (56.8% vs. 56.2%, adjusted hazard ratio (AHR) 0.90, 95% CI 0.77–1.04). However, the likelihood of a live birth was lower in the ‘freeze-all’ group compared with the ‘fresh-transfer’ group among normal responders (10–15 oocytes) (33.2% vs. 46.3%, AHR 0.62, 95% CI 0.46–0.83) and suboptimal responders (<10 oocytes) (14.6% vs. 28.0%, AHR 0.67, 95% CI 0.14–1.01). During the minimum follow-up time of 2 years, 34.1%, 24.4% and 8.4% of suboptimal, normal and high responders, respectively, in the ‘freeze-all’ group did not return for any embryo transfer after the stimulated cycle, whereas all women in the ‘fresh-transfer’ group had at least one embryo transferred in the stimulated cycle.
A limitation of this population-based study is the lack of information available on clinic-specific protocols for the ‘freeze-all’ strategy and the potential impact of these on outcomes. Data were not available on whether the ‘freeze-all’ strategy was used to prevent ovarian hyperstimulation syndrome (OHSS).
This study presents population-based evidence on clinical efficacy associated with a ‘freeze-all’ and ‘fresh-transfer’ strategy. The ‘freeze-all’ strategy may benefit some subgroups of patients, including women who are high responders and those who are at risk of OHSS, but should not be offered universally. Clinicians should consider the potential impact of electively deferring embryo transfer on treatment discontinuation in choosing the optimal embryo transfer strategy for couples undergoing ART treatment.
No specific funding was received to undertake this study. There is no conflict of interest, except that M.B. is a shareholder in Genea Ltd.
Introduction
The ‘fresh-transfer’ strategy where the selected embryo(s) are transferred in the stimulated cycle (fresh embryo transfer), and any remaining embryos are cryopreserved for future use, is currently the most common strategy in ART practice. However, in recent years the ‘freeze-all’ strategy where all embryos are cryopreserved for future transfer in subsequent cycles (frozen-thawed embryo transfer) is increasingly being favoured (Blockeel et al., 2016; Coutifaris, 2017). In the USA, the proportion of cycles with embryo cryopreservation without fresh-transfer has increased from 7.9% in 2004 to 40.7% in 2013 (Christianson et al., 2017). In Australia, the proportion of ‘freeze-all’ cycles increased from 4.1% of initiated fresh cycles in 2010 to 18.1% in 2015 (Harris et al., 2016; Fitzgerald et al., 2017). The most common reasons for freezing all embryos are to avoid ovarian hyperstimulation syndrome (OHSS), the use of PGD or PGS, and to allow the embryos to be transferred in an unstimulated cycle when the intrauterine environment is presumed to be more favourable (Devroey et al., 2011; Evans et al., 2014; Roque, 2015; Roque et al., 2017b).
A ‘fresh-transfer’ strategy means that one or two embryos are transferred at the end of the stimulated cycle and any additional embryos are frozen for later use. A ‘freeze-all’ strategy means that all embryos available after a stimulated cycle are frozen and transferred in unstimulated cycles when it is thought that the environment in the uterus is more favourable. The ‘freeze-all’ strategy is increasingly being offered to couples going through assisted reproductive technology treatment. This study looks at whether the ‘freeze-all’ strategy makes a difference to the chances of a live birth compared with the ‘fresh-transfer’ strategy.
In this study, we analysed data from women who had their first stimulated cycle between 1 July 2009 and 30 June 2014 in Victoria, Australia and recorded all births for cycles they had up until 30 June 2016. Women were classified into three groups: high responders who had more than 15 eggs retrieved, normal responders with 10–15 eggs and suboptimal responders with less than 10 eggs. The chance of a live birth was similar for the ‘fresh-transfer’ and the ‘freeze-all’ strategy in high responders. However, the ‘freeze-all’ strategy resulted in a lower chance of a live birth than the ‘fresh-transfer’ strategy in normal and suboptimal responders.
Based on our findings, we conclude that the ‘freeze-all’ strategy may be beneficial in high responders but should not be offered to women who have fewer than 15 eggs retrieved in the stimulated cycle.
Cycle-based studies have found that frozen-thawed embryo transfer is associated with decreased risk of adverse obstetric and perinatal outcomes compared with fresh embryo transfer. Several large retrospective cohort studies and systematic reviews have shown a significantly reduced risk of ectopic pregnancy, preterm birth, low birthweight and small for gestational age in frozen-thawed embryo transfer compared with fresh embryo transfer (Sazonova et al., 2012; Ishihara et al., 2014; Li et al., 2014a, 2015; Zhao et al., 2016; Maheshwari et al., 2018).
Despite the apparent obstetric and perinatal benefits of frozen-thawed embryo transfer, it is not known if adopting the ‘freeze-all’ strategy for all couples undergoing ART treatment outweigh the downsides of this strategy (Coutifaris, 2016, 2017; Isikoglu, 2016; Ata and Seli, 2017). They include the potential degeneration or loss of embryos during the freezing and thawing processes, the added financial costs, the emotional costs of deferring transfer, and the increased risks of having a large for gestational age baby and maternal hypertensive disorders (Li et al. 2014b; Pinborg et al., 2014; Coutifaris, 2016; Isikoglu, 2016; Maheshwari et al., 2018). Most importantly, there is lack of consensus about whether a ‘freeze-all’ strategy can improve the clinical efficacy in terms of live birth rate (Blockeel et al., 2016; Ata and Seli, 2017; Roque et al., 2017b, 2018a; Zhu et al., 2018).
To date, there have been only a limited number of ‘freeze-all’ versus ‘fresh-transfer’ randomised controlled studies (RCTs) and they have been restricted mostly to high responders (Wong et al., 2017). A recent systematic review and meta-analysis based on five RCTs reported that the ‘freeze-all’ strategy could be favourable when high numbers of oocytes are retrieved in the stimulated cycle but did not appear to be advantageous when the mean number of oocytes retrieved was <15 (Dieamant et al., 2017). There are few existing studies on the clinical efficacy of a ‘freeze-all’ strategy among suboptimal (<10 oocytes) and normal responders (10–15 oocytes). In Australia and New Zealand, most (60.0%) women undergoing oocyte retrieval in 2015 had <10 oocytes retrieved and only one in six (16.4%) had 15 or more oocytes retrieved (Fitzgerald et al., 2017). It is therefore critical to examine the clinical efficacy of a ‘freeze-all’ strategy in women who have fewer than 15 oocytes retrieved. Moreover, there are currently no patient-based data on the cumulative live birth rate from the ‘freeze-all’ strategy compared with the ‘fresh-transfer’ strategy to inform couples who have embryos available for transfer after a stimulated cycle. The aim of this population-based study was to investigate the cumulative live birth rate following a ‘freeze-all’ compared with a ‘fresh-transfer’ strategy by the number of oocytes retrieved in the stimulated cycle.
Materials and Methods
Study design
A retrospective population-based cohort study of women who had their first ever stimulated cycle with at least one oocyte fertilised between 1 July 2009 and 30 June 2014 in the state of Victoria, Australia was conducted using data collected by the Victorian Assisted Reproductive Treatment Authority (VARTA). VARTA is a statutory authority which records details of initiated ART treatments undertaken in all fertility clinics in Victoria, including demographic characteristics, type of ART treatment and resulting pregnancy and birth outcomes (VARTA, 2015). Approximately 30% of all ART treatment cycles undertaken in Australia are performed in Victoria (Harris et al., 2016).
Study population and follow-up
Between July 2009 and June 2014, 15 403 women had their first ever stimulated cycle with at least one oocyte fertilised. Women who had PGD (3.3%), mixed fresh-frozen cycles where embryos from a subsequent stimulated cycles were added to the frozen embryo from the first stimulated cycle (1.2%) and women had no embryo transferred or cryopreserved (2.5%) were excluded (Fig. 1). A total of 1028 women undergoing ‘freeze-all’ strategy and 13 303 women undergoing ‘fresh-transfer’ strategy who had 2868 and 22 832 initiated cycles, respectively (a stimulated cycle with embryos transferred or cryopreserved for future transfer, or a thaw cycle where frozen embryos were thawed with the intention to transfer), were included in the data analysis.
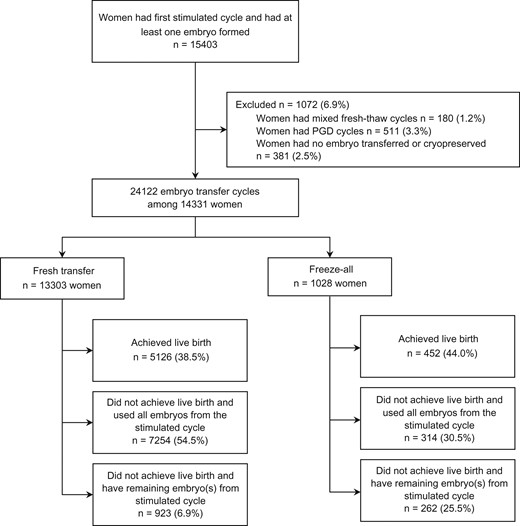
Diagram of inclusion and exclusion of the study population.
Data were collated on treatment and clinical outcomes following the first oocyte retrieval (stimulated cycle and associated thaw cycles). The women were followed-up until 30 June 2016, or until a live birth was achieved, or all embryos from the first oocyte retrieval had been used. Cycles up to and including the first live birth were included, and cycles after the first live birth were excluded.
Study variables and outcome measures
Women were grouped by whether they had undergone the ‘freeze-all’ strategy where no fresh embryo(s) were transferred in the stimulated cycle and all resulting embryos were cryopreserved for transfer in subsequent cycles, or the ‘fresh-transfer’ strategy where the selected embryo(s) were transferred in the stimulated cycle, and remaining embryos were cryopreserved for future use. The woman’s and partner’s age were recorded in completed years of age at the first stimulated cycle. Women were classified as high responders (>15 oocytes), normal responders (10–15 oocytes) and suboptimal responders (<10 oocytes) based on the number of oocytes retrieved in the stimulated cycle (Drakopoulos et al., 2016; Roque et al., 2017a).
The primary outcome was the cumulative live birth rate, defined as live deliveries (at least one live birth) per woman following the ‘freeze-all’ or ‘fresh-transfer’ strategy. A live birth was defined as a baby showing signs of life with gestational age ≥20 weeks or birthweight ≥400 g. The observed cumulative live birth rate was reported using the conservative assumption that women who did not return for treatment did not have a pregnancy resulting in a live birth. The optimal cumulative live birth rate was based on the assumption that eligible women who did not return for treatment would have had the same live birth rate as those who did return.
Statistical analysis
Chi-square test or Fisher’s exact test for categorical variables and Mann–Whitney U-test for continuous variables were used to examine differences between the ‘freeze-all’ and ‘fresh-transfer’ groups regarding demographic, clinical and treatment characteristics, respectively. A discrete-time survival model was used to evaluate the number of cycles to live birth following ‘freeze-all’ and ‘fresh-transfer’ strategy (Mills, 2010). The adjusted hazard ratio (AHR) and 95% CI were calculated by the number of oocytes retrieved in the stimulated cycle. Adjustment was made for year of the first stimulated cycle, the woman’s and the male partner’s age at first stimulated cycle, parity (nullipara/multipara), cause of infertility (male only/female only/combined male-female/unexplained), OHSS (yes/no), method of fertilisation (IVF/ICSI/mixed IVF-ICSI), stage of transferred embryos (cleavage stage embryo/blastocyst) and the number of embryos transferred. A P-value <0.05 or a CI not including 1 were considered statistically significant. All statistical analysis was performed using SPSS 24.0 software (Armonk, NY, USA: IBM Corp.) and R version 3.4.1 (R Core Team, 2013).
Ethics
Ethics approval for this study was granted by the Human Research Ethics Committee of the University of Technology Sydney, Australia (Reference NO. 2015000341). Informed consent from participants was not required. Access to the VARTA data was granted by VARTA.
Results
The study population included 1028 women undergoing ‘freeze-all’ strategy and 13 303 women undergoing ‘fresh-transfer’ strategy who had 1788 and 22 334 embryo transfer cycles resulting in 452 and 5126 live births, respectively. In the study period, the proportion of women undergoing the ‘freeze-all’ strategy increased from 4.1% in 2009 to 12.2% in 2014, while the proportion of women who developed OHSS remained relatively stable (1.3% in 2009 and 1.6% in 2014).
Table I presents the demographic and clinical characteristics of the study population by number of oocytes retrieved in the stimulated cycle. Among women with <10 oocytes, the proportions having OHSS were similar in the ‘freeze-all’ and ‘fresh-transfer’ groups (0.5% vs. 0.1%, P = 0.273). However, among those with 10–15 oocytes and >15 oocytes, the proportion with OHSS was higher in the ‘freeze-all’ than in the ‘fresh-transfer’ group (5.7% vs. 0.6%, P < 0.001; 13.2% vs. 3.0%, P < 0.001; respectively) (Table I).
Demographic and clinical characteristics of study population, by type of treatment and number of oocytes retrieved in the stimulated cycle.
| <10 oocytes retrieved | 10–15 oocytes retrieved | >15 oocytes retrieved | |||||||
|---|---|---|---|---|---|---|---|---|---|
| Fresh-transfer | Freeze-all | P-valuea | Fresh-transfer | Freeze-all | P-valuea | Fresh-transfer | Freeze-all | P-valuea | |
| N(%) | N(%) | N(%) | N(%) | N(%) | N(%) | ||||
| Women | 6970 (100.0) | 205 (100.0) | 3923 (100.0) | 193 (100.0) | 2410 (100.0) | 630 (100.0) | |||
| Women’s age (years) | |||||||||
| <30 | 677 (9.7) | 30 (14.6) | 0.033 | 649 (9.3) | 46 (22.4) | 0.114 | 506 (7.3) | 155 (24.6) | 0.063 |
| 30–34 | 1963 (28.2) | 48 (23.4) | 1472 (21.1) | 69 (33.7) | 972 (13.9) | 258 (41.0) | |||
| 35–39 | 2563 (36.8) | 77 (37.6) | 1331 (19.1) | 57 (27.8) | 722 (10.4) | 180 (28.6) | |||
| 40–44 | 1672 (24.0) | 44 (21.5) | 465 (6.7) | 21 (10.2) | 208 (3.0) | 36 (5.7) | |||
| 45+ | 95 (1.4) | 6 (2.9) | 6 (0.1) | 0 (0.0) | 2 (0.0) | 1 (0.2) | |||
| Male partner’s age (years) | |||||||||
| <30 | 403 (5.8) | 18 (8.8) | 0.239 | 321 (4.6) | 28 (13.7) | 0.011 | 260 (3.7) | 79 (12.5) | 0.299 |
| 30–34 | 1669 (23.9) | 57 (27.8) | 1194 (17.1) | 65 (31.7) | 804 (11.5) | 223 (35.4) | |||
| 35–39 | 2082 (29.9) | 62 (30.2) | 1193 (17.1) | 45 (22.0) | 700 (10.0) | 161 (25.6) | |||
| 40–44 | 1401 (20.1) | 36 (17.6) | 606 (8.7) | 25 (12.2) | 360 (5.2) | 103 (16.3) | |||
| 45+ | 873 (12.5) | 21 (10.2) | 357 (5.1) | 18 (8.8) | 158 (2.3) | 38 (6.0) | |||
| Not stated | 542 (7.8) | 11 (5.4) | 252 (3.6) | 12 (5.9) | 128 (1.8) | 26 (4.1) | |||
| Nulliparous | 6211 (89.1) | 188 (91.7) | 0.238 | 3552 (90.5) | 174 (90.2) | 0.858 | 2154 (89.4) | 589 (93.5) | 0.002 |
| Reason for infertility | |||||||||
| Male factors | 1160 (16.6) | 24 (11.7) | 0.908 | 729 (18.6) | 41 (21.2) | 0.135 | 438 (18.2) | 85 (13.5) | 0.001 |
| Female factors | 945 (13.6) | 21 (10.2) | 551 (14.0) | 31 (16.1) | 318 (13.2) | 75 (11.9) | |||
| Combined male/female factors | 685 (9.8) | 16 (7.8) | 373 (9.5) | 25 (13.0) | 247 (10.2) | 75 (11.9) | |||
| Unexplained | 981 (14.1) | 25 (12.2) | 545 (13.9) | 18 (9.3) | 378 (15.7) | 55 (8.7) | |||
| Not stated | 3199 (45.9) | 119 (58.0) | 1725 (44.0) | 78 (40.4) | 1029 (42.7) | 340 (54.0) | |||
| OHSS | 10 (0.1) | 1 (0.5) | 0.273 | 25 (0.6) | 11 (5.7) | <0.001 | 73 (3.0) | 83 (13.2) | <0.001 |
OHSS, ovarian hyperstimulation syndrome.
aChi-square test or Fisher’s exact test as appropriate.
The majority (61.3%) of women in the ‘freeze-all’ group were classified as high responders with more than 15 oocytes retrieved in the stimulated cycle, while more than half (52.4%) of the women in the ‘fresh-transfer’ group were classified as suboptimal responders with <10 oocytes retrieved (P < 0.001). A higher proportion of blastocysts were transferred among suboptimal (<10 oocytes) and normal (10–15 oocytes) responders in the ‘freeze-all’ group compared with the ‘fresh-transfer’ group (31.7% vs. 24.2%, P = 0.014; 57.4% vs. 44.0%, P < 0.001; respectively) (Table II).
Treatment characteristics, by type of treatment and number of oocytes retrieved in the stimulated cycle.
| <10 oocytes retrieved | 10–15 oocytes retrieved | >15 oocytes retrieved | |||||||
|---|---|---|---|---|---|---|---|---|---|
| Fresh-transfer | Freeze-all | P-valuea | Fresh-transfer | Freeze-all | P-valuea | Fresh-transfer | Freeze-all | P-valuea | |
| Oocyte retrieval and fertilisation | |||||||||
| No. of oocytes retrieved, median (IQR) | 6 (4–8) | 5 (4–8) | 0.972 | 12 (11–14) | 12 (11–14) | 0.553 | 19 (17–22) | 25 (20–31) | <0.001 |
| Method of fertilisation, n (%) | |||||||||
| IVF | 2320 (33.3) | 45 (22.0) | 0.002 | 1270 (32.4) | 42 (21.8) | 0.001 | 774 (32.1) | 195 (31.0) | 0.757 |
| ICSI | 4480 (64.3) | 156 (76.1) | 2445 (62.3) | 133 (68.9) | 1500 (62.2) | 402 (63.8) | |||
| Mixed | 170 (2.4) | 4 (2.0) | 208 (5.3) | 18 (9.3) | 136 (5.6) | 33 (5.2) | |||
| No. of oocytes fertilised, median (IQR) | 3 (2–5) | 3 (2–5) | 0.457 | 7 (5–9) | 7 (5–9) | 0.324 | 12 (9–14) | 15 (12–20) | <0.001 |
| No. of embryo cryopreserved, median (IQR) | 1 (0–2) | 2 (1–3) | <0.001 | 2 (1–4) | 4 (2–5) | <0.001 | 4 (2–7) | 8 (5–12) | <0.001 |
| Method of cryopreservationb, n (%) | |||||||||
| Slow freezing | 2180 (59.7) | 126 (61.5) | 0.609 | 1623 (52.8) | 79 (40.9) | 0.001 | 979 (46.2) | 318 (50.5) | 0.057 |
| Vitrification | 1474 (40.3) | 79 (38.5) | 1449 (47.2) | 114 (59.1) | 1142 (53.8) | 312 (49.5) | |||
| Embryo transfer | |||||||||
| Initiated cycles, n | 10423 | 421 | 7388 | 505 | 5021 | 1942 | |||
| Embryo transfer cycles, n | 10154 | 202 | 7246 | 305 | 4934 | 1281 | |||
| No. of embryos transferred per cycle, n (%) | |||||||||
| 1 | 8856 (87.2) | 187 (92.6) | 0.023 | 6259 (86.4) | 275 (90.2) | 0.058 | 4218 (85.5) | 1060 (82.7) | 0.015 |
| ≥2 | 1298 (12.8) | 15 (7.4) | 987 (13.6) | 30 (9.8) | 716 (14.5) | 221 (17.3) | |||
| Stage of transferred embryo, n (%) | |||||||||
| Cleavage stage embryo | 7698 (75.8) | 138 (68.3) | 0.014 | 4056 (56.0) | 130 (42.6) | <0.001 | 2215 (44.9) | 539 (42.1) | 0.071 |
| Blastocyst | 2456 (24.2) | 64 (31.7) | 3190 (44.0) | 175 (57.4) | 2719 (55.1) | 742 (57.9) | |||
IQR, interquartile range.
aChi-square test for categorical variables and Mann–Whitney U-test for continuous variables.
bInclude only women with at least one embryo cryopreserved.
The cumulative live birth rates by number of oocytes retrieved in the stimulated cycle are shown in Table III and Fig. 2. The ‘freeze-all’ group had a similar observed cumulative live birth rate compared with the ‘fresh-transfer’ group among high responders (56.8% vs. 56.2%) but a lower cumulative live birth rate among normal (33.2% vs. 46.3%) and suboptimal responders (14.6% vs. 28.0%). Among suboptimal and normal responders, the adjusted overall likelihood of a live birth was significantly lower for women undergoing the ‘freeze-all’ strategy than for those undergoing the ‘fresh-transfer’ strategy (AHR 0.67, 95% CI 0.45–1.01 and AHR 0.62, 95% CI 0.46–0.83, respectively). Among high responders the adjusted likelihood of a live birth in the ‘freeze-all’ group was not significantly different to women in the ‘fresh-transfer’ group (AHR 0.90, 95% CI 0.77–1.04).
Cumulative live delivery rate by number of oocytes retrieved in stimulated cycle and type of treatment.
| No. of oocytes retrieved in the stimulated cycle | Fresh-transfer | Freeze-all | Crude HRa (95% CI) | AHRa (95% CI) | ||||
|---|---|---|---|---|---|---|---|---|
| No. of women | No. of live births | Cumulative LBR (%) | No. of women | No. of live births | Cumulative LBR (%) | |||
| <10b | 6970 | 1955 | 28.0 | 205 | 30 | 14.6 | 0.61 (0.42, 0.88) | 0.67 (0.45, 1.01) |
| 10–15b | 3923 | 1816 | 46.3 | 193 | 64 | 33.2 | 0.76 (0.58, 0.99) | 0.62 (0.46, 0.83) |
| >15b | 2410 | 1355 | 56.2 | 630 | 358 | 56.8 | 1.01 (0.89, 1.15) | 0.90 (0.77, 1.04) |
| Totalc | 13303 | 5126 | 38.5 | 1028 | 452 | 44.0 | 1.13 (1.02, 1.26) | 0.76 (0.67, 0.86) |
LBR, live birth rate; HR, hazard ratio; AHR, adjusted hazard ratio.
aReference group: ‘Fresh-transfer’ group.
bAdjusted for year of treatment at first stimulated cycle, woman’s and the male partner’s age at first stimulated cycle, parity, cause of infertility, OHSS, method of fertilisation, number of embryo transferred, and stage of embryo transferred.
cAdjusted for year of treatment at first stimulated cycle, woman’s and the male partner’s age at first stimulated cycle, parity, the number of oocytes retrieved in first stimulated cycle, cause of infertility, OHSS, method of fertilisation, number of embryo transferred, and stage of embryo transferred.
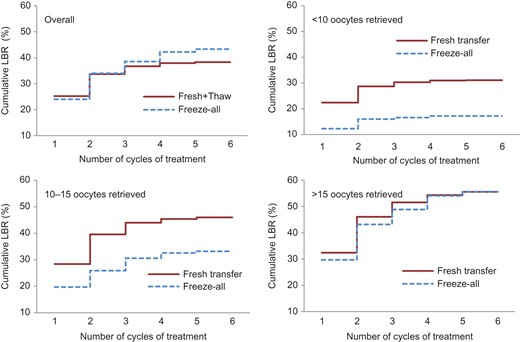
Observed cumulative live birth rate by type of treatment and number of oocytes retrieved in stimulated cycle. LBR, live birth rate.
The cycle-specific live birth rates by the number of oocytes retrieved in the stimulated cycle are reported in Supplementary Tables SI–SIV. Approximately 1 in 12 (8.4%) high responders with at least one cryopreserved embryo in the ‘freeze-all’ group did not return for any embryo transfer during the minimum follow-up time of 2 years. This proportion increased to 24.4% among normal responders and 34.1% among suboptimal responders, whereas all women in the ‘fresh-transfer’ group had at least one embryo transferred in the stimulated cycle.
Discussion
To our knowledge, this is the first population-based cohort study to investigate the cumulative live birth rates following ‘freeze-all’ strategy and ‘fresh-transfer’ strategy. Moreover, this is the first population-based study to evaluate the clinical efficacy of the ‘freeze-all’ strategy based on the number of oocytes retrieved in the stimulated cycle. Our study showed that, compared with a ‘fresh-transfer’ strategy, the ‘freeze-all’ strategy resulted in a similar cumulative live birth rate among high responders but significantly lower cumulative live birth rates among normal and suboptimal responders. This suggests that a universal ‘freeze-all’ strategy is not warranted.
The finding that the ‘freeze-all’ strategy resulted in a similar cumulative live birth rate among high responders compared with the ‘fresh-transfer’ strategy is consistent with previous RCTs. The nine RCTs that have evaluated the live birth rate following a ‘freeze-all’ strategy compared with a ‘fresh-transfer’ strategy were all performed in normal or high responders where the minimum average number of oocytes retrieved was 12 in both groups (Ferraretti et al., 1999; Shapiro et al., 2011a,b; Chen et al., 2016; Aghahosseini et al., 2017; Coates et al., 2017; Aflatoonian et al., 2018; Shi et al., 2018; Vuong et al., 2018). A recent systematic review and meta-analysis based on five of these RCTs reporting cumulative live birth rate (Ferraretti et al., 1999; Shapiro et al., 2011a,b; Chen et al., 2016; Vuong et al., 2018) showed no differences in cumulative live birth rates between the ‘freeze-all’ and ‘fresh-transfer’ strategies (risk ratio 1.04, 95% CI 0.97–1.11) (Roque et al., 2018b).
The results of our study demonstrate that a ‘freeze-all’ strategy is associated with reduced likelihood of a live birth in suboptimal and normal responders compared with a ‘fresh-transfer’ strategy. There are few existing studies on the clinical efficacy of a ‘freeze-all’ strategy among suboptimal and normal responders. The findings from our study are consistent with the recent cycle-based US study of 82 935 cycles from the Society for Assisted Reproductive Technology (SART) registry. Acharya et al. examined the live birth rate following the first embryo transfer cycle and found that it was higher with the ‘freeze-all’ strategy than the ‘fresh-transfer’ strategy in women with 15 or more oocytes retrieved (52.0% vs. 48.9%, respectively) but not in those with 1–5 (11.5% vs. 25.9%) or 6–14 oocytes (35.3% vs. 41.2%) retrieved (Acharya et al., 2018). Neither VARTA nor SART data could differentiate between women who had an elective ‘freeze-all’ strategy and women who had a ‘freeze-all’ strategy due to elevated risk of OHSS or premature rise in progesterone, which is associated with a poorer prognosis. Therefore, the inclusion of women who had a ‘freeze-all’ strategy due to premature rise in progesterone could partially explain the reduced likelihood of a live birth observed among suboptimal and normal responders in our study and the US SART registry study (Acharya et al., 2018). In contrast, a recent meta-analysis (Bosdou et al., 2018) based on two RCTs reported comparable live birth rates (relative risk: 0.99, 95% CI: 0.91–1.07) in the ‘freeze-all’ and ‘fresh-transfer’ strategy in ovulatory women (Shi et al., 2018) and women without polycystic ovary syndrome (PCOS; Vuong et al., 2018). A cohort study of 938 IVF cycles performed in a private IVF centre found that the ‘freeze-all’ group had a higher ongoing pregnancy rate after the first embryo transfer than the ‘fresh-transfer’ group in women with 10–15 oocytes retrieved (47% vs. 34%, P = 0.021) and a similar ongoing pregnancy rate in women with 4–9 oocytes retrieved in the stimulated cycle (33% vs. 31%, P = 0.577) (Roque et al., 2017b). The differences between the findings in Roque et al.’s study and the findings in our study are likely attributable to the different outcome measurements used. While Roque et al. performed cycle-based analysis of women who returned for their first embryo transfer cycle, our study took into account couples who underwent multiple embryo transfer cycles and those who did not return for embryo transfer. In our population-based study, a proportion of women in the ‘freeze-all’ group who did not return for thaw cycles whereas all women in the ‘fresh-transfer’ group had at least one embryo transferred in the stimulated cycle.
The findings from our large population-based cohort study add to the body of evidence about the efficacy of a ‘freeze-all’ versus a ‘fresh-transfer’ strategy. Although several large RCTs of high responders have shown comparable live birth rates following ‘freeze-all’ strategy and ‘fresh-transfer’ strategy, this is the first population-based study to compare the efficacy of the ‘freeze-all’ strategy with the ‘fresh-transfer’ strategy in suboptimal and normal responders. In addition, the primary outcome of our study was cumulative live birth rate, which provides more meaningful information than cycle-based data for couples undergoing multiple cycles following one oocyte retrieval. Three of the five RCTs included in the Roque et al.’s systematic review and meta-analysis reported significantly higher pregnancy or live birth rates per first transfer for women in the ‘freeze-all’ group compared with those in the ‘fresh-transfer’ group (Shapiro et al., 2011a,b; Chen et al., 2016) but no group difference in cumulative live birth rate per women randomised (Roque et al., 2018b). One of the largest RCTs to date had over 1500 women with PCOS randomised and included in the analysis (Chen et al., 2016). In this study Chen and colleagues reported that women in the ‘freeze-all’ group had a significantly higher live birth rate after the first transfer compared with those in the ‘fresh-transfer’ group (49.3% (n = 368 out of 746) vs. 42.0% (n = 320 out of 762), respectively, rate ratio 1.17, 95% CI: 1.05–1.31) (Chen et al., 2016). However, the calculated cumulative live birth rate per women randomised included in the systematic review and meta-analysis showed no differences between the two groups (62.3% (n = 465 out of 746) vs. 59.7% (n = 455 out of 762), rate ratio 1.04, 95% CI: 0.96–1.13) (Roque et al., 2018b).
Last but not least, our population-based study provides real-world evidence on the clinical efficacy of a ‘freeze-all’ strategy. Couples who do not return for treatment would be minimised in a highly controlled RCT and therefore the non-technical factors associated with discontinuing treatment (i.e. emotional stress due to poor prognosis and delay in transfer, increased financial cost, etc.) would have minimal impact on the outcome measurements of the well-designed RCTs. However, these non-technical factors play a critical role in real-world clinical practice and the potential benefits of a ‘freeze-all’ strategy could be offset by these operational challenges (Zuidgeest et al., 2017). The high rates of discontinuing treatment among normal and suboptimal responders (24.4% and 34.1%, respectively) in the ‘freeze-all’ group largely explained why women with lower number of oocytes retrieved in the stimulated cycle did not benefit from the ‘freeze-all’ strategy. A review of 22 studies on reasons why patients discontinue fertility treatment reported that the leading causes for discontinuation were postponement of treatment (39.2%), physical and psychological burden (19.1%), and relational and personal problems (16.7%) (Gameiro et al., 2012). In addition, our study observed a strong negative correlation between the number of oocytes retrieved in the stimulated cycle and the proportion of women in the ‘freeze-all’ group who did not return for embryo transfer, which suggested that poor prognosis may have influenced couples’ decision to not return for treatment. Clinicians should take into consideration the risk of couples discontinuing treatment when electively deferring embryo transfer in the ‘freeze-all’ strategy.
A limitation of our study is the lack of information available on clinic-specific protocols for the ‘freeze-all’ strategy (e.g. intention-to-treat, embryo quality and cryopreservation techniques) and the potential impact of these on the outcomes. Protocols for the ‘freeze-all’ strategy may vary between clinics. In addition, there is no information about whether the ‘freeze-all’ strategy was used to prevent OHSS or whether the embryos were electively cryopreserved for other reasons. Further data from RCTs adjusting for intention-to-treat and clinical-specific protocols are required to evaluate the effectiveness of ‘freeze-all’ compared with ‘fresh-transfer’ strategy. Nevertheless, the OHSS rate in our study population was relatively stable during the study period, which suggests that the increase in the use of the ‘freeze-all’ strategy was for reasons other than preventing OHSS. Furthermore, ~2.5% of the women with at least one oocyte fertilised had no embryo transferred or frozen in the stimulated cycle and were excluded from the analysis. It is not known if the plan was for these women to have the ‘fresh-transfer’ or ‘freeze-all’ strategy, which may over or under-estimate the efficacy of the ‘freeze-all’ strategy. In addition, compared with the women in the ‘fresh-transfer’ group, a significantly higher proportion of the women in the ‘freeze-all’ group had not used all the embryos from the stimulated cycle by the end of the minimum 2-year follow-up period. Maheshwari et al. proposed a three-step approach to report short, medium and long-term cumulative live birth rates, which allowed a 2-year, 5-year and 10 year follow-up period, respectively (Maheshwari et al., 2015). Further studies are required to examine the medium and long-term efficacy of ‘freeze-all’ compared with ‘fresh-transfer’ strategy.
This population-based study found the cumulative live birth rate following the ‘freeze-all’ strategy was similar to the ‘fresh-transfer’ strategy among high responders but was consistently lower than the ‘fresh-transfer’ strategy among suboptimal and normal responders. Clinicians should consider the potential impact of electively deferring embryo transfer on treatment discontinuation when choosing the optimal embryo transfer strategy for couples undergoing ART treatment. The ‘freeze-all’ strategy may benefit some subgroups of patients, including women who are high responders and those who are at risk of OHSS, but should not be offered universally.
Acknowledgements
The authors acknowledge the contribution of Victorian fertility clinics in the provision of data to VARTA.
Authors’ roles
All the authors were involved in the design of the study and interpretation of data. Z.L drafted the manuscript. Z.L and A.Y.W conducted the data analysis. M.B, K.H, C.F, L.J, N.S and E.A.S have revised the manuscript critically for important intellectual content. All authors approved the final version of the article.
Funding
No specific funding was received to undertake this study.
Conflict of interest
There is no conflict of interest, except that M.B. is a shareholder in Genea Ltd, a company that provides assisted conception services.
References
Shapiro BS, Daneshmand ST, Garner FC, Aguirre M, Hudson C, Thomas S.
