


Abstract
Type 2 diabetes mellitus (DM) is an established risk factor for a wide range of vascular diseases, including ischemic stroke (IS). Glycated hemoglobin A1c (HbA1c), a marker for average blood glucose levels over the previous 12 weeks, is used as a measure of glycemic control and also as a diagnostic criterion for diabetes (HbA1c levels ≥ 6.5%). Epigenetic mechanisms, such as DNA methylation, may be associated with aging processes and with modulation of the risk of various pathologies, such as DM. Specifically, DNA methylation could be one of the mechanisms mediating the relation between DM and environmental exposures. Our goal was to identify new CpG methylation sites associated with DM. We performed a genome-wide methylation study in whole-blood DNA from an IS patient cohorts. Illumina HumanMethylation450 BeadChip array was used to measure DNA methylation in CpG sites. All statistical analyses were adjusted for sex, age, hyperlipidemia, body mass index (BMI), smoking habit and cell count. Findings were replicated in two independent cohorts, an IS cohort and a population-based cohort, using the same array. In the discovery phase (N = 355), we identified a CpG site, cg19693031 (located in the TXNIP gene) that was associated with DM (P = 1.17 × 10⁻¹²); this CpG was replicated in two independent cohorts (N = 167 and N = 645). Methylation of TXNIP was inversely and intensely associated with HbA1c levels (P = 7.3 × 10⁻¹⁶), specifically related to diabetic patients with poor control of glucose levels. We identified an association between the TXNIP gene and DM through epigenetic mechanisms, related to sustained hyperglycemia levels (HbA1c ≥ 7%).
Introduction
Type 2 diabetes mellitus (DM) is an established risk factor for a wide range of vascular diseases, including ischemic stroke (IS), independently of other conventional risk factors (1,2). The prevalence of DM in IS ranges from 15 to 44% (3–5).
In patients with DM, glucose accumulation results in enhanced glycation of many proteins. The glycated hemoglobin A1c (HbA1c) is formed when glucose attaches specifically to the NH2-terminal valine of the β-chain of hemoglobin A. Formation of HbA1c is essentially irreversible, and its concentration in the blood depends on both the life span of the red blood cell, which averages ∼120 days, and the blood glucose concentration. HbA1c is firmly established as a biomarker of long-term blood glucose concentrations and represents the average of glucose levels over the preceding 8 to 12 weeks. This biomarker has many favorable attributes, including no requirement that the patient be fasting, the possibility of collecting the sample at any time of the day, and the lack of any association between its concentration in the blood and acute factors such as stress or exercise (6). As our group has previously published, HbA1c determination provides prognostic information in IS patients without known DM (7). Elevated blood glucose is common in the acute phase of stroke, making HbA1c determination useful to diagnose new DM cases (8).
Diabetes is a complex disease, and both genetic and environmental factors contribute to its development. However, despite the depth of available research in the genetic area, all the identified DM risk variants explain only ∼10% of its estimated heritability (9,10). Environmental factors, such as diet and exposure to hyperglycemia, contribute to the etiology of DM and its associated microvascular and macrovascular complications. Thus, researchers have begun to examine the role of epigenetics in DM (11,12). DNA methylation could be one of the epigenetic mechanisms mediating the relation between DM and environmental exposures. There is great interest in methylation profiling in peripheral blood to find disease-related associations, as specific methylation regions could be used as potent biomarkers (13). Indeed, recent studies have proposed that specific changes in the epigenoma are associated with the onset and progression of diabetes and serve as markers of DM risk (14–16).
DNA methylation is an epigenetic mechanism regulating high-order DNA structure and gene expression. It is a heritable but also reversible addition of a methyl group to the 5-carbon position of cytosine in a cytosine-phosphate-guanine (CpG) context. This dinucleotide is quite rare in mammalian genomes (∼1%) and clusters in regions known as CpG islands. The methylation of the CpG island is associated with gene silencing (17).
The aim of the present study was to determine the association between DM and DNA methylation. For this purpose, we screened DNA methylation changes using an epigenome-wide approach in our IS cohort; first, comparing non-DM patients with patients with DM; and second, we classified DM patients in two groups depending on their control of glucose levels: well-controlled DM with HbA1c < 7% (DM-good control) or poorly controlled DM with HbA1c ≥ 7% (DM-poor control). We identified and validated a new methylation CpG site associated with DM and HbA1c levels.
Results
Discovery analysis: genome-wide effect of diabetes on methylation status
A genome-wide DNA methylation analysis from whole blood was done in the discovery cohort (N = 355) with a DM prevalence of 42.5%. Clinical and demographic differences between DM and non-DM patients are shown in Table 1. Of the initial 485 577 CpG sites, 426 036 passed the quality controls and were included in the discovery analyses (Supplementary Material, Table S1).
Descriptive characteristics of IS patients of BASICMAR_1 cohort by diabetic status
| BASICMAR_1 cohort | Non-DM | DM | P-value |
|---|---|---|---|
| N = 355 | N = 204 | N = 151 | |
| Age, yearsa | 75.0 (11.4) | 72.6 (4.5) | 0.04 |
| Sex, female, n (%) | 88 (43.1) | 61 (40.4) | 0.61 |
| Hypertension, n (%) | 141 (69.1) | 111 (73.5) | 0.37 |
| Smoking habit, n (%) | 53 (26.0) | 40 (26.5) | 0.61 |
| BMI (kg/m2)a | 27.1 (4.7) | 28.0 (4.5) | 0.09 |
| Hyperlipidemia, n (%) | 82 (40.2) | 83 (55.0) | 0.006 |
| Blood glucose (mg/dl)a | 114.2 (26.2) | 183.9 (86.4) | <0.001 |
| Hemoglobin A1c %a | 5.4 (0.5) | 7.7 (1.9) | <0.001 |
| DM treatment, n (%) | – | 104 (68.9) | <0.001 |
| Insulin treatment, n (%) | – | 17 (16.3) | <0.001 |
| Oral DM medication, n (%) | – | 73 (70.2) | <0.001 |
| Oral and insulin treatment, n (%) | – | 14 (13.5) | <0.001 |
| Atrial fibrillation, n (%) | 55 (27.0) | 40 (26.5) | 0.92 |
| Ischemic heart disease, n (%) | 22 (10.8) | 27 (17.9) | 0.06 |
| NIHSSb | 5 (2–10) | 5 (3–9) | 0.90 |
| Ischemic stroke etiology, n (%) | 0.57 | ||
| Large-artery atherosclerosis | 63 (31.0) | 54 (36.2) | |
| Small-artery disease | 82 (40.4) | 54 (36.2) | |
| Cardioembolism | 59 (28.6) | 43 (27.5) |
aMean (standard deviation).
bMedian (interquartile range).
There were no differences between the DM and non-DM groups in sex, hypertension, smoking habit, atrial fibrillation, stroke severity (assessed by the National Institutes of Health Stroke Scale, NIHSS) (18) and TOAST classification of IS subtype (19). Differences between patients with and without DM included age (72.6 versus 75.0 years, P = 0.04), past history of ischemic heart disease (17.9 versus 10.8%, P = 0.06), mean body mass index (BMI) [28 kg/m2 (SD = 4.5) versus 27.1 kg/m2 (SD = 4.7), P = 0.09], and hyperlipidemia (55.0% versus 40.2%, P = 0.006), respectively. As expected, HbA1c values differed significantly [means of 7.7 (SD = 1.9) versus 5.4 (SD = 0.5), respectively; P < 0.001]. In the first blood glucose determination during hospitalization, diabetic patients had significantly higher mean values [183.9 mg/dl (SD = 86.4) versus 114.2 mg/dl (SD = 26.2) in patients without DM, P < 0.001]. A total of 104 (68.9%) DM patients were receiving treatment (16.3% insulin, 70.2% oral medication and 13.5% both therapies).
Regression models fitted to test the differences in DNA methylation levels between DM and non-DM patients showed a significant CpG site corresponding to cg19693031 located in TXNIP, which was hypomethylated in the DM group [P = 1.17 × 10⁻¹², with a false discovery rate (FDR) correction adjusted P-value of 5.0 × 10⁻⁷], and a 5% difference in methylation between the two groups (Fig. 1). A Manhattan plot of the distribution of P-values and quantile–quantile plot for expected versus observed χ2 values are shown in Figure 2.
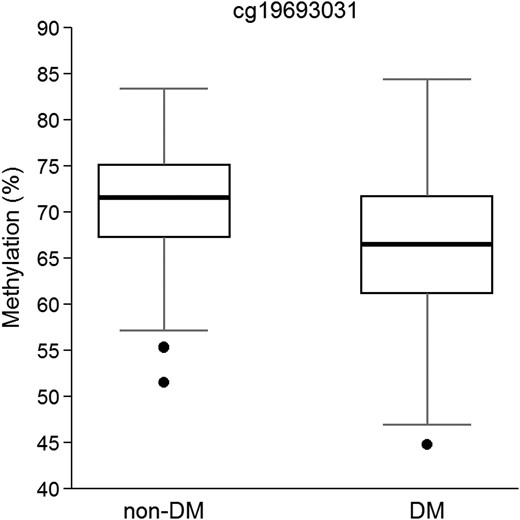
Boxplot of β values of methylation in cg19693031 in TXNIP locus in non-DM and DM patients (N = 355). P-value = 1.17 × 10⁻¹², adjusted for sex, age, hyperlipidemia, BMI, smoking habit and cell count.
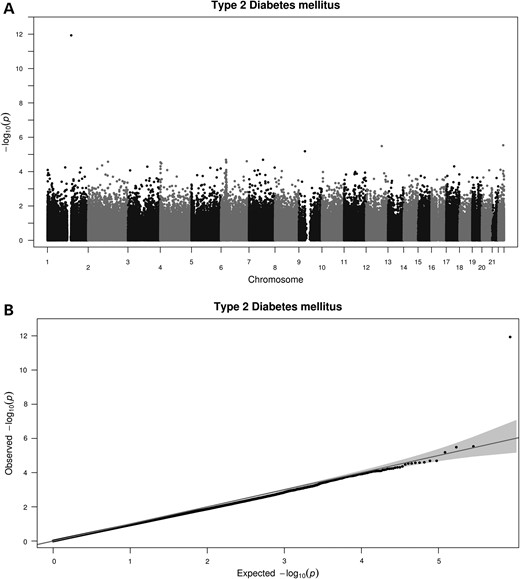
Manhattan plot shows the distribution of the P-values of the association between methylation probes in DM analysis in BASICMAR_1 discovery cohort (A) and QQ plot (B).
To further validate our genome-wide DNA methylation pipeline, we also assessed the highly replicated DNA methylation association with smoking habit (current versus non-current smokers), in the genes AHRR, cg05575921 (P = 1.21 × 10⁻³³) and F2RL3, cg03636183 (P = 3.03 × 10⁻²⁴) within our dataset (20,21).
Replication analysis of the novel CpG site associated with diabetes
Vascular risk factors and demographic data of the BASICMAR_2 and REGICOR cohorts, used to replicate the CpG identified in our analysis, are shown in Supplementary Material, Table S2 and S3. BASICMAR_2 contains 167 samples with methylation data from patients with IS, 108 non-DM and 59 DM (DM prevalence ∼35.3%). The REGICOR data are from a population-based cohort with a total of 645 samples with methylation data, 582 non-DM and 63 DM (DM prevalence of ∼10%).
The regression analysis between methylation and DM status was adjusted for sex, age, smoking habit, hyperlipidemia, BMI and cell count. The significant cg19693031 CpG site in TXNIP observed in the discovery analysis was attempted to replication, and it was successfully replicated in both cohorts. The BASICMAR_2 cohort showed mean methylation values of 0.74 (SD = 0.06) in non-DM patients and 0.69 (SD = 0.09) in DM patients, with an absolute methylation difference of 0.05 or 5% between groups (P = 1.37 × 10⁻⁶). The REGICOR cohort had mean methylation values of 0.71 (SD = 0.06) in non-DM patients and 0.68 (SD = 0.07) in DM patients, with a 3% methylation difference between groups (P = 6.08 × 10⁻⁵) (Table 2).
Methylation differences in the discovery BASICMAR_1 cohort identified in the discovery analysis and validated in BASICMAR_2 and REGICOR cohorts in peripheral blood between non-DM and DM in TXNIP gene
| cg19693031 | Cohorts | N | Non-DMa | DMa | Effect size (%) | P-value | Coef. |
|---|---|---|---|---|---|---|---|
| Discovery | BASICMAR_1 | 355 | 0.71 (0.06) | 0.66 (0.08) | 5 | 1.17 × 10⁻¹² | −0.35 |
| Validation | BASICMAR_2 | 167 | 0.74 (0.06) | 0.69 (0.09) | 5 | 1.37 × 10⁻⁶ | −0.30 |
| REGICOR | 645 | 0.71 (0.06) | 0.68 (0.07) | 3 | 6.08 × 10⁻⁵ | −0.53 |
Effect size (%): absolute difference in the mean beta values between groups expressed in percentage. P-value adjusted by sex, smoking habit, age, hyperlipidemia, BMI and cell count. Coef.: Regression coefficient.
aObserved mean β values (standard deviation).
Analysis of the role of HbA1c determination in methylation status at TXNIP
In order to explore the relationship between TXNIP hypomethylation and DM, we tested whether this association is more related to exposure to sustained hyperglycemia than to DM status. Therefore, we analyzed the association between DNA methylation and HbA1c (%), which reflects average glucose levels over the previous 12 weeks.
After FDR correction for multiple testing, we identified four CpG sites with differential methylation levels (Table 3). The most significant site was again cg19693031 in TXNIP locus, P = 7.3 × 10⁻¹⁶. The Manhattan plot of P-value distribution and quantile–quantile plot for expected versus observed χ2 values are shown in Figure 3. HbA1c (%) were negatively correlated with percentage of methylation in this locus, with a correlation coefficient of −0.13 (95% CI: −0.16, −0.88, P < 0.001) (Fig. 4). Of the four CpGs identified, we replicated one of them in the BASICMAR_2 cohort, the previously mentioned cg19693031 in TXNIP locus (P = 5.11 × 10⁻⁹) (Table 3).
CpG sites with significantly differential methylation in relation to HbA1c (%) in the discovery cohort
| CpG ID | Chr:position | Gene | Discovery BASICMAR_1 | Replication BASICMAR_2 | ||||||
|---|---|---|---|---|---|---|---|---|---|---|
| β valuea | P-value | FDR P-value | Coef. | β valuea | P-value | FDR P-value | Coef. | |||
| cg19693031 | 1: 145441552 | TXNIP | 0.69 (0.07) | 7.30 × 10⁻¹⁶ | 3.11 × 10⁻¹⁰ | −0.129 | 0.72 (0.08) | 5.11 × 10⁻⁹ | 2.05 × 10⁻⁸ | −0.144 |
| cg01676795 | 7: 75586348 | POR | 0.80 (0.06) | 1.05 × 10⁻⁷ | 0.019 | 0.061 | 0.51 (0.08) | 0.413 | 0.818 | 0.018 |
| cg07805383 | 2: 74346210 | … | 0.89 (0.10) | 1.32 × 10⁻⁷ | 0.019 | −0.162 | 0.89 (0.08) | 0.345 | 0.783 | 0.039 |
| cg26262157 | 10: 6214079 | PFKFB3 | 0.48 (0.04) | 4.41 × 10⁻⁷ | 0.047 | −0.061 | 0.28 (0.07) | 0.048 | 0.505 | −0.037 |
The global significance level of 0.05% corrected for multiple comparisons was established at P-value = 0.05/6 = 0.008 to define a difference as statistically significant. CpG ID; Chr:position, chromosome location (hg17); Gene: associated gene; P-value adjusted by sex, smoking habit, age, hyperlipidemia, BMI and cell count; FDR P-value: FDR adjusted P-value; Coef.: regression coefficient.
aObserved mean β value (standard deviation).
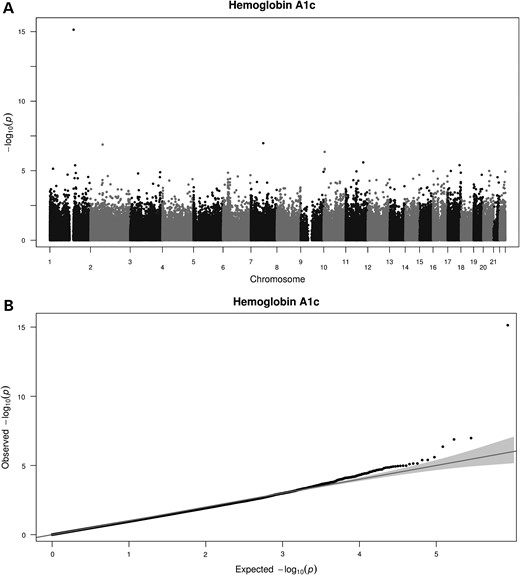
Manhattan plot shows the distribution of the P-values of the association between methylation probes in Hemoglobin A1c analysis in BASICMAR_1 discovery cohort (A) and QQ plot (B).
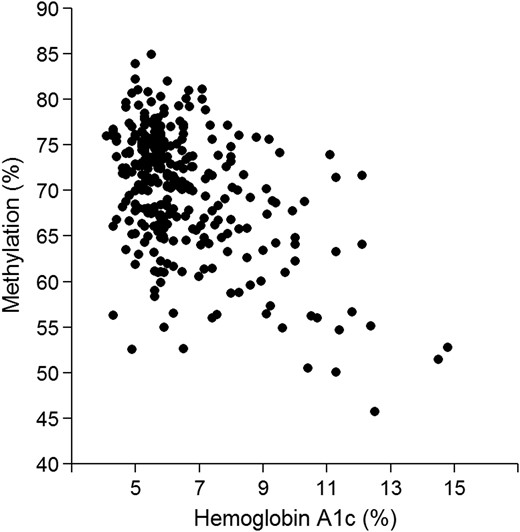
Scatterplot of β values of methylation in cg19693031 in TXNIP locus and Hemoglobin A1c in BASICMAR_1 discovery cohort (%). P-value = 7.30 × 10⁻¹⁶, adjusted for sex, age, hyperlipidemia, BMI, smoking habit and cell count.
Ordinal regression analysis between methylation and DM status based on HbA1c values—non-DM, DM-good control (HbA1c < 7%) and DM-poor control (HbA1c ≥ 7%)—confirmed the significant association in cg19693031 of TXNIP locus (P-value = 7.93 × 10⁻¹¹). Non-DM group was considered the reference group in logistic regression analyses, and the significant association in cg19693031 of TXNIP locus was due to DM patients with poor control of glucose levels (P-value = 1.89 × 10⁻¹³) (Table 4). DM patients with poor control of glucose levels showed a mean hypomethylation of 6% in this CpG than the non-DM group (Fig. 5). A modest association was observed between DM-poor control and DM-good control (P-value = 2.6 × 10⁻⁵), with a mean methylation difference of 3%, DM-poor control group was hypomethylated compared with DM-good control group. No association was observed between non-DM and DM-good control groups, but a tendency is observed with a mean methylation difference between groups of 3%. All these results were replicated in the BASICMAR_2 cohort (Table 4).
Genome-wide differentially methylated CpG cg19693031 in TXNIP locus between non-DM and DM patients based on HbA1c values, DM-good control (HbA1c < 7%) and DM-poor control (HbA1c ≥ 7%), from discovery BASICMAR_1 cohort and replication BASICMAR_2 cohort
| cg19693031 | N | HbAc1 (SD) | β values (SD) | Effect size (%) | P-value | Coef. | |
|---|---|---|---|---|---|---|---|
| Discovery BASICMAR_1 | Non-DM | 151 | 5.41 (0.53) | 0.70 (0.01) | Ref | Ref | Ref |
| DM-good control | 52 | 6.22 (0.49) | 0.67 (0.01) | 3 | 0.460 | −0.05 | |
| DM-poor control | 65 | 8.83 (1.81) | 0.64 (0.01) | 6 | 1.89 × 10⁻¹³ | −0.45 | |
| Validation BASICMAR_2 | Non-DM | 103 | 5.26 (0.53) | 0.74 (0.02) | Ref | Ref | Ref |
| DM-good control | 22 | 6.25 (0.49) | 0.71 (0.02) | 3 | 0.570 | 0.057 | |
| DM-poor control | 37 | 8.44 (1.35) | 0.67 (0.02) | 7 | 3.80 × 10⁻⁸ | −0.256 |
Non-DM was considered the reference group in the statistical analysis (Ref). HbAc1% (standard deviation, SD): mean HbAc1 values (standard deviation); β values: observed mean β value in this CpG site (SD); effect size (%): absolute difference in the mean beta values with respect to reference group expressed in percentage. P-value, adjusted by sex, smoking habit, age, hyperlipidemia, BMI and cell count. Coef.: regression coefficient.
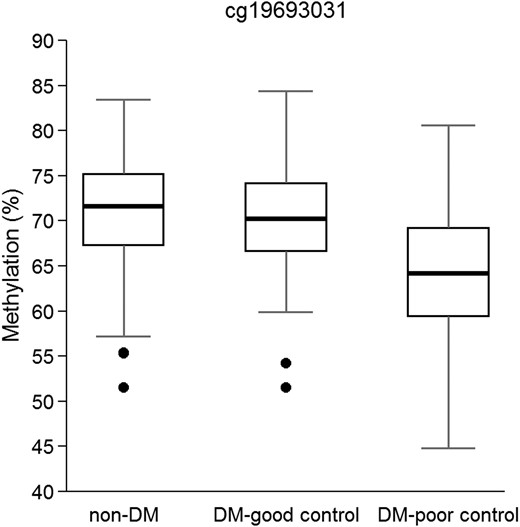
Boxplot of β values of methylation in cg19693031 in TXNIP locus in BASICMAR_1 discovery cohort. Non-DM group (N = 151), diabetics with a good control of glucose levels (DM-good control, N = 52) and diabetics with a poor control of glucose levels (DM-poor control, N = 65). P-values = 7.93 × 10⁻¹¹, adjusted for sex, age, hyperlipidemia, BMI, smoking habit and cell count.
Analysis of the role of DM medication
To explore possible effects of DM medication on our findings, we tested the association between methylation and DM medication at the time of blood sampling in DM patients (N = 151). We did not find a significant association with cg19693031 in TXNIP locus (P-value = 0.29), demonstrating that DM treatment is not a confounder in our analysis.
EpiTYPER validation
The differential methylation for cg19693031 in TXNIP was validated via Sequenom EpiTYPER approach in 283 randomly selected samples with HbA1c (%) available from the discovery cohort. The characteristics are summarized in Supplementary Material, Table S4. Sequenom EpiTYPER confirmed differential methylation in cg19693031 in TXNIP between DM status groups and HbA1c (%) as continuous variable (P < 0.001). Moreover, an adjacent CpG in the same PCR product (chr1:145441393–145441394) in TXNIP locus showed comparable behavior than cg19693031 (chr1:145441552–145441553) (Supplementary Material, Table S5).
The association of patients in the DM-poor control group and cg19693031 from the Illumina HumanMethylation 450 BeadChip array was technically validated with this technique, demonstrating the reliability of the array in general.
Discussion
In the present study, DM was associated with hypomethylation in the TXNIP gene in peripheral blood DNA of patients with IS and in a healthy population. Hypomethylation of this gene is related mainly to the average glucose levels in previous months (measured through HbA1c), suggesting an epigenetic consequence of hyperglycemia exposure rather than a cause of DM.
DNA methylation is an epigenetic mechanism regulating high-order DNA structure and gene expression. Usually DNA hypomethylation is associated with higher gene expression (17). Theoretically, the binding affinity of transcription factors may be affected by either local alteration of their DNA target sequences or through more global changes in chromatin accessibility (22–25). In silico analysis of cg19693031, located in the 3′ UTR of TXNIP, showed that is a likely binding motive associated with glucose import and/or chaperone binding site (5′ ACCCCAGAAGGTGA 3′). Thus, methylation differences in this locus may modify the binding affinity of methylation-sensitive transcription regulators, which are related to the mechanism of glucose exposure. In general, regulatory regions tend to be DNase-sensitive; cg19693031 is located in a DNAse-hypersensitive area assayed in three blood cell lines (CMK, GM12878 and HL-60), as reported from the ENCODE project (http://www.epigenomebrowser.org), which reinforces our assumption.
TXNIP encodes for thioredoxin-interacting protein and has multiple functions. It plays an important role in redox homeostasis and as a physiologic regulator of peripheral glucose uptake in humans induced by hyperglycemia and inhibits glucose uptake into fat and muscle (26–28). The phenotype of TXNIP knockout (KO) mice demonstrated that TXNIP plays a crucial role in several pathological conditions, including metabolic syndrome, inflammation and cancer (29,30). Moreover, these KO mice were markedly more insulin-sensitive than controls and augmented glucose transport was identified in both adipose and skeletal muscles (31). TXNIP expression is glucose-responsive and its expression is consistently elevated in the muscle of pre-diabetic and diabetic patients (28). However, there is no evidence for an association between DM and common genetic variations in TXNIP (28). In a recent GWAS publication (32), some variants at multiple loci were associated with HbA1c. However, these loci seem to be linked to erythrocyte parameters rather than to glucose metabolism, which may explain why TXNIP did not appear to be associated and also points to a TXNIP role in glycemia regulation. TXNIP expression is widely regulated by nutritional status, signals and enzymes (e.g., feeding-fasting, obesity, high glucose, amino acids and nuclear receptor signals). It has been reported as an important protein in glucose regulation and lipid homeostasis (29,33,34). In a recent publication, cg19693031 in TXNIP was associated with chylomicrons (class A) and known metabolic markers of DM, such as hexose and alpha-hydrobutyrate (35). While finalizing this manuscript, three studies were published and observed an association of DNA methylation at cg19693031 in TXNIP, and type 2 diabetes (36–38). Kulkarni et al (36) identified an association between cg19693031 methylation and DM, fasting blood glucose and insulin resistance in 850 pedigreed Mexican-American individuals using the Illumina HumanMethylation450 Beadchip. Chambers et al. (37) in a large, prospected, nested case–control study (N = 25,372), identified an association between differential methylation at five genetic loci, including TXNIP, and risk of future DM incidence among Indian Asians and Europeans. Finally, Florath et al. (38) showed the same association between cg19693031 methylation and DM in an elderly cohort from Germany (N = 988). Altogether, this information confirms a role for TXNIP in DM pathogenesis. DNA methylation could be the mechanism through which TXNIP expression is controlled and regulates glucose homeostasis.
Epidemiological evidence and data from clinical studies suggest the persistence of a ‘metabolic memory’ of past exposures to environmental factors or glycemic control (39). Results from two different clinical trials [Diabetes Control and Complications Trial (DCCT) in DM type 1 and Epidemiology of Diabetes Interventions and Complications in DM type 2] showed that early glycemic control after diagnosis contributes to decreased incidence of cardiovascular events, compared with late control. These observations led to the ‘metabolic memory’ hypothesis (40). DNA methylation may be one of the mechanisms involved in this phenomenon.
In this study, we analyzed one of the largest available series of participants with genome-wide methylation data, the first epigenome-wide association study analysis of IS patients. We replicated our results in two independent cohorts and validated them with a different technique. Moreover, we identified a CpG site related to type 2 DM patients and sustained hyperglycemia levels and validated it with different approaches. Additionally, we identified a new association of a nearby CpG in TXNIP (chr1:145441393–145441394). Recent publications have observed the same association between cg19693031 methylation and DM, validating and confirming our own research.
Some limitations of the study should be considered. First, we measured DNA methylation in peripheral blood cells. Methylation levels of some CpGs/regions are tissue-specific (41), and we might have lost some signals by not choosing specific tissues where glucose concentration could have a higher impact on DNA methylation. However, methylation patterns of whole blood have been reported as a good proxy for methylation levels from a specific site of action (13,21). Second, the design of the study is cross-sectional and we can only suspect but not infer causality of the reported associations.
In conclusion, hypomethylation of the TXNIP gene is related to type 2 DM. The inverse relationship between TXNIP methylation and HbA1c values suggests that TXNIP hypomethylation is a consequence of sustained hyperglycemia levels. It has been reported that TXNIP expression is highly sensitive to glucose concentrations, and DNA methylation may be a key mechanism to modulate its expression and likely to be an early biomarker for impaired glucose homeostasis.
Materials and Methods
Study participants
The study included three independent prospective cohorts of Caucasian patients recruited in Spain (N = 355, N = 167 and N = 645), analyzed retrospectively.
The discovery cohort, BASICMAR_1 cohort, was recruited in Hospital del Mar in Barcelona, Spain, and included a subsample of IS patients (N = 355), recruited from 2005 to 2009, from those enrolled in BasicMar Register (Ministerio de Sanidad y Consumo, Instituto de Salud Carlos III; FIS No. PI051737), an ongoing prospective registry of stroke patients (42). The BASICMAR_2 cohort, a second subsample of IS patients (N = 167) from those enrolled in the BasicMar Register, was used as one of the replication cohorts recruited from 2009 to 2012. The BasicMar Register prospectively recruited all consenting patients who were admitted to our hospital from 2005 to 2012 (n = 4291; response rate, 80.8%) with a diagnosis of stroke fulfilling World Health Organization criteria. Inclusion criteria in BASICMAR cohorts were as follows: (1) first-ever IS, (2) brain imaging with CT or MRI, (3) availability of the clinical data supporting the assigned stroke subtype according to TOAST classification (19), (4) availability of the clinical data of HbA1c and BMI and (5) absence of intracranial hemorrhage, neoplasms, demyelinating and autoimmune diseases and vasculitides. All patients were assessed and classified by a neurologist and were included in the study by consecutive order of recruitment. The decision of using an IS cohort as the discovery cohort to study DM was based on several reasons. It has a higher prevalence of DM (∼44%), compared with the healthy population, which may improve the discovery power, and also the well characterized and accurate phenotyped individuals add value to the discovery phase.
Girona Heart Registry (REGICOR, which stands for REgistre GIroni del COR) is a population-based cohort recruited in the province of Girona, in northeast Spain, ∼100 km from Hospital del Mar (Barcelona). This register includes a randomized representative sample of men and women of the province of Girona. We used follow-up data from a population-based cohort originally enrolled in 2003–2005 (n = 6352; response rate, 71.5%) from towns that represent the urban and rural diversity of Girona Province (43). During 2009–2013, participants still residing in these towns were invited to participate in a follow-up visit; institutionalized residents were excluded. The response rate was 78.4%. A subsample of those attending their follow-up visit was selected for a replication cohort, 645 individuals (582 controls and 63 DM). The selection of a population-based cohort for replication warrants the external validity of the results to the general population.
All subjects were of European descent. The study was approved by the local ethics committee, CEIC-Parc de Salut Mar, and participants gave written informed consent. The study was conducted according to the principles expressed in the Declaration of Helsinki and relevant legislation in Spain.
Demographic and vascular risk factor variables
As defined by international guidelines, data on vascular risk factors analyzed were obtained from direct interview of the patient, relatives and caregivers, and from medical records. Examinations were performed and standardized questionnaires administered by a team of neurologists and reviewer by an additional neurologist.
We recorded age, sex and vascular risk factors, which were collected in a structured questionnaire during hospitalization, as follows: arterial hypertension, defined as systolic blood pressure (SBP) ≥ 140 mmHg or diastolic (DPB) ≥ 90 mmHg previous to the acute event in more than two determinations, a physician's diagnosis, or use of medication (collected during hospitalization); hyperlipidemia, defined as a physician's diagnosis, use of medication, serum cholesterol concentration >220 mg/dl, low-density lipoprotein cholesterol (LDL) > 130 mg/dl, or serum triglyceride concentration > 150 mg/dl (collected during hospitalization); first measure glucose value (non-fasting) during hospitalization; ischemic heart disease (documented history of angina pectoris or myocardial infarction); and atrial fibrillation (documented history or diagnosis during hospitalization) and self-reported smoking habit. During hospitalization lymphocyte count, BMI, stroke severity was measured by the NIHSS (18), and TOAST criteria was used to classify IS subtype (19), is recorded through standardized protocol.
No missing data were observed for the variables age, sex, hypertension, hyperlipidemia, atrial fibrillation and ischemic heart disease. The percentage of participants in BASICMAR_1 cohort with missing values for smoking habit was 2% and BMI was 12.1%. The percentage of participants in BASICMAR_2 cohort with missing values for BMI was 9.7%.
Diagnosis of diabetes mellitus type 2
DM diagnosis was based on evidence of two or more fasting blood glucose values ≥ 126 mg/dl, use of diabetes medication or previous physician diagnosis. Hemoglobin A1c (HbA1c) values were obtained during hospitalization, only from BASICMAR cohorts, measured by high-performance liquid chromatography. The percentage of participants in BASICMAR_1 cohort with missing values for HbA1c was 25%, and 1.6% in BASICMAR_2 cohort. Patients with unknown DM and HbA1c values of ≥6.5% were classified as DM patients independently of current blood glucose levels. On the other hand, DM patients were classified in two groups depending on their control of glucose levels: HbA1c < 7% (DM-good control) or HbA1c ≥ 7% (DM-poor control).
Peripheral blood collection and DNA extraction
DNA samples were extracted from whole peripheral blood collected in 10 ml EDTA tubes. The Chemagic Magnetic Separation Module I system (Chemagen) was used for DNA isolation in BASICMAR cohorts, and The Autopure LS (Qiagen) in the REGICOR cohort. Genome-wide DNA methylation was assessed using the Illumina HumanMethylation450 Beadchip. DNA extractions were performed at the same time and stored together at −20°C. DNA concentrations were quantified using Picogreen assay and Nanodrop technology. The quality of DNA samples was visualized in agarose gels.
Array-based DNA methylation analysis with Infinium Human Methylation450k
Genomic DNA (1 µg) was bisulfite-converted using the EZ-96 DNA Methylation Kit (Zymo Research, Orange, CA, USA) according to the manufacturer's procedure, with the alternative incubation conditions recommended when using the Illumina Methylation Assay.
Genome-wide DNA methylation was assessed using the Illumina HumanMethylation450 Beadchip (Illumina Netherlands, Eindhoven, Netherlands) following the manufacturer's protocol with no modifications. This array covers 485 577 methylation CpG sites in 99% of RefSeq genes (21 231 genes). The arrays were scanned with the Illumina HiScan SQ scanner. These processes were carried out in Progenika Biopharma in Bizkaia, Spain, for the BASICMAR cohorts and in two different laboratories of the Spanish National Genotyping Centre for the REGICOR cohort: the Centre for Genomic Regulation in Barcelona and the Centro Nacional de Investigaciones Oncológicas in Madrid. Two repeated samples were included in all the plates to take into account batch effects. In the REGICOR cohort was performed a sensitivity analysis, normalizing the data by laboratory batch effect (Supplementary Material, Table S6).
Data preprocessing and normalization
Data were preprocessed using standardized pipelines (44,45).
Sample quality control
Initial quality control of sample data was conducted using GenomeStudio version 2011.1 (Illumina, San Diego, CA, USA) with the methylation module (version 1.9.0) to determine the status of staining, extension, hybridization, target removal, bisulfite conversion, specificity, non-polymorphic and negative controls (without background correction or normalization). We used all the samples that had a detection rate over 95%. Then, we tested whether we could group samples by sex according to their DNA methylation levels on the X-chromosome using the methylumi R package (46). Samples that performed poorly in these quality controls were excluded from further analysis (Supplementary Material, Table S1).
Cpg quality control
We excluded all probes that were represented by a bead count under three in at least 5% of the samples. CpG sites having 1% of samples with a detection P-value of >0.05 were removed and cross-reactive probes were excluded (47) using the wateRmelon R package (44). To avoid SNP (single-nucleotide polymorphism) effects on methylation measures and sex bias, we excluded CpGs with SNPs present inside the probe body and at the CpG site, and all probes associated with an allosomal position (Supplementary Material, Table S1).
Before analysis of BASICMAR cohorts, methylation values were corrected for background values and then normalized by SWAN using minfi Bioconductor package (48,49). REGICOR cohort normalized by dasen method (44,50) using the RnBeads package (51).
In statistical models, β values were transformed using a variance stabilization transformation to methylation M-values (52). β value ranges between 0 (completely unmethylated) and 1 (completely methylated), expressed as percentages (range 0–100%). Effect size refers to the absolute difference in the mean β values between the groups analyzed; it can be expressed as percentage. Owing to its good statistical properties, M-value was the main outcome variable used in our analyses (51,53). We used a previously published algorithm to infer white blood cell counts from DNA methylation data (53). Prior to statistical analyses, M-values were adjusted to remove batch effect using the SVA R package (54). We used the array annotations provided by Illumina to assign probes to the corresponding genes. Finally, a total of 355 samples and 426 036 autosomal probes in the BASICMAR_1 cohort were included in the analysis, 167 samples from the BASICMAR_2 cohort and 645 samples from the REGICOR cohort. The significant CpG site was analyzed in each cohort.
Sequenom EpiTYPER analysis: technical validation
The differential methylation for the most significant locus, cg19693031 in TXNIP (chr1:145 438 438–145 442 635), was validated with EpiTYPER assay (Sequenom, San Diego, CA) on 283 samples of the BASICMAR_1 cohort with HbAc1 data available. Following the manufacturer's instructions, 10 ng of bisulfite-treated DNA were PCR-amplified and processed. At least two replicate amplifications were performed in all instances. The primers used were as follows: forward, 5′ TGATTTTTTAATGTAGGAGGTGGTT 3′ and reverse, 5′ AATTCAAAATCCAAAATTCCTATCA 3′.
Analysis of in silico binding affinities
The MEME Suite web server was used to discover and analyze the sequence motifs representing features such as DNA binding sites and protein interaction domains in TXNIP locus (55). Conserved motif analyses were performed using the online MEME system version 4.10. The maximum motif width, the minimal motif width and the number of different motifs were set to 50, 5 and 8, respectively (56). The remaining parameters are the default values. Transcription factor motifs (discovered using MEME) were further analyzed for putative function by association with Gene Ontology (GO) terms using the motif-GO term association tool GOMO (57).
Statistical analysis
Baseline characteristics were compared using t-test for continuous, and chi-squared for categorical variables.
First, we analyzed the association between DNA methylation at all the individual CpG sites and DM in BASICMAR_1 cohort. We included all the individuals and CpG sites that passed quality controls and had the adjustment variables available (BASICMAR_1 cohort N = 355). The global significance level of 0.05% in the discovery cohort, corrected for multiple comparisons, was established at P-value < 1 × 10⁻⁷ to define a difference as statistically significant. We analyzed for differences in methylation at the CpG sites between the group of individuals without DM and the group with diagnosed DM, using a multivariate linear regression. The CpGs with P-values < 5 × 10⁻⁷ were analyzed in BASICMAR_2 and REGICOR cohorts to replicate the results of the discovery analysis, to include significant CpGs in the EWAS analysis (P-value < 1 × 10⁻⁷) and CpGs close to significance.
Second, after the replication of the results, and in order to better understand the relationship between DM and methylation changes, we analyzed the association between DNA methylation and HbAc1 values in BASICMAR cohorts. HbAc1 values were available in 268 patients in BASICMAR_1 and in 162 patients in BASICMAR_2.
We relied on methylation β values for the presentation of the scatterplots and boxplots, as they allow an easier interpretation of the results. In the linear models with covariates, we used the M-value because it offers better statistical capacity.
The validation of methylation values in cg19693031 obtained with Sequenom EpiTYPER assay included comparison of DM status using two-tailed Student t-test and Spearman correlation test with HbAc1 as continuous variable.
The analyses were performed using the R statistical package, version 3.1.2 (58). The following packages were utilized: minfi, sva and limma (48,54,59). The same statistical methods were used in the replication phase. Methylation M-values were analyzed using multivariate linear regression. All the analyses were adjusted for age, sex, smoking habit, hyperlipidemia, BMI and cell count. The variables age, sex, smoking habit and cell count are known confounders in DNA methylation analysis and must be considered in the statistical analysis (Supplementary Material, Fig. S1) (60–66).
Accession numbers
Methylation data have been submitted to the Gene Expression Omnibus (GEO, http://www.ncbi.nlm.nih.gov/geo/) under accession number GSE69138.
Funding
This project was funded in part by the following sources: Agència de Gestió Ajuts Universitaris de Recerca (2014 SGR 1213); the Spanish Ministry of Economy through the Carlos III Health Institute (ISCIII-FIS-FEDER-ERDF, PI12/01238); the Red de Investigacion Cardiovascular (RD12/0042/0020, RD12/0042/0013); and a RecerCaixa 2013 research grant (JJ086116). S.S.-B. is funded by an iPFIS contract from Instituto de Salud Carlos III (IFI14/00007).
Acknowledgements
We thank the GeneStroke ‘The Spanish Stroke Genetics Consortium’ led by Jordi Jiménez-Conde ([email protected]), and formed by Carolina Soriano-Tárraga, Eva Giralt-Steinhauer, Marina Mola, Ángel Ois, Ana Rodríguez-Campello, Elisa Cuadrado-Godia and Jaume Roquer from Hospital del Mar-IMIM (Barcelona, Spain), Jurek Krupinski and Israel Fernández-Cadenas from Mútua de Terrassa (Terrassa, Barcelona), Caty Carrera from Hospital Vall d'Hebrón (Barcelona), Kelly Rabionet from CRG (Barcelona), Victor Obach Hospital Clínic (Barcelona) Tófol Vivas and Rosa Maria Díaz Navarro from Hospital Son Espases (Mallorca). The authors wish to thank Elaine M. Lilly, Ph.D., Writers First Aid, provided assistance in the English language revision of the manuscript.
Conflict of Interest statement. None declared.
References
