


Abstract
Decentralized, person-centred models of care delivery for drug-resistant tuberculosis (DR-TB) continue to be under-resourced in high-burden TB countries. The implementation of such models—made increasingly urgent by the COVID-19 pandemic—are key to addressing gaps in DR-TB care. We abstracted data of rifampicin-resistant (RR)/multidrug-resistant tuberculosis (MDR-TB) patients initiated on treatment at 11 facilities between 2010 and 2017 in Sindh and Balochistan provinces of Pakistan. We analysed trends in treatment outcomes relating to programme expansion to peri-urban and rural areas and estimated driving distance from patient residence to treatment facility. Among the 5586 RR/MDR-TB patients in the analysis, overall treatment success decreased from 82% to 66% between 2010 and 2017, as the programme expanded. The adjusted risk ratio for unfavourable outcomes was 1.013 (95% confidence interval 1.005–1.021) for every 20 km of driving distance. Our analysis suggests that expanding DR-TB care to centralized hubs added to increased unfavourable outcomes for people accessing care in peri-urban and rural districts. We propose that as enrolments increase, expanding DR-TB services close to or within affected communities is essential.
Despite evidence and policy in favour of decentralized, person-centred models of care, low- and middle-income countries continue to face major access barriers in the management of DR-TB care delivery from diagnosis to end of treatment.
We share our experience in the scale-up of routine DR-TB care at 11 facilities from 2010 to 2017 across two major provinces of Pakistan and its impact on treatment outcomes.
Expanding DR-TB services at a rapid rate may appear desirable; however, if not paired with a concurrent rise in high-quality community-based care close to where patients live or work, it may not improve the quality of clinical care and treatment outcomes.
Our study highlights the urgency of providing care close to patients’ homes. This is especially pertinent in the era of COVID-19 pandemic, where intermittent lockdowns create further barriers in accessing healthcare for vulnerable communities suffering from DR-TB.
Introduction
For over two decades, the spread of drug-resistant strains has threatened global efforts in tuberculosis (TB) control. Inadequate real-time surveillance, limited deployment of x-ray based screening and rapid molecular confirmatory testing and ineffective referral pathways to detect, treat and manage patients have fuelled the drug-resistant tuberculosis (DR-TB) epidemic (Cox et al., 2019). This has resulted in a growing access gap impacting the diagnosis and treatment of rifampicin-resistant (RR) and multidrug-resistant tuberculosis (MDR-TB). Of an estimated 465 000 RR/MDR-TB cases worldwide, only 48% were diagnosed, and 38% started treatment in 2019 (World Health Organization, 2020).
Decentralized, person-centred models of care delivery—where care is provided in the communities where people affected by TB disease and infection live and work—have demonstrated that access barriers to DR-TB care can be ameliorated to address the DR-TB epidemic (Daru et al., 2018; Evans et al., 2018; Zawedde-Muyanja et al., 2018). Such models have demonstrated increased value compared with those based on in-patient care (Van Rensburg et al., 2019; Lyakurwa et al., 2021). However, despite the World Health Organization’s (WHO) endorsement of a decentralized model of care delivery for DR-TB in 2011, several challenges continue to be faced by implementers, many of which are context-specific and require local solutions (Vanleeuw et al., 2020; Leavitt et al., 2021).
In the last several years, important changes in the RR/MDR-TB treatment landscape have included the introduction of two new oral drugs, bedaquiline and delamanid, and the prioritization of all-oral regimens (Khan et al., 2019; World Health Organization, 2019; Franke et al., 2021). While these are all welcome improvements, access to these treatments and to appropriate monitoring remains a challenge. This is further compounded by facility-based DR-TB care, which is usually not proximate to patient residence; this impacts the overall quality of clinical care and ultimately treatment outcomes (Mezwa et al., 2018).
In resource-limited settings such as Pakistan, which are already struggling to combat endemic infectious diseases such as DR-TB, the COVID-19 pandemic has rendered the population even more vulnerable and exacerbated the challenges (Lloyd-Sherlock et al., 2020; Mesa Vieira et al., 2020).
In Pakistan, DR-TB services are primarily located at tertiary care facilities providing care to people from surrounding districts. Patients typically travel long distances for care, especially those who belong to peri-urban and rural areas. This can lead to suboptimal care resulting in pre-treatment loss to follow-up, overall poor treatment outcomes (Jackson et al., 2017; Ketema et al., 2019) and negative public health impact due to unabated community transmission (Van Cutsem et al., 2016). A review of data on DR-TB treatment outcomes in Pakistan indicates a decrease of success rate from 70% (2011 cohort) to 64% (2017 cohort; World Health Organization, 2014). Although several demographic, biological and treatment-related factors may be responsible for this, we posit that the expansion of centralized DR-TB that does not adapt to community context and individuals’ conditions largely accounts for this decline (Abbas et al., 2021).
In this manuscript, we aimed to assess the impact on treatment outcomes of scale-up of routine DR-TB services in two major provinces of Pakistan: Sindh and Balochistan. We used distance to treatment site and its association with patient treatment outcomes to highlight the impact of centralized care on DR-TB patients’ treatment outcomes.
Materials and methods
Setting
We present findings from a retrospective cohort of TB patients initiated on routine RR/MDR-TB treatment between 8 January 2010 and 30 December 2017 at 11 treatment sites in Pakistan. Of the 11 treatment sites, 9 were in Sindh province and 2 in Balochistan province. The majority of treatment sites were in the public sector; however, there were three private health facilities, all of which were in Sindh. Resource availability varied widely between sites (Supplementary Table S1). All sites were managed by the affiliated partner for DR-TB service provision. In Pakistan, routine second-line treatment is available through the national programme for TB control. This is primarily financed through the Global Fund to Fight AIDS, Tuberculosis and Malaria project, and patients are initiated on treatment based on national guidelines. The affiliated partner, a private-sector, not-for-profit organization that provides free-of-cost health services, along with its technical partner, the authors’ institute, initiated DR-TB treatment through private donations in November 2007 in Karachi (Pakistan’s most populous city, located in Sindh province). From 2010 onwards, the affiliated partner along with technical support from the authors’ institute, supported the national programme for TB control to expand access to DR-TB services in Sindh and Balochistan provinces, providing free care at all 11 treatment facilities.
Patient monitoring and follow-up
At each site, patient monitoring was performed according to the national guidelines for DR-TB. Patients were initiated on treatment and evaluated during monthly outpatient visits for 18–24 months. Treatment adherence was monitored by treatment supporters (usually from patients’ families). The programme provided monthly social support and travel allowance at a fixed rate of Pakistani rupees (PKR): 600 for each follow-up visit. To support patient monitoring, community activities such as monitoring of treatment supporters, contact tracing and tracking of patients who are lost to follow-up were supervised by treatment coordinators assigned to catchment areas or districts.
At the start of treatment, sputum smear microscopy, sputum culture and first- and second-line drug-susceptibility testing (DST) were performed according to guidelines. However, the provision and quality of follow-up services were highly dependent on the availability of resources at each site. For example, while smear and culture testing were routinely performed during follow-up, they were only available at select sites. Phenotypic DSTs were performed at the biosafety level 3 (BSL-3) laboratory at the affiliated partner’s TB laboratory in Karachi, thus requiring specimen transport from most treatment facilities (for details see Supplementary Table S1). Clinical laboratory tests are part of the routine monitoring schedule but were subject to test availability at each site. Some sites had in-patient care facilities, while others had to refer patients elsewhere for further management. One private-sector site with financing outside of the routine programme was able to support additional activities such as mental health care, contact tracing and adverse event monitoring. Post-treatment follow-up was required but not performed routinely across all sites.
Data collection
Routine programmatic data were collected for every patient enrolled using the national DR-TB paper forms at each site. Baseline demographics, clinical data and bacteriological results were entered into a Microsoft Excel file using a national programme-approved reporting template. Demographic and clinical data were abstracted retrospectively from these files and included treatment facility, treatment initiation date, patient age, sex, home address, treatment history, site of disease (pulmonary vs extrapulmonary), chest x-ray, resistance profile, baseline bacteriology, phenotypic DST results and treatment outcome.
The patient addresses were cleaned and then geocoded using Google’s Geocoding Application Programming Interface (API; Brokamp et al., 2018). We used Google’s Directions API to compute the driving distance from the patient residence to their treatment facility (Google Inc, 2021a,b). For our analysis, we used the distance of the first-ranked recommended route by the Directions API. Approximately 87% of addresses were geocoded successfully on the first attempt. For the rest, a second round of data cleaning was performed, following which all addresses were successfully geocoded.
Definition of treatment outcomes
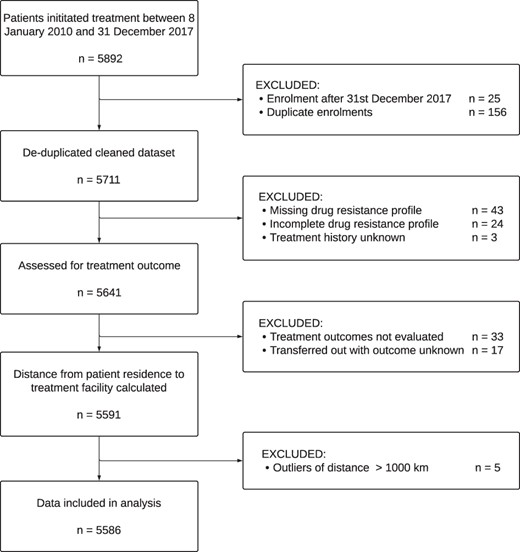
We defined treatment outcomes based on the WHO definitions (World Health Organization, 2013) and created a binary variable (‘favourable’ vs ‘unfavourable’). ‘Unfavourable’ outcomes included treatment failure, died and lost to follow-up. ‘Favourable’ treatment outcomes included treatment completion or cure. Patients with an outcome of ‘transferred out’ and ‘not evaluated’ were excluded (Figure 1).
Study flowchart
Statistical methods
Our primary exposure of interest was driving distance to the treatment site from the patient’s residence, and we estimated the association with an unfavourable treatment outcome using multivariable logistic regression to adjust for confounding (Model 1). Driving distance was included as a continuous variable (one unit for every 20 km travelled). The following potential confounders were included: age, sex, localization of disease, exposure to second-line regimen, fluoroquinolone (FQ) resistance, year of enrolment, advanced disease at diagnosis (defined as 3+ sputum smear-positivity and/or cavitation on chest x-ray) and treatment facility. Resistance profile was categorized based on baseline DST results as FQ-resistant or not. Patient residence type was defined as ‘urban’ if located in Karachi, whereas all other areas were categorized as ‘peri-urban and rural’. We included treatment facility as a fixed effect in the model. A sensitivity analysis (Model 2), restricting inclusion to patients who were residents within 250 km of the treatment site, was undertaken to assess if the association with unfavourable outcomes was primarily driven by those living more than 250 km from their treatment facility. Complete-case analysis methods were used. For ease of interpretation, results of the logistic regression models are presented graphically as predicted probabilities of an unfavourable treatment outcome and risk ratios with 95% confidence intervals (CIs) using marginal standardization methods (Norton et al., 2013). In brief, the predicted probability of an unfavourable treatment outcome is adjusted to a weighted average reflecting the confounder distribution in the total population (Muller and Maclehose, 2014). Statistical analyses were carried out using Stata/SE 16 (College Station, TX: StataCorp LP).
Results
Participants
From 2010 to 2017, 5711 patients were initiated on RR/MDR-TB treatment at 11 facilities. Patients came from 172 tehsils (sub-districts) in 67 districts across Pakistan. We excluded 120 (2.1%) patients with incomplete or missing data pertaining to treatment outcomes, drug resistance or treatment history (Figure 1). We also excluded five patients for whom the calculated distance from residence to treatment facility was greater than 1000 km (Supplementary Figure S1).
A total of 5586 (97.7%) patients enrolled over 8 years across the 11 participating treatment facilities were included in the analysis (Table 1). The proportion of males and females was similar, and over half of the patients (3116; 55%) were below 35 years of age. One thousand six hundred and seventeen (29%) of the RR/MDR-TB patients were resistant to FQ at baseline. One thousand two hundred and fifty-six (22%) patients had advanced disease at the time of diagnosis, and 447 (8%) patients had previously received a second-line treatment regimen. The majority of patients enrolled resided in the province of Sindh (92%) and most (88%) resided in peri-urban and rural areas (outside Karachi). The median estimated driving distance was 16 km (range: 0.5–707 km) for patients from urban areas, 59 km (range: 0.1–912 km) for those from peri-urban and rural areas and 46 km (range: 0.1–912 km) overall.
Baseline characteristics of MDR-TB patients by year of enrolment 2010–2017 (n = 5586)
| 2010–2011 | 2012–2013 | 2014–2015 | 2016–2017 | Total | ||||||
|---|---|---|---|---|---|---|---|---|---|---|
| n | % | n | % | n | % | n | % | n | % | |
| Overall | 185 | 3% | 730 | 13% | 2211 | 40% | 2460 | 44% | 5586 | 100% |
| Sex | ||||||||||
| Males | 90 | 49% | 378 | 52% | 1150 | 52% | 1245 | 51% | 2863 | 51% |
| Females | 95 | 51% | 352 | 48% | 1061 | 48% | 1215 | 49% | 2723 | 49% |
| Age categorya | ||||||||||
| 0–14 years | 10 | 5% | 25 | 3% | 77 | 3% | 83 | 3% | 195 | 3% |
| 15–24 years | 67 | 36% | 211 | 29% | 615 | 28% | 662 | 27% | 1555 | 28% |
| 25–34 years | 41 | 22% | 198 | 27% | 551 | 25% | 576 | 23% | 1366 | 24% |
| 35–44 years | 32 | 17% | 133 | 18% | 398 | 18% | 407 | 17% | 970 | 17% |
| 45–54 years | 17 | 9% | 86 | 12% | 279 | 13% | 367 | 15% | 749 | 13% |
| 55–64 years | 15 | 8% | 46 | 6% | 185 | 8% | 246 | 10% | 492 | 9% |
| 65+ years | 3 | 2% | 31 | 4% | 103 | 5% | 118 | 5% | 255 | 5% |
| Province of residence | ||||||||||
| Sindh | 184 | 99% | 647 | 89% | 2042 | 92% | 2270 | 92% | 5143 | 92% |
| Balochistan | 1 | 1% | 83 | 11% | 166 | 8% | 185 | 8% | 435 | 8% |
| Punjab | 0 | 0% | 0 | 0% | 3 | 0% | 5 | 0% | 8 | 0% |
| Rural–urban residence | ||||||||||
| Urban (Karachi) | 55 | 30% | 113 | 15% | 205 | 9% | 293 | 12% | 666 | 12% |
| Peri-urban and rural (All other areas) | 130 | 70% | 617 | 85% | 2006 | 91% | 2167 | 88% | 4920 | 88% |
| Driving distance to treatment site (km) | Median | Range | Median | Range | Median | Range | Median | Range | Median | Range |
| Urban (Karachi) | 23.8 | (5.6–32.2) | 17.4 | (3.6–42.7) | 17.1 | (0.5–42.7) | 14.5 | (1.2–707.2) | 16.3 | (0.5–707.2) |
| Peri-urban and rural (all other areas) | 164.2 | (2.1–503.2) | 89.2 | (1.5–825.5) | 61.6 | (0.8–745.6) | 50.2 | (0.1–911.5) | 59.2 | (0.1–911.5) |
| Overall | 30.5 | (2.1–503.2) | 58.0 | (1.5–825.5) | 52.4 | (0.5–745.5) | 37.9 | (0.1–911.5) | 46.4 | (0.1–911.5) |
| Treatment facilityb | ||||||||||
| Indus Hospital (Karachi) | 185 | 100% | 275 | 38% | 278 | 13% | 291 | 12% | 1029 | 18% |
| Institute of Chest Diseases (Kotri) | 0 | 0% | 273 | 37% | 605 | 27% | 525 | 21% | 1403 | 25% |
| Ghulam Muhammad Mahar Medical College (Sukkur) | 0 | 0% | 80 | 11% | 346 | 16% | 370 | 15% | 796 | 14% |
| Fatima Jinnah Hospital (Quetta) | 0 | 0% | 74 | 10% | 142 | 6% | 122 | 5% | 338 | 6% |
| Civil Hospital (Mirpurkhas) | 0 | 0% | 4 | 1% | 319 | 14% | 298 | 12% | 621 | 11% |
| People’s Medical College Hospital (Nawabshah) | 0 | 0% | 0 | 0% | 190 | 9% | 300 | 12% | 490 | 9% |
| Chandka Medical College Hospital (Larkana) | 0 | 0% | 11 | 2% | 187 | 8% | 230 | 9% | 428 | 8% |
| Jinnah Postgraduate Medical Centre (Karachi) | 0 | 0% | 13 | 2% | 144 | 7% | 158 | 6% | 315 | 6% |
| Red Crescent Hospital (Hyderabad) | 0 | 0% | 0 | 0% | 0 | 0% | 79 | 3% | 79 | 1% |
| District Headquarters Hospital (Loralai) | 0 | 0% | 0 | 0% | 0 | 0% | 26 | 1% | 26 | 0% |
| Delhi Medical Centre (Karachi) | 0 | 0% | 0 | 0% | 0 | 0% | 61 | 2% | 61 | 1% |
| Site of TB infection | ||||||||||
| Pulmonaryc | 177 | 96% | 716 | 98% | 2182 | 99% | 2418 | 98% | 5493 | 98% |
| Extrapulmonary | 8 | 4% | 14 | 2% | 29 | 1% | 42 | 2% | 93 | 2% |
| Documented FQ resistance | ||||||||||
| Yes | 69 | 37% | 265 | 36% | 617 | 28% | 665 | 27% | 1617 | 29% |
| No | 116 | 63% | 465 | 64% | 1593 | 72% | 1795 | 73% | 3969 | 71% |
| Previously treated with second-line drugs | ||||||||||
| Yes | 54 | 29% | 69 | 9% | 115 | 5% | 209 | 8% | 447 | 8% |
| No | 131 | 71% | 661 | 91% | 2096 | 95% | 2251 | 92% | 5139 | 92% |
| Documented advanced disease | ||||||||||
| Yesd | 39 | 21% | 213 | 29% | 559 | 25% | 445 | 18% | 1256 | 22% |
| No | 146 | 79% | 517 | 71% | 1652 | 75% | 2015 | 82% | 4330 | 78% |
| Treatment outcomes | ||||||||||
| Cured | 128 | 69% | 501 | 69% | 1389 | 63% | 1543 | 63% | 3561 | 64% |
| Treatment completed | 16 | 9% | 32 | 4% | 98 | 4% | 105 | 4% | 251 | 4% |
| Treatment failed | 11 | 6% | 31 | 4% | 119 | 5% | 151 | 6% | 312 | 6% |
| Died | 23 | 12% | 128 | 18% | 354 | 16% | 402 | 16% | 907 | 16% |
| Lost to follow-up | 7 | 4% | 38 | 5% | 251 | 11% | 259 | 11% | 555 | 10% |
Age missing for four patients.
Order of treatment facility follows the timing of when the site was opened.
Includes 10 patients with both extrapulmonary and pulmonary infection.
3+ smear-positive, with or without cavitation on chest x-ray.
Program expansion
At the start of the programme in 2010–2011, 185 patients were enrolled at The Indus Hospital in Karachi. As the programme scaled up and additional treatment facilities were brought on board, enrolments increased rapidly from 730 in 2012–2013 to 2210 in 2014–2015 and 2460 in 2016–2017 (Figure 2). This expansion was supported by the increase in treatment coordinators from 3 during 2010–2011 to 15 in 2016–2017. However, the average number of patients supported by each treatment coordinator too increased from 64 to 250 during the same period (Supplementary Table S1).
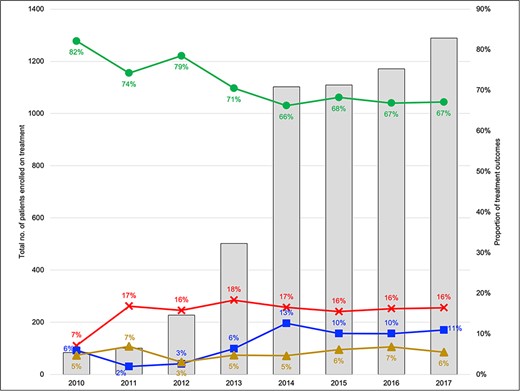
Annual trends in MDR-TB patient enrolments and treatment outcomes (2010–2017). Legend: Outcomes are reported for cohort enrolled in the specified year
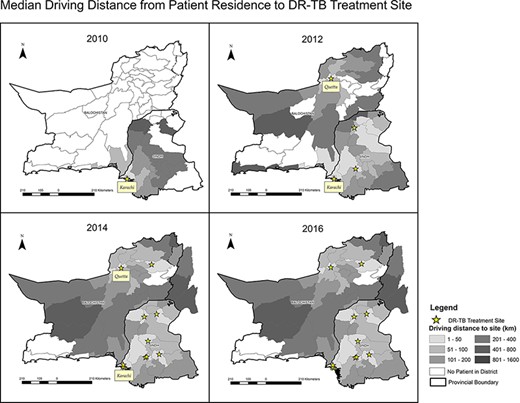
This programme expansion was associated with a change in patient characteristics in terms of age, province of residence, peri-urban/rural (vs urban) residence type, resistance profile and treatment history (Table 1). With the opening of new treatment facilities, median distance to the treatment site for patients in surrounding districts declined over time (Figure 3). Median driving distance to a patient’s treatment facility remained unchanged in urban areas. However, in peri-urban and rural areas, it decreased from a median of 164 km in 2010–2011 to 50 km in 2016–2017 (Table 1).
Median driving distance from patient residence to DR-TB treatment site
Treatment outcomes
Although most patients had favourable treatment outcomes (64% cured; 4% treatment completed), treatment success rates decreased over time from 82% in 2010 to around 66% from 2014 onwards (Figure 2). Patients lost to follow-up increased over time from 6% to a peak of 13% in 2014. Of note, patients residing in peri-urban and rural areas had an unadjusted 29% higher risk of unfavourable outcomes as compared to those living in Karachi (risk ratio 1.29, 95% CI 1.12–1.47). Compared to the Indus Hospital, which is located in an urban area of Karachi, all facilities located in peri-urban and rural areas had a higher unadjusted risk of an unfavourable outcome: ICD Kotri (risk ratio 1.20, 95% CI 1.06–1.36), Ghulam Muhammad Mahar Medical College, Sukkur (risk ratio 1.32, 95% CI 1.16–1.51), Fatima Jinnah Hospital, Quetta (risk ratio 1.31, 95% CI 1.10–1.55), Red Crescent Hospital, Hyderabad (risk ratio 1.58, 95% CI 1.21–2.06; Supplementary Table S2).
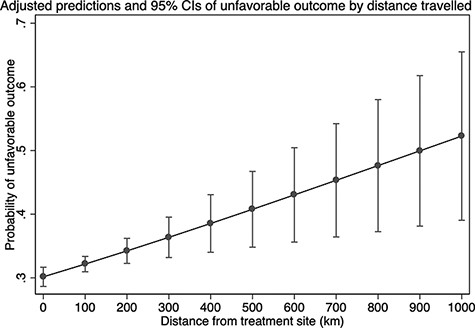
In the multivariate model of the association between distance to the treatment site and an unfavourable outcome, the adjusted risk ratio was 1.013 (95% CI 1.005–1.022) for every 20 km a patient needed to travel to reach their treatment facility, adjusted for age, sex, site of infection, exposure to second-line regimen, FQ resistance, year of enrolment, advanced disease at diagnosis (3+ smear-positivity and/or cavitation on chest x-ray) and treatment facility (Table 2). Typical travel distances (Figure 3) ranged between 0.1–911.5 km for people not living in the district centres (Table 1). The relationship between the predicted probability of an unfavourable treatment outcome and distance to the treatment facility is illustrated in Figure 4. The association between distance to the treatment facility and an unfavourable treatment outcome remained after restriction to patients who lived within 250 km of treatment facilities (Model 2: adjusted relative risk 1.015; 95% CI 1.000–1.030).
Crude and multivariable analysis for the association of driving distance and an unfavourable RR/MDR-TB treatment outcome
| Multivariable analysisa | ||||||||
|---|---|---|---|---|---|---|---|---|
| Crude analysis | Model 1: All patients (n = 5582) | Model 2: Restricted to patients who are resident within 250 km of treatment facility (n = 5271) | ||||||
| Distance to treatment facility | Crude risk ratio | 95% CI | Adjusted risk ratio | 95% CI | P-value | Adjusted risk ratio | 95% CI | P-value |
| Every 20 km | 1.017 | 1.009–1.026 | 1.013 | 1.005–1.022 | 0.001 | 1.015 | 1.000–1.030 | 0.040 |
Adjusted for age, sex, year of registration, FQ resistance, advanced disease at diagnosis (3+ smear-positive ± cavitation on chest x-ray), extrapulmonary or pulmonary disease, prior exposure to second-line regimen and treatment site.
Adjusted predictions and 95% CIs of unfavourable outcome by distance travelled
Discussion
We report findings from routine programmatic data collected on RR/MDR-TB patients from 2010 to 2017 in two of the largest provinces (Sindh and Balochistan) in Pakistan. Although the number of DR-TB treatment sites increased from 1 in 2010 to 11 in 2017, resulting in shorter travel distances for patients, overall treatment success rates decreased over time and the rate of lost to follow-up increased. Therefore, while expanding DR-TB services at a rapid rate may appear desirable, if not paired with a concurrent rise in high-quality community-based care close to where patients live or work, it may not improve the quality of clinical care and treatment outcomes. For the most vulnerable, the distance to care facilities may represent an insurmountable barrier (Thomas et al., 2016; Furin et al., 2020). Of note, patients and their treatment supporters (usually family members) only received a fixed rate of PKR 600 (less than USD 4) in travel allowance per follow-up visit. This is grossly insufficient, especially when larger distances are involved. Despite the perception that scaling up of services would decrease travel, patients continued to travel long distances (with a median distance of approximately 120 km for a round trip in peri-urban/rural areas) by the end of the expansion period.
Few studies have looked at the association of distance from treatment facilities on DR-TB treatment outcomes in Pakistan. Iqbal et al. found that distance to treatment sites was associated with unfavourable treatment outcomes, and our analysis replicates these findings (Iqbal et al., 2020). However, we assessed the driving distance from patient’s actual residence to the treatment facility rather than the region (areal unit), thereby minimizing the measurement error of the exposure.
With patients located so far from treatment facilities, the treatment coordinator’s role assumes even greater importance in the provision of high-quality DR-TB care (Lyakurwa et al., 2021). In our programme, we used trained treatment coordinators to monitor treatment supporters, perform contact tracing and track those lost to follow-up. However, as the programme expanded, the treatment coordinators were insufficient for the increasing number of patients; one coordinator often had to support several districts and as many as 250 DR-TB patients. In the absence of appropriate resources and a strategy aligned to local circumstances, expansion by itself creates barriers for health workers in the implementation of community activities (Vanleeuw et al., 2020).
Our study shows RR/MDR-TB patients residing in peri-urban or rural settings had a 29% higher risk of unfavourable outcomes compared with urban areas of Karachi. As the programme expanded facilities from urban areas to rural Sindh province, the distribution of patient characteristics in terms of area/type of residence, drug resistance profile and treatment history also changed. However, such changes were not accompanied by resources to address them. For example, while access to Xpert MTB/Rif testing expanded (albeit slowly), it was not adequately supported with resources for clinical monitoring (Supplementary Table S1). Several routine investigations to monitor people on second-line RR/MDR-TB drugs were often unavailable on site, leading to out-of-pocket expenses for vulnerable, poor DR-TB patients. Moreover, once patients were identified in hard-to-reach rural areas, there were logistical challenges identified in transporting sputum specimens for culture and drug-susceptibility testing.
Appropriate investment and time are needed to carefully design and implement decentralized, locally driven solutions that are balanced with appropriate access to resources for DR-TB care at each health administrative level (Scheffer et al., 2018). While the decentralization of services to all districts may appear unfeasible, it is in fact the perfect opportunity for innovation utilizing existing resources. Possible approaches may include e.g. implementing telemedicine and/or mobile vans, training and incentivizing district health staff on routine follow-up and TB-related queries, sharing care platforms with other diseases (e.g. diabetes and hepatitis C) and using couriers to deliver medications or to collect samples for testing (Gray et al., 2020). Moreover, operational research opportunities can help evaluate local solutions. Such opportunities can also support the need for mentorship and help develop local ownership.
While resources are essential, these alone cannot overcome issues with the centralized models of care we highlight (Lurie et al., 2021). We also need to emphasize patient-near care delivery as a core principle of disease control programmes, especially for infectious diseases such as DR-TB. This is an important opportunity to partner with civil society organizations in developing solutions and solving issues locally (De Vries et al., 2017). As one such opportunity, in Balochistan province in Pakistan, there are 34 districts served by two DR-TB treatment facilities centralized in two districts. However, at any given time, there are DR-TB patients in each of the other 32 districts unable to access care close to their homes. The use of telemedicine models for care delivery in such hard-to-reach areas should be explored. This also underscores the need for lessons learnt from implementing in such diverse populations so that issues leading to delays in diagnosis and access to newer, better treatments can be addressed before services are scaled up (Furin et al., 2016).
Shifting the overall programme strategy towards patient-near care delivery and community engagement is an important step towards universal health care (Alpert et al., 2020; Ehrenkranz et al., 2021). For example, a known barrier to identifying and treating all forms of paediatric TB (including DR-TB) is the lack of access to community-level services. Approaches such as creating a framework of trained health workers for integrated contact screening and TB preventive therapy can increase paediatric TB case detection (Zawedde-Muyanja et al., 2018). Such interventions may also help reduce any stigma by increasing access to care close to their homes (Craig et al., 2017). Another critical and neglected area that requires community-driven approaches and has yet to be integrated into routine DR-TB care is the need for palliative and end-of-life care support for DR-TB patients who have unfavourable treatment outcomes (Hughes and Snyman, 2018). Solutions through community engagement with representation from affected groups, health sectors and genders may also have several benefits to support end-of-life care and can ensure local, more compassionate and ethical solutions to prevent the transmission of highly resistant strains in the community.
Such approaches can benefit all health conditions and not just communicable diseases, including TB. Treatment for DR-TB requires a system capable of delivering integrated care—between medical subspecialties, laboratory and care delivery systems. Since many countries struggling with the spread of RR/MDR-TB have weak health systems, programmes have had to build platforms or pilot strategies to design a spectrum of integrated care for patients (Byrne et al., 2018; Calligaro et al., 2021). Such integrated practices can strengthen not only TB programmes but also the management of other infectious and chronic diseases (Geiger et al., 2021). Since patients with TB often suffer from other treatable conditions such as diabetes, HIV/AIDS and viral hepatitis, it helps tie together these conditions within a common approach, avoiding the pitfalls of vertical programmes. Importantly, this re-engages patients with locally available public health programmes, e.g. primary care and mental health programs.
Our study has several limitations: most notably the use of retrospective, routine programmatic data. Other unmeasured confounders over time included the change of standard of care for DR-TB treatment, variation in clinical monitoring across sites and socio-political factors that may have impacted routine care. Other factors in peri-urban/rural areas such as reduced access to basic health services, including TB care, poor infrastructure and utilities, may also contribute to unfavourable treatment outcomes as compared to urban areas (Sudha et al., 2003; Cambanis et al., 2005; Mushtaq et al., 2011). However, this was a large, diverse dataset, including both rural, peri-urban and urban populations. Few studies have looked at the association of distance from treatment facilities on DR-TB treatment outcomes in Pakistan.
Conclusion
Our findings suggest that extending DR-TB services through centralized hubs of care delivery likely increased unfavourable outcomes for people accessing care in peri-urban and rural districts. Unfortunately, in many low- and low-middle-income countries, national TB control programme priorities for the diagnosis and management of DR-TB are driven by centralized models that do little to push comprehensive care—the ability to diagnose and treat all forms of TB—out to the communities where people with TB disease and infection live and work. The provision of DR-TB care requires rethinking of the current model, which is heavily dependent on global financing led by the Global North, thus limiting local voices and solutions. Moreover, donor financing mechanisms perpetuate this situation and impede the inclusion of communities in decision-making (Khan et al., 2018). It has taken the COVID-19 pandemic, also caused by a respiratory pathogen, to reassert the critical importance of flexible, timely, context-specific solutions and the value of expanding diagnostic and treatment capabilities in the communities where people live and work (Sigfrid et al., 2020). Locating services closer to the community can increase case detection, prevent DR-TB transmission and enhance community engagement (Ardizzoni et al., 2015; Mbuthia et al., 2018). Thus, we advocate for decentralized services for DR-TB that are locally accessible and integrated with local processes, reducing overall costs to both health providers and patients to improve treatment outcomes (Ho et al., 2017). Thus, the local ecology of healthcare will be strongly supported and sustained to the benefit of all health conditions.
Supplementary data
Supplementary data are available at Health Policy and Planning online.
Data availability
The data underlying this article are available in the article and in its online supplementary material.
Funding
None declared.
Acknowledgements
The authors would like to thank all implementing local partners, the National TB Program and the Provincial TB Program of Sindh and Balochistan Provinces.
Author contributions
Conception or design of the work: UK, PYK
Data collection: UK, ILF, AA, SK, AP, S Adnan, S Ahmed, MC, PYK
Data analysis and interpretation: UK, ILF, AA, PYK
Drafting the article: UK, ILF, AA, PYK
Critical revision of the article: All authors
Final approval of the version to be submitted: All authors
Ethical approval
Ethical approval for this research was waived by the authors’ institute (Interactive Research & Development) institutional review board. Reference No: IRD_IRB_2021_05_012.
Conflict of interest statement
All authors declare they have no competing interests.
Reflexivity statement
As a low- and middle-income country, with the fourth highest MDR/RR-TB incidence worldwide, the Pakistan Ministry of Health declared TB as a national emergency in 2001, with case notification of MDR/RR-TB cases a key performance indicator. Our manuscript thus addresses research and policy priorities in Pakistan. This study has been conceptualized, designed and implemented entirely by a fully local team of TB-infectious disease clinicians, epidemiologists, laboratory scientists and public sector experts living or working in Pakistan. Thirteen out of the 21 (62%) authors on this paper are Pakistani female researchers and clinicians. Most of the authors (70%) are early career researchers who have benefited through mentorship by senior colleagues in this study.
