


Abstract
There has been limited information on spatial accessibility to healthcare in Multi-island Micro States (MIMS). This is partly due to the application of methodologies that do not sufficiently consider the dynamic or unique characteristics of MIMS. The objective of the paper is to evaluate the performance of different Geographic Information Systems (GIS) methodologies for quantifying spatial accessibility to public healthcare in Multi-island States (MIMS). Spatial accessibility was measured using three GIS-based methodologies: Temporally Available Two-Step Floating Catchment Area (TA2SFCA) and traditional models [Two-Step Floating Catchment Area (2SFCA) and the Gravity Model]. Unlike the Gravity Model and the 2SFCA which only used population and health facilities locations along with travel times to quantify spatial accessibility, the TA2SFCA also included information on the hours of operations and health schedules in its assessment. These additional variables were used to develop the time windows to assess differences in capacity among available service sites. TA2SFCA results showed that spatial accessibility was linked to a ‘traveling doctor’ dynamic with access to healthcare services reflecting changes in the supply of services. As such, the Gravity Model and 2SFCA which did not account for this peculiarity were inadequate for measuring spatial accessibility in MIMS. The TA2SFCA addressed both the temporal and spatial aspects of health which were most reflective of the health system of these islands. Given the spatial-temporal dynamics, improving accessibility to healthcare requires periodic assessments and reassessments of health service delivery since this is affected by operating times and changes in capacity. Furthermore, there is the need for more research to develop methodologies that are more reflective or sensitive to MIMS dynamics.
Introduction
A major limitation in designing effective and efficient healthcare systems for Multi-island Micro States (MIMS) is the paucity of information and research on the unique characteristics which define their socio-economic space and environment. The term ‘multi-island’ refers to island countries with several island dependents, operating as one national entity whether economically or politically. Access to healthcare is arguably more severe in MIMS where the healthcare finances and resources have to extend to several island dependents. Tremblay (2012, p. 3) highlighted ‘these island states are in many cases separated from other islands and in the case of archipelagos, internally from other parts of the country, and often over great distances. Some others are physically in two (or more) unconnected geographical locations and separated by another county’.
Spatial accessibility in healthcare provides critical linkages in two related areas: the proximity of services relative to the population and volume of services relative to the population which is important in identifying healthcare delivery problems particularly in rural areas. That is, it examines both the availability and accessibility of health services—which describes the complex relationship between the spatial separation of the population and the supply of healthcare facilities which has a strong geographic component. According to Higgs (2004), the choice of method in spatial analysis should not be ad hoc but instead dependent on service(s) under consideration and ‘…differing assumptions concerning travel behavior(s).’ This ‘…complex relationship between spatial separation of population and healthcare supply’ is linked to the demand and supply factors (Jacobs et al., 2012). Parker and Campbell (1998, p. 184) noted that, when analyzing health needs and the behaviours of patients, ‘…much of the information needed has an inherently spatial component’. As such, access to healthcare varies across space, which is a function of supply (healthcare professionals) and demand factors (residence of the population), none of which is ‘…uniformly distributed’ (Luo and Wang, 2003, p. 865).
Measuring spatial accessibility to healthcare is therefore critical in identifying whether healthcare is provided in an equitable manner within and between countries and communities. According to Zhu et al. (2019), in the quest to achieve universal health coverage spatial equity is a critical component. Spatial equity is defined as the,
Degree to which services, or amenities are distributed in an equal way over different areas as well as economic and political groups, with appropriate consideration given to the needs of special groups such as children and elderly. (Omer, 2006, pp. 254–255)
As posited by Talen and Anselin (1998), spatial equity is important in ensuring equal access to public services and in determining whether the distribution of services coincides adequately with the socio-economic spatial patterns which exist. The extent of inequalities in healthcare access is, therefore, a function of the,
Unique spatial arrangements of the healthcare delivery systems, the location and distribution of the population within a region, and the characteristics of the transportation infrastructure. (Delamater et al., 2012, p. 15)
However, accurately measuring spatial accessibility is a problematic issue since there is no single identified way to access healthcare. In many countries, although catchments are defined, persons are free to access care anywhere by virtue of healthcare being provided free at the point of delivery which is typical of countries in the Caribbean region. The use of Geographic Information Systems (GIS)-based methodologies such as provider to population ratios (PPRs), Gravity Model (Joseph and Bantock, 1982), Two-Step Floating Catchment Area (2SFCA) (Radke and Mu, 2000; Luo and Wang, 2003), Enhanced 2SFCA (E2SFCA) (Luo and Qi, 2009) and 3SFCA (Wan et al., 2012) allows for environmental factors to be considered when examining spatial accessibility to healthcare, that is, the examination of access patterns—disaggregated by service utilization and accounting for the dynamics of various community attributes (Glass, 1991; Nicol, 1991; Dunn and Newton, 1992; Curtis and Taket, 1989; Kivell and Mason, 1992). These methodologies have been used in many studies to identify under-serviced regions (Dulin et al., 2010) or Health Professional Shortage Areas (HPSAs). However, many of these methods have been critiqued for their inability to account for spatial variations and having the assumption of equal access across communities.
In 2018, the development of the Temporally Available Two-Step Floating Catchment Area (TA2SFCA) by Paul and Edwards addressed the limitations of these previous methods along with considerations for the temporal dynamics which is prevalent in unique spaces and context. While the application of this methodology can be extended to single countries and social spaces with barriers to access other than the sea, in this study it was applied to a Caribbean country much like the one in Paul and Edwards (2018) study.
In this light, the objective of the paper is to evaluate the performance of different GIS methodologies for quantifying spatial accessibility to public healthcare in the Multi-Island States (MIMS).
Methodology
The study was conducted in the islands of Carriacou and Petite Martinique, island dependents of the Caribbean island of Grenada, during 2015–2019 encompassing data collection for empirical analysis. The islands are part of the tri-island state of Grenada (12.1165°N, 61.6790°W), which is the most Southern of the Windward Islands, lying between two other MIMS, namely: Trinidad and Tobago (10.6918°N, 61.2225°W) and Saint Vincent and the Grenadines (12.9843°N, 61.2872°W) (Figure 1). While the two islands are mainly considered rural, the urban pocket via the main town is found on the island of Carriacou. Traditionally, these two islands are considered a seventh parish of mainland Grenada accounting for approximately 5% of the tri-island population (5633 persons).
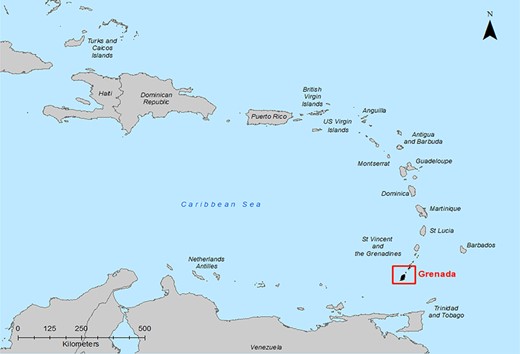
Location of Grenada in the Caribbean
Specifying demand and supply data required for measuring spatial accessibility
Demand, supply and distance data were used to quantify spatial accessibility to healthcare in the island dependents of Carriacou and Petite Martinique: location of the population, location of health facilities and travel time, which represents the spatial separation the users must overcome to access health services. In the absence of geographic coordinates for each household, population-weighted centroids were used to represent population demand origins. Locations of the public health facilities within the study area were collected using Global Positioning System (GPS) coordinates. The main attributes used for the facilities were location, services offered through health schedules, presence of physicians and hours of operations which were collected via a facility-based survey to all facilities on both islands. This was supplemented by general utilization data and population composition information provided by the Ministry of Health and Central Statistics Office, respectively.
Data on road transportation infrastructure (road network) and associated speed limits were obtained from Open Street Maps and built using ArcMap 10.6. This was used to measure travel distance and travel time between healthcare facilities and the local communities. A network dataset was then developed to measure the travel time and travel distance between the healthcare facilities and the location of the local residents. A 10-min travel time catchment was generated using the estimated 3-mile radius between population point and health facility (Ministry of Health (MoH), Grenada. 2015; Hatt et al., 2012). This catchment was deemed appropriate for the size of the study area since it captured at least one facility within the estimated 10 min travel time. All datasets reflecting demand and supply were geocoded, organized into a geodatabase, and integrated into a GIS. ArcGIS Pro version 2.3 was used to geo-process and analyze data to derive the outputs needed for evaluating spatial accessibility. Spatial distribution for each GIS-based methodology was visualized using maps that reflected the spatial and/or temporal dynamics of the island dependents of Carriacou and Petite Martinique.
Data on the location of the population, location of health facilities, the layout of the transportation system and travel times were used to rank facilities based on proximity to each enumeration district (ED) and the number of facilities that could be accessed by each ED. This destination rank provided information on the facilities closest to each ED within the recommended 3 mile radial proximity (10-min catchment).
GIS analysis/methods
GIS-based methodologies [TA2SFCA, Gravity Model and two-step floating catchment area (2SFCA)] (Paul and Edwards, 2018; Joseph and Bantock, 1982; Radke and Mu, 2000) were used to evaluate spatial accessibility to primary healthcare in Carriacou and Petite Martinique and the results compared. This comparison was deemed necessary to highlight the importance of considering the context or environment in which these methodologies are applied. This was particularly important since in the study area there is a temporal dynamic that is not accounted for by the Gravity Model and the 2SFCA. As such, with the TA2SFCA two dimensions of accessibility are addressed, the temporal (accessibility within a 24-h time window) and spatial (location of health facilities in relation to the location of potential users) dimensions. Python script developed by Paul,1 and Edwards (2018) which consisted of the formulas of all GIS methodologies used in the study was modified to incorporate differences in health schedule, services to be analysed and travel dynamics of the study area.
Gravity model
Where
|$A_i^G$| = spatial accessibility score from population point i (population centroid) for the census tract
Sj = service capacity at facility j
d = travel distance or time, between i and j (population centroid and health facility)
β = gravity decay coefficient, represents the change in difficulty of travel time or distance change.
Vj= factor that accounts for population demand.
Where
Pk = population size at point k, which is the centroid of the census tract
d = travel distance or time, between k and j (population centroid and health facility)
β = gravity decay coefficient
β ranging from 0.1 to 4 with intervals of 0.1 and 0.5 was tested and accessibility scores were generated. The values of the spatial accessibility scores were tested using the Moran’s I statistics for randomness in their distribution. Significantly positive Moran’s I values indicated spatial clustering or similar values, whereas significantly negative Moran’s I values indicated dispersion or dissimilar values. This approach was seen as a way of avoiding the arbitrary use of by Talen and Anselin (1998, p. 600), which according to the authors represents a ‘…common practice and it constitutes a valid use of the index for comparison purposes’.
Two-step floating catchment area
Where;
Rj = provider to population ratio for each catchment centered at each service point
Sj = number of physicians at facility j
Pk = population at location k whose centroid falls within the catchment of facility j (dkj ≤ dmax)
dkj = distance between population at location k and facility j
dmax = threshold travel time/catchment
Where;
Ai = accessibility of a population at location i to physicians
Rj = physician to population ratio at physician location j
The scores obtained represented the spatial accessibility scores for the various geographic locations.
Temporally available two-step floating catchment area (TA2SFCA)
Where;
Cj = capacity or attractiveness to health provider j
dij = travel time between population point i and provider j
dis = travel time between i and other health providers (s) within the catchment D0
G = continuous Gaussian function
Where;
Rj = Provider-to-population ratio
Cj = capacity or attractiveness to health provider j
dij = travel time between population point i and provider j
d0 = catchment of provider j
Gij = continuous Gaussian function between population point i and provider j
Pk = population size at k
Ti = time window under assessment
Where;
Ai = accessibility score at location i
Rj = physician to population ratio at location j
Results and discussion
Supply profile Carriacou and Petite Martinique
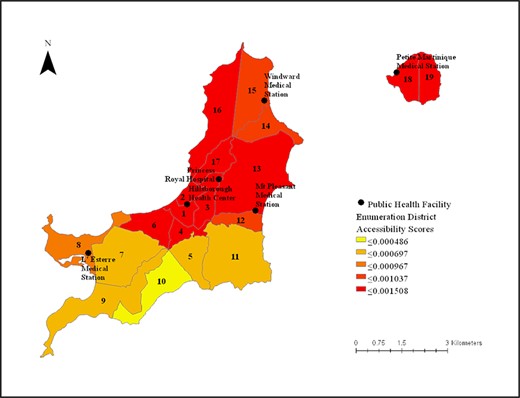
In the islands of Carriacou and Petite Martinique, community and hospital services are offered through six public health facilities; one district hospital, one health centre and four medical stations (Figure 2). The services offered at community facilities (health centre and medical stations) mainly included primary care examinations, outpatient care, maternity care excluding childbirth and CNCDs with limited secondary care services offered via the district hospital and specialized services at the health centre.
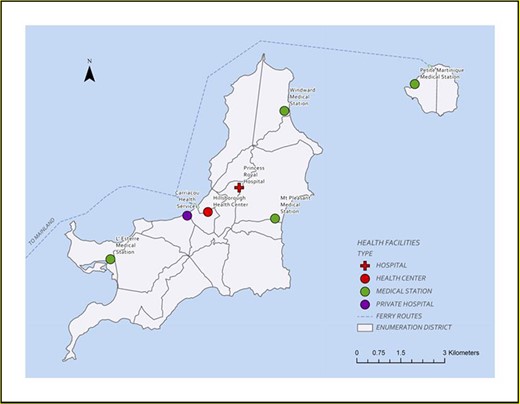
Location of health facilities in relation to Enumeration Districts Carriacou and Petite Martinique and Ferry Route between the islands
Challenges identified with the operations of these facilities were related to the procurement and availability of medical equipment, supplies in healthcare delivery and limited operating hours (limited after-hours operations weekdays and weekends). A major limitation in the delivery of healthcare is the absence of a permanently stationed medical doctor(s) and pharmacist at these facilities with the exception of the district hospital. In this multi-island dynamics, what is evident are ‘doctor days’ which gives rise to a ‘travelling doctor dynamic’. Diagnostic services are not available on both islands and as such all diagnostic services are conducted on the mainland of Grenada. Access to healthcare services and facilities can be impacted by the fact that there is separation by water between the mainland and the two island dependents in which the main mode of access between the islands is via sea (Figure 2).
While the catchment of each facility was defined and known by communities it was highlighted that it is typical to attend to persons from outside the catchment and even from neighbouring islands. On the island of Carriacou, 47% of all households had access to all five facilities on the island however households on Petite Martinique have access to only one facility within its catchment (Table 1). In some instances, based on the destination rank, some communities had greater choices due to proximity while other Enumeration Districts (EDs) were faced with longer travel times to the closest facility (Table 2). This location-population dynamic may explain the provision of secondary care services on the island which was conducted mainly through the Hillsborough Health Centre (HHC) which in some sense operated as a hospital with the exception of inpatient service.
Number of facilities accessed by each ED
| ED number | ED reference number | Number of households | Island | Number of facilities communities can access within the catchment |
|---|---|---|---|---|
| 1000 | 1 | 289 | Carriacou | 5 |
| 2000 | 2 | 280 | Carriacou | 5 |
| 3000 | 3 | 114 | Carriacou | 5 |
| 4010 | 4 | 222 | Carriacou | 5 |
| 4020 | 5 | 228 | Carriacou | 3 |
| 5000 | 6 | 334 | Carriacou | 5 |
| 6000 | 7 | 677 | Carriacou | 3 |
| 7000 | 8 | 307 | Carriacou | 4 |
| 8000 | 9 | 365 | Carriacou | 3 |
| 9000 | 10 | 235 | Carriacou | 2 |
| 10 000 | 11 | 336 | Carriacou | 3 |
| 11 000 | 12 | 99 | Carriacou | 4 |
| 12 000 | 13 | 302 | Carriacou | 5 |
| 13 000 | 14 | 331 | Carriacou | 4 |
| 14 000 | 15 | 464 | Carriacou | 4 |
| 15 000 | 16 | 263 | Carriacou | 5 |
| 16 000 | 17 | 124 | Carriacou | 5 |
| 17 010 | 18 | 391 | Petite Martinique | 1 |
| 17 020 | 19 | 272 | Petite Martinique | 1 |
Note: ED reference number is used throughout research in most areas for ease of reference.
Destination rank of facilities Carriacou and Petite Martinique
| ED number | Population of ED | Island | Travel time to closest facility (minutes) | Closest facility | Travel time to second closest facility (minutes) | Second closest facility |
|---|---|---|---|---|---|---|
| 1 | 289 | Carriacou | 0.51 | Hillsborough Health Centre | 3.57 | Princess Royal Hospital |
| 2 | 280 | Carriacou | 0.45 | Hillsborough Health Centre | 2.91 | Princess Royal Hospital |
| 3 | 114 | Carriacou | 1.07 | Hillsborough Health Centre | 2.86 | Princess Royal Hospital |
| 4 | 222 | Carriacou | 2.13 | Hillsborough Health Centre | 4.28 | L’ Esterre Medical Station |
| 5 | 228 | Carriacou | 4.08 | Princess Royal Hospital | 4.34 | Mt Pleasant Medical Station |
| 6 | 334 | Carriacou | 2.38 | Hillsborough Health Centre | 3.29 | L’ Esterre Medical Station |
| 7 | 677 | Carriacou | 1.56 | L’ Esterre Medical Station | 6.39 | Hillsborough Health Centre |
| 8 | 307 | Carriacou | 0.72 | L’ Esterre Medical Station | 5.02 | Hillsborough Health Centre |
| 9 | 365 | Carriacou | 3.08 | L’ Esterre Medical Station | 7.38 | Hillsborough Health Centre |
| 10 | 235 | Carriacou | 3.65 | L’ Esterre Medical Station | 7.65 | Hillsborough Health Centre |
| 11 | 336 | Carriacou | 4.06 | Princess Royal Hospital | 4.11 | Mt Pleasant Medical Station |
| 12 | 99 | Carriacou | 1.08 | Mt Pleasant Medical Station | 4.2 | Princess Royal Hospital |
| 13 | 302 | Carriacou | 2.18 | Mt Pleasant Medical Station | 2.24 | Princess Royal Hospital |
| 14 | 331 | Carriacou | 1.7 | Windward Medical Station | 4.78 | Princess Royal Hospital |
| 15 | 464 | Carriacou | 0.95 | Windward Medical Station | 6.9 | Princess Royal Hospital |
| 16 | 263 | Carriacou | 2.9 | Hillsborough Health Centre | 3.76 | Princess Royal Hospital |
| 17 | 124 | Carriacou | 3.06 | Hillsborough Health Centre | 3.92 | Princess Royal Hospital |
| 18 | 391 | Petite Martinique | 0.8 | Petite Martinique Medical Station | NAa | NA |
| 19 | 272 | Petite Martinique | 1.55 | Petite Martinique Medical Station | NA | NA |
This facility is located on the smaller of the two island dependents. Therefore, the second closest facility will be on the other island dependent.
The results of the destination ranks may provide an explanation for the utilization patterns observed on these islands which showed that over a 7-year period, the HHC and the L’Esterre Medical station recorded higher levels of utilization than even the PRH (Figure 3). This pattern may be indicative of the need to review the operations of these facilities, particularly that of the L’Esterre Medical station in terms of its service volume and delivery.
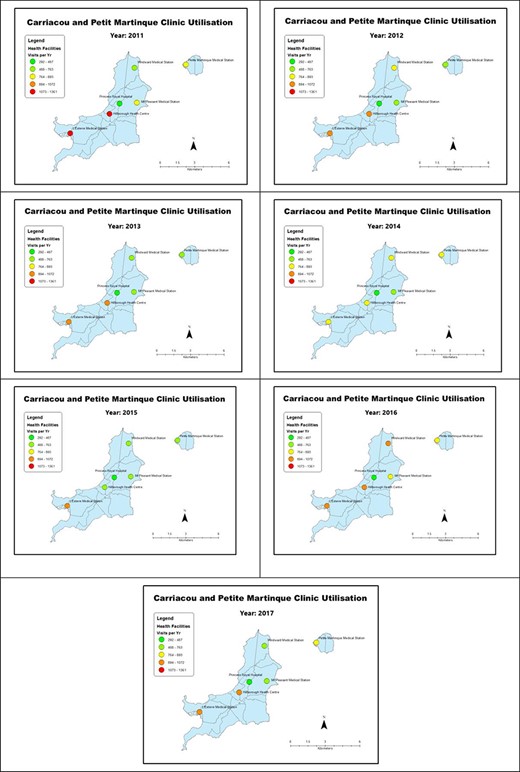
Utilization patterns for Carriacou and Petite Martinique (2012–2017)
The resulting destination ranking may change between methods based on how distance decay is modelled, that is, based on the distance decay function used by each method. The choice of distance decay function is critical as it models the difficulty that users experience when moving between demand and supply locations. The choice of a continuous distance decay function in this study seems to be supported by the utilization information captured as the facilities with higher destination rankings are also facilities with higher utilization.
Gravity model
Results of the Gravity Model showed there were two categories of impedance coefficients (0–1 and 1–4), which resulted in different spatial measures. Spatial measures resulting from the use of impedance coefficients ranging from 0 to 1 showed evidence of spatial autocorrelation whereas the use of impedance coefficients ranging from 1 to 4 showed no evidence of spatial autocorrelation (Supplemental Information B). The Moran’s I values for the coefficients tested for each ED clustered with low β coefficients (0.1–0.9). However, a random spatial distribution was observed with higher β coefficients (1–4). This indicated that beta values of <1 were more reflective of the dynamic present in these two island dependents due to their small size. As such the arbitrary use of β = 2 (Talen and Anselin, 1998) may not be suitable for all contexts and therefore there is merit in testing this before conducting analysis. Bands of similarities existed amongst accessibility scores for the beta values 0.1–0.4, 0.5 and 0.6, 0.7 and 0.8, and 0.9. Representatives scores associated with these band clusters were chosen to display the results. For the chosen beta values 0.1, 0.5 and 0.9, Table 3 presents the population demand at each service location, which is based on the number of communities within the catchment and the population of these communities.
Population demand at each service location (gravity method)
| Island | Health facility | Population demand beta = 0.1 | Population demand beta = 0.5 | Population demand beta = 0.9 | Number of communities in catchment |
|---|---|---|---|---|---|
| Carriacou | Mt Pleasant Medical Station | 3126 | 1637 | 899 | 14 |
| Carriacou | Windward Medical Station | 2456 | 1514 | 1062 | 11 |
| Carriacou | L’Esterre Medical Station | 3119 | 2054 | 1495 | 12 |
| Carriacou | Hillsborough Health Centre | 4365 | 2854 | 2259 | 17 |
| Carriacou | Princess Royal Hospital | 4032 | 2154 | 1185 | 16 |
| Petite Martinique | Petite Martinique Medical Station | 660 | 654 | 659 | 2 |
Results indicated that for facilities on the island of Carriacou, as β increased population demand on all health facilities decreased. This means there were fewer opportunities for persons far away and as such persons utilized facilities closest to them. In Petite Martinique, as β increased population demand increased due to the availability of one facility on the island. Additionally, as the β increased, population demand was consistently greatest at the HHC and Princess Royal District (PRH) Hospital, the facilities with the most services, presence of a doctor and serving both islands. Figure 4 illustrates the changes in the spatial accessibility distribution to primary healthcare in the islands of Carriacou and Petite Martinique for each of the chosen distance coefficients in the Gravity Model.
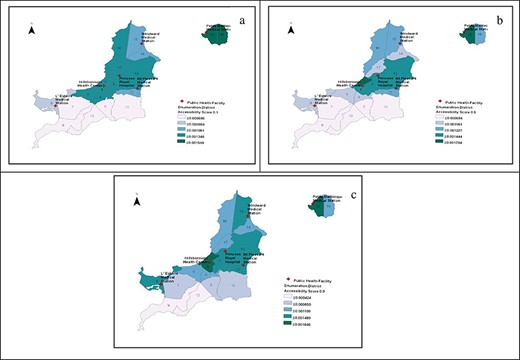
Spatial patterns for Carriacou and Petite Martinique using gravity model, (a) β = 0.1, (b) β = 0.5 and (c) β = 0.9
For β = 0.1, the island of Petite Martinique had the highest level of spatial accessibility whilst on Carriacou there were variations in spatial accessibility scores. At least 29% of the EDs recorded the lowest spatial accessibility scores. EDs in close proximity to the HHC, PRH and Mt Pleasant had high scores, which may be due to the number of facilities within the vicinity. As the beta increased, the dynamic with the spatial accessibility scores changed with increases in scores in some EDs and decreases in others. For example, in PM, as the beta increased the accessibility score for ED 19 decreased whilst ED 18 remained the same. For EDs without facilities, e.g. ED 19 the decreased accessibility score, indicated an unwillingness of persons to travel longer distances. This behaviour was expected and essentially indicated increased access to primary care for those EDs with health facilities.
Two-step floating catchment area (2SFCA)
Unlike the Gravity Model, the 2SFCA does not include the use of the beta or distance decay coefficient. Figure 5 highlights the spatial distribution for the islands of Carriacou and Petite Martinique with the use of the 2SFCA method.
Spatial patterns for Carriacou and Petite Martinique using 2SFCA
The results of the 2SFCA showed that most EDs on the islands of Carriacou and Petite Martinique have relatively high spatial accessibility scores with the exception of ED 10 with the lowest score. Similar to the Gravity Model, EDs to the southern part of Carriacou, had lower accessibility scores than other EDs on the island. In the case of Carriacou, population demand is greatest at the HHC followed by the PRH and Mt Pleasant Medical Station, which are all in close proximity to each other. The L’Esterre medical station, which is located in ED 8, had a population demand similar to that of Mt Pleasant medical station (Table 4). This may be due in part to its location which captures a larger catchment than the other facilities.
Population demand at service location for the 2SFCA
| Health facility | Population demand |
|---|---|
| Mt Pleasant Medical Station | 3696 |
| Windward Medical Station | 2824 |
| L’Esterre Medical Station | 3513 |
| Hillsborough Health Centre | 4972 |
| Princess Royal Hospital | 4738 |
| Petite Martinique Medical Station | 663 |
| Health facility | Population demand |
|---|---|
| Mt Pleasant Medical Station | 3696 |
| Windward Medical Station | 2824 |
| L’Esterre Medical Station | 3513 |
| Hillsborough Health Centre | 4972 |
| Princess Royal Hospital | 4738 |
| Petite Martinique Medical Station | 663 |
As with the Gravity Model, temporal constraints were not accounted for in the 2SFCA method. Ignoring the temporal dynamic lead to results that were not reflective of reality. For example, in the case of Petite Martinique, under-served areas may be hidden. Moreover, for communities outside the catchment, it was assumed users have no access and as such cross-bordering is not considered. Methodologically, while the use of the Gravity Model and the 2SFCA are useful in identifying and analyzing availability in healthcare, their additional limitations stem from the assumptions that persons will visit the facility closest to them (Vo et al., 2015). Moreover, equal access to physicians within the same region is also assumed.
Temporally available two-step floating catchment area (TA2SFCA)
Given the temporal constraints present in the health system delivery in these two islands, the TA2SFCA by Paul and Edwards (2018) was most reflective of this dynamic. Due to the remote locations and changes in the health schedule of these island dependents, there are challenges concerning the provision of health resources and services. With the changes in the health schedules, persons are forced to make different choices based on what is available. Without the inclusion of the temporal dynamic, changes in supply that are inherently critical to the islands are ignored and areas of relatively poor access are not identified.
The TA2SFCA used information on the hours of operations and health schedules to develop the time windows for consideration (Supplemental Information C). Establishing a time window is critical to this method since it considers differences in capacity among available service sites. The time windows consisted of days of the week, weeks of the month and the hours of operation: Weekdays (8AM TO 4PM) (AFTER 4PM), Saturdays (8AM TO NOON) (NOON AND BEYOND) and Sundays. This allowed for a more accurate depiction of availability within the context of these island dependents. Figure 6 presents the results of the spatial distribution of the two islands from the TA2SFCA, which considered temporal constraints as is reflective of the ‘traveling doctor dynamic’ in which the supply of physicians varied by days of the week due to health schedule-and location of the doctor. For the island of Petite Martinique, there was no access to a doctor most days of the week with the exception of Wednesdays (doctor day). This dynamic was similar for ED10 on the island of Carriacou with no access for at least 4 days of the week.
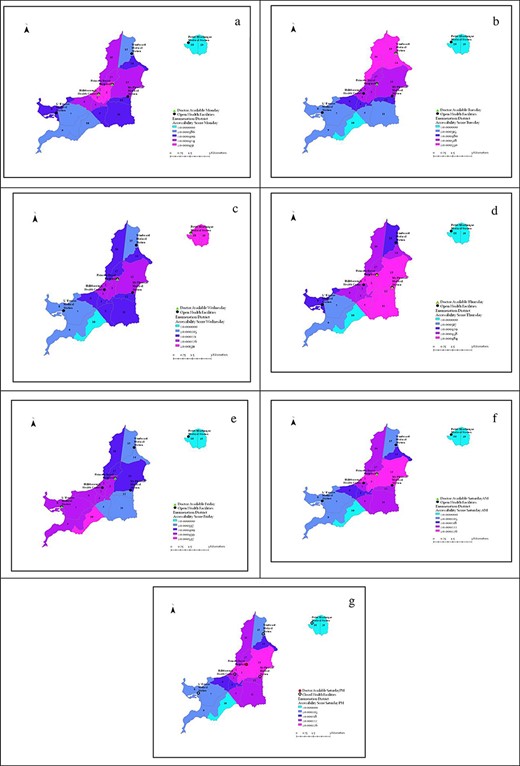
Spatial distribution for Carriacou and PM using the TA2SFCA by days of the week—(a) Mondays, (b) Tuesdays, (c) Wednesdays, (d) Thursdays, (e) Fridays, (f) Saturdays AM, (g) Saturdays PM
Similar to the results by Paul and Edwards (2018), the use of the TA2SFCA reflected competition amongst health facilities and allowed for a better depiction of accessibility in certain areas through the use of the health schedules. As such, in this context without considering the temporal dynamic, accessibility scores will be over-estimated for some days of the week and some EDs. This method showed at least 1 day in which communities have access to a doctor. Similar results were reported by Paul and Edwards (2018) however in their study there were usually three or four facilities with a physician on any given day. Given the social space of these islands, the use of the TA2SFCA showed that there was no day for the week in which all communities had adequate access to a doctor. In the study by Paul and Edwards (2018) by contrast, their analysis showed that there was only 1 day in Week 1 where all communities have adequate access to a general practitioner.
Generally, for the EDs closer to the District hospital, the accessibility scores tended to be higher. The dynamic presented for Saturday evenings, in which all facilities are closed, with the exception of the PRH, is reflective of the time window after 4pm weekdays, Sundays and public holidays. In cases where all facilities were closed2, accessibility was better for the EDs closest to the District hospital since this was the only open facility and had a doctor present. Table 5 presents the population demand for each facility, which is reflective of the defined catchment and the temporal dynamic.
Population demand by facility by days of the week using TA2SFCA method
| Health facility | Monday | Tuesday | Wednesday | Thursday | Friday | Saturday | Saturday PM |
|---|---|---|---|---|---|---|---|
| Mt Pleasant Medical Station | 0 | 0 | 0 | 2016.45 | 0 | 0 | 0 |
| Windward Medical Station | 0 | 1551.34 | 0 | 0 | 0 | 0 | 0 |
| L’Esterre Medical Station | 0 | 0 | 0 | 0 | 2188.28 | 0 | 0 |
| Hillsborough Health Centre | 2957.58 | 0 | 0 | 0 | 0 | 0 | 0 |
| Princess Royal Hospital | 2628.69 | 3693.93 | 5294.17 | 3207.6 | 3453.51 | 5294.17 | 5294.17 |
| Petite Martinique Medical Station | 0 | 0 | 801.524 | 0 | 0 | 0 | 0 |
Population demand on all days of the week, with the exception of the doctor days, was estimated as zero since the analysis defined capacity as only the number of physicians present at a facility. This finding suggests the need to re-define capacity to include nurses who in this context may be providing greater services. While the presence of a doctor was deemed important in seeking care by persons in the study area, the capacity of nurses particularly in this multi-island context may be critical in seeking care and should be considered. With the exception of Wednesdays when the doctor is on the island of Petite Martinique and weekends, population demand is shared between PRH and whichever facility the doctor is operating from. In the case of Wednesday, the only facility with a doctor present on Carriacou is the PRH, therefore population demand will be highest at this facility. Additionally, this population demand is reflective of only those populations that fall within the 10-min catchment of the health facilities.
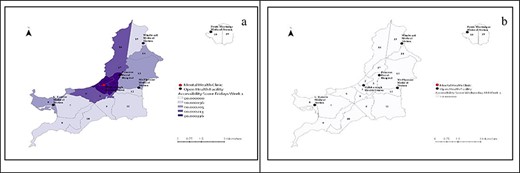
While the PRH and HHC are mandated to serve both islands, these facilities fall outside of the designated catchment for persons on the island of PM, resulting in low accessibility scores for this island. It may be argued that increasing the catchment to 30 min may produce better accessibility scores. However, in this dynamic, it will result in capturing utilization/population demand from another country (the Grenadine islands island dependents of Saint Vincent), which lie in closer proximity to Carriacou and PM (Figure 7). This creates additional demand on existing health capacity. However, there is limited empirical evidence of the magnitude of this. Therefore, the spatial configuration of these two countries is critical since they are both MIMS However, this fact leads to additional research avenues as it highlights cross-bordering issues which may require a collaborative approach between the two countries in addressing these barriers caused by spatial proximity.
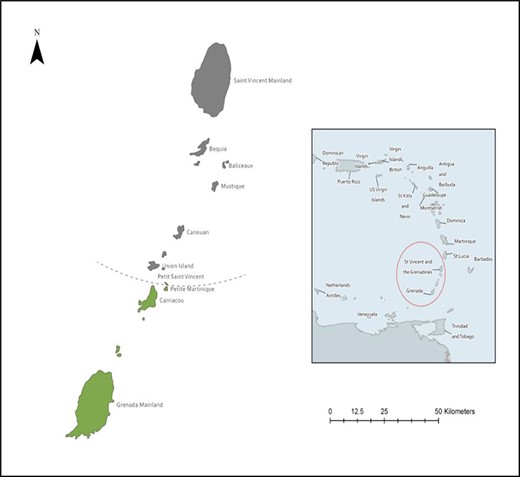
Proximity to Saint Vincent and the Grenadines
Across these methods, population demand at the HHC was observed to be greater than at the PRH. This may be due to its location—urban pocket and it is the only facility in which specialized services are offered. These services included gynaecology/obstetrics, dermatology, mental health clinic and chronic disease clinics. All other specialized services are provided mainly in the General Hospital located on the mainland Grenada.
TA2SFCA—specialized services
On these islands, dependents specialized health services are limited (dermatology, obstetrics/gynaecology, chronic disease clinic, mental health clinic) and conducted at scheduled times by doctors visiting from mainland Grenada, community doctor on island or senior nurses called matrons. These services are offered at pre-determined times and as such the results of the availability of specialized services also showed a temporal dynamic.
Obstetrics/Gynaecology
Obstetrics/Gynaecology was offered once a month—last Friday of every month at the HHC.3 In the absence of this service, persons requiring this specialized service would have to access this on the mainland of Grenada. Figure 8 shows the spatial patterns for Obstetrics/Gynaecology on the ‘doctor day’ (A) and all other days for the month (B). Improvements in access were observed in Carriacou on the ‘doctor day’, however on the island of Petite Martinique accessibility scores remained the same throughout the month. Due to the absence of technical expertise in this area on the island of Petite Martinique and the potential for complications, pregnant persons are advised to leave the island of Petite Martinique by the seventh month of pregnancy since the available facility is not equipped to handle emergencies or complications related to pregnancy.
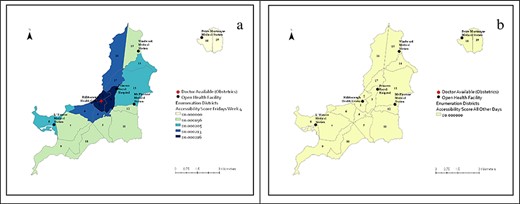
Spatial patterns obstetrics/gynaecology in Carriacou and Petite Martinique, (a) last Friday of month, (b) all other days
Chronic disease clinic
During a given month, the Chronic Disease clinic was offered at three facilities on the islands and at different times: HHC, every Tuesday in the month; Windward medical station, every second Thursday; and Petite Martinique, the third Monday in every month (Figure 9). The only day in which this service was consistently provided was on Tuesdays at the HHC. The presence of this clinic is indicative of its importance in relation to other similar clinics since chronic diseases are the most prevalent causes of death in the Caribbean, Grenada being no exception. However, for the island of PM, accessibility scores for the chronic disease clinic were zero, with the exception of the day that this clinic was on the island. These clinics are conducted by senior nurses called Matrons and involve the provision of chronic disease management services.
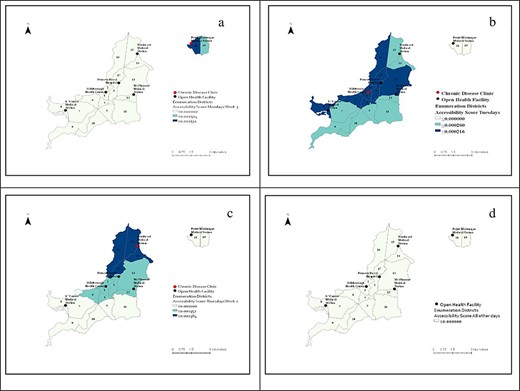
Spatial patterns chronic disease clinic Carriacou and Petite Martinique—(a) Mondays (week 3), (b) Tuesdays, (c) Thursdays (week 2), (d) all other days
Mental health clinic
The mental health clinic was offered once per month—every first Friday of the month at the HHC by a visiting specialist from mainland Grenada. Figure 10 presents the spatial dynamic for the mental health clinic for the islands. For this clinic, accessibility was better for those communities, which were closer to the facility where the clinic was offered. However, for the island of Petite Martinique, accessibility to this service remained zero throughout the month.
Spatial patterns mental health clinic Carriacou and Petite Martinique—(a) Fridays week 1, (b) all other days
Generally, for specialized services, accessibility was better for the communities closer to where the services were offered. In most instances, persons in Petite Martinique faced longer travel times and had lower accessibility scores because most specialized services were offered in Carriacou. In the case where these services were not offered on both islands, persons would have to travel to Grenada, the mainland to access these services.
It should be noted that the structure of the health schedules has not changed which is in part due to limitations in capacity and resources that are prevalent in these Small Island Developing States (SIDS). However, changes in capacity (±) will affect the accessibility scores of the models. In the case of TA2SFCA, changes in capacity or the health schedules will affect the accessibility scores. With more permanent capacity, the application of the TA2SFCA may diminish with time which brings to fore the need to apply methodologies based on the dynamic or the social space and environment.
Numerous research has pointed to the distinct differences between health, health access and outcomes in rural versus urban communities (Comer and Mueller, 1995; Weisgrau, 1995; Hartley, 2004; Fang et al., 2009; Allan et al., 2017) and is based on an equity principle which is closely linked to the achievement of Sustainable Development Goal 3 ‘Good Health and Well-being’. This research has led to the re-examination of methodologies and the inclusion of methodologies more suited to identifying under-served areas.
The results of this study show the importance of environmental and social space in applying methodologies and examining issues of access to healthcare and the complexity of the access to health care. By its very nature, the issue of multi-islandism is adding to the issue of rural-urban disparity by creating barriers to access of a spatial nature. In addressing issues of population health Hartley (2004) highlighted that place of residence is a significant determinant of health in which the plight of isolated rural communities warrants further investigation.
As highlighted by Allan et al. (2017) and shown in this study, spatial variations contribute to the problem of access to healthcare and as such the individuals’ environment is of critical importance. Given that a clear spatial patterning is observable with the use of the TA2SFCA, it highlights the disadvantages of persons in these communities who are faced with less healthcare options, limited availability to healthcare providers, limited access to specialized services and longer travel distances to providers as compared to urban counterparts. Weisgrau (1995), for example, identified that rural residents face substantial barriers to mental health services which includes a lack of mental health specialists and the stigma associated with mental illness. The issue of stigma particularly in these small communities may be very sensitive. These results are consistent with studies that found that rural communities ranked poorly in several health indicators having difficulties in obtaining timely and cost-effective health care services, problems accessing physician and other providers because they are simply not available (Comer and Mueller, 1995; Weisgrau, 1995; Hartley, 2004; Allan et al., 2017).
These unique circumstances highlight the need for a difference-based health policy that is consistent with the environment in which it is implemented and does not adopt a one-size-fit-all approach. Fang et al. (2009) identifying the causes of regional disparities and developing appropriate policy responses are critical directions for policymakers and researchers.
Limitations
The conventional spatial accessibility methods that assumed supply capacity as the number of doctors available at the facility were used. Generally, the main limitations of the most commonly used methods for measuring spatial accessibility were their inability to account for temporal variation and cross-bordering. However, limitations related to the inability of conventional methods to capture temporal variations were addressed by using and modifying a temporally available floating catchment area methodology, which was recently developed by Paul and Edwards (2018). Although such modifications better reflected island-dependent dynamics, there is still an opportunity to improve the limitation of temporal variation by (1) inclusion of nurses as a part of capacity since the role of the nurse may be different within this dynamic and (2) weighting for doctor days to reflect demand-pull.
Conclusions
Traditional GIS measures of accessibility, such as the gravity and two-step floating catchment, were not found to be reflective of the island dependents’ dynamics since they were not able to account for the temporal dynamics of healthcare supply (doctor days) and only considered supply capacity as the number of doctors present at the facility. That is, in the case of the island dependents, only one facility always had a medical doctor available; for other health facilities, a medical doctor was present depending on the day of the week (‘traveling doctor dynamic’). This highlighted the clear inadequacy and context bias of these methodologies to the study of geographical accessibility in mostly single developed states where a doctor is generally present at each health facility. It also highlights the usefulness of this research work on MIMS and the need for more research to develop methodologies that are more reflective or sensitive to MIMS dynamics.
While all methodologies employed account for spatial context, they differ in how they weigh the distance between demand and supply—each weight differently. In the gravity and 2SFCA, there is the assumption that supply is static, however, the current method (TA2SFCA) does not account for this. Suffice to say, it is recognized that the TA2SFCA may not be suitable in all scenarios—especially when supply is fixed and there are no changes to the availability of services. In situations where the supply is fixed, the use of the Gravity model is appropriate when utilizing a suitable beta value. This requires a good understanding of the study area and an appreciation of how each method works.
In the context of these MIMS, there is a need to strengthen primary healthcare by further evaluating the need for more doctor days, expanding hours of operation, and integrating secondary services at specific locations with larger catchment areas as a means of improving spatial accessibility to healthcare. To facilitate these changes, there may be the need to provide suitable incentive packages to healthcare practitioners to work in remote locations. This may also include a re-evaluation of the role of nurses in these contexts, considering remote nursing as an option. This requires data and policy needs assessment that consider the general and unique dynamics of MIMS as it relates to effective and efficient healthcare planning. This would not only inform data collection and management practices but also would define levels of data resolution or disaggregation that are needed for effective decision-making. Ultimately, better planning requires data management practices, quality evaluation and strengthening particularly as it relates to standardizing data collection structures and processes as well as integrating data systems and analysis where possible. In the context of these isolated rural communities’ consideration must be given to approaches such as e-health and telemedicine which have the potential to improve access and availability to some health care services. These systems can enhance opportunities to address these access challenges specific to the environment and social space and also build resilience against future or new threats.
Supplementary data
Supplementary data are available at Health Policy and Planning online.
Data availability statement
The authors confirm that the data supporting the findings of this study are available within the article [and/or] its supplementary materials.
Funding
This research did not receive any specific grant from funding agencies in the public, commercial or not-for-profit sectors.
Acknowledgements
We wish to thank Dr Althea LaFoucade and Dr Earl Edwards for their support in executing the research. We also wish to thank the Ministry of Health and Central Statistics Grenada for their assistance during the data collection phase.
Author contributions
Conception or design of the work—Dr Roxanne Brizan-St. Martin
Data collection—Dr Roxanne Brizan-St. Martin
Data analysis and interpretation—Dr Roxanne Brizan-St. Martin & Dr Juel Paul
Drafting the article—Dr Roxanne Brizan-St. Martin & Dr Juel Paul
Critical revision of the article—Dr Roxanne Brizan-St. Martin & Dr Juel Paul.
Ethical approval.
Ethical Approval for this study is not required by our institute.
Conflict of interest statement.
None declared.
Endnotes
Primary Author ‘Temporal availability of public healthcare in developing countries of the Caribbean: An improved two-step Floating Catchment Area method for estimating spatial accessibility to healthcare.’
After 4pm weekdays, Saturdays PM, Sundays and public holidays.
Similar results for Dermatology which is offered on Wednesdays and Thursdays of the second week in every month.
References
Ministry of Health (MoH), Grenada.
Author notes
This study is useful for advocating more context-specific interventions for addressing issues of access in healthcare. Issues of spatial accessibility bring to the fore complex relationships between demand and supply as a result of spatial configuration. The methodologies employed and the results of the study can be useful for planning and designing more effective and efficient healthcare systems.
