


Abstract
Causal loop diagrams (CLDs) are a systems thinking method that can be used to visualize and unpack complex health system behaviour. They can be employed prospectively or retrospectively to identify the mechanisms and consequences of policies or interventions designed to strengthen health systems and inform discussion with policymakers and stakeholders on actions that may alleviate sub-optimal outcomes. Whilst the use of CLDs in health systems research has generally increased, there is still limited use in low- and middle-income settings. In addition to their suitability for evaluating complex systems, CLDs can be developed where opportunities for primary data collection may be limited (such as in humanitarian or conflict settings) and instead be formulated using secondary data, published or grey literature, health surveys/reports and policy documents. The purpose of this paper is to provide a step-by-step guide for designing a health system research study that uses CLDs as their chosen research method, with particular attention to issues of relevance to research in low- and middle-income countries (LMICs). The guidance draws on examples from the LMIC literature and authors’ own experience of using CLDs in this research area. This paper guides researchers in addressing the following four questions in the study design process; (1) What is the scope of this research? (2) What data do I need to collect or source? (3) What is my chosen method for CLD development? (4) How will I validate the CLD? In providing supporting information to readers on avenues for addressing these key design questions, authors hope to promote CLDs for wider use by health system researchers working in LMICs.
Causal loop diagrams enable identification and visualization of drivers for complex system behaviour, including spill over effects or unintended consequences of policy and managerial decisions.
They can be built and validated using different sources of data, depending on resource and health system setting constraints.
It is vital that further research using a systems thinking lens be conducted in LMICs, taking into account the delivery and resource constraints experienced by facilities and actors, to further our understanding of health system functioning and optimization.
Introduction
Health systems are complex systems due to the large number of system elements (people, resources, processes), the varying and extensive relationships between them, and their responsiveness to their external environment (Lipsitz, 2012; Barasa et al., 2017). They produce non-linear behaviour that evolves over time (Sterman, 2000a) and in response to relationships that exist between system elements (Lipsitz, 2012). Treating the health system as a static, linear system in evaluations results in oversight of potential unintended consequences, with health policies leading to suboptimal or undesirable outcomes due to focus on singular events and failure to observe the feedback and relationships between system elements (Adam and de Savigny, 2012).
For this reason, tools designed to manage and analyse complex behaviour need to be used to guide the design of health system interventions, and evaluate their effects (Skivington et al., 2021). In taking a ‘systems thinking’ approach to research, emphasis is placed on connections and relationships between system elements as part of a larger, evolving system (Peters, 2014). Methods derived from systems thinking enable evaluation of interventions on the wider, interconnected dynamic system whilst observing the important underlying mechanisms and interactions that drive health system behaviour (Gates, 2016). Causal loop diagrams (CLDs) are one such method providing a visual representation of the relationships between system elements and their interactions, leading to understanding of what drives problematic system behaviour (Adam, 2014).
By helping to identify key health system constraints and/or evaluate potential health system improvements prior to implementation to guide programme design, CLDs can ensure investments are well targeted, which is especially useful in resource constrained health systems Furthermore, CLDs can be employed even where routine health information system data are limited, as literature, policy reports and stakeholder interviews can be used to support development of models. CLDs can be used to better understand the ‘mechanisms for action’ in the health system before interventions are implemented to inform their design (Borghi and Chalabi, 2017), or after their implementation to determine what worked, how and why.
However, to date, the use of CLDs has been limited in health systems research in low- and middle-income country (LMIC) studies (Borghi and Chalabi, 2017; Cassidy et al., 2019). This paper introduces the reader to CLDs and their potential usages as a health systems research and policy tool, with particular attention to issues of relevance for LMIC studies. We then guide the reader through the stages of CLD development and validation (Box 1), using examples from the LMIC literature and authors’ own experience of using CLDs in Tanzania and Uganda.
(1) What is the scope of this research?
To define the phenomena or behaviour that you are trying to unpack, there are three key elements to consider:
Time frame of interest
Boundary of issue
Level of system aggregation
(2) What data do I need to collect or source?
To further understanding on what is driving phenomena/behaviour, we can source and analyse:
Primary data (e.g. key informant interviews and group model building)
Secondary data (e.g. programme evaluation data, published literature, health surveys or reports, policy documents and systematic or realist review).
Primary and secondary data
(3) What is my chosen method for CLD development?
Method for analysing and extracting data for CLD development:
Ex post development (e.g. thematic analysis and purposive text analysis)
Real-time development (e.g. group model building)
(4) How will I validate the CLD?
Method for confirming the CLD is still grounded in the experience of those with expert knowledge of the phenomena/behaviour:
Stakeholder dialogue, including group model building activities
Comparison to primary/secondary data sources
What are CLDs?
CLDs (Box 2) are diagrams that help us better understand what actions or mechanisms drive behaviour in a system (Tomoaia-Cotisel et al., 2017); feedback (interactions between system elements, causing cycles of cause-and-effect behaviour) and loops (cycles of behaviour) emerge through development of these diagrams, illuminating desirable or undesirable behaviour (Sterman, 2000a). We can also identify spill-over effects of actions or interventions to wider parts of the system and unintended consequences that can lead to unexpected outcomes.
System dynamics (the methodological field in which CLDs originate from) began as a tool for industrial and business management but now has widespread application across various research domains, including health system research (Pruyt 2017).
Notes to Box: Building blocks of CLD are presented; variables, arrows with polarity, reinforcing and balancing feedback loops and delays. Source: Adapted from Cassidy et al. (2021).
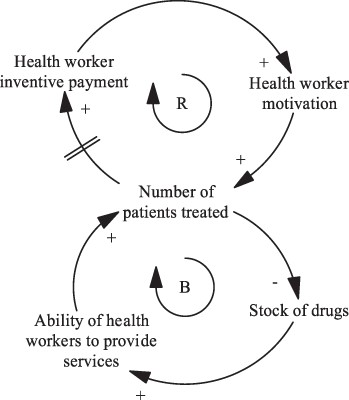
A simple CLD is presented in this box, showing the impact of a payment for performance intervention on the delivery of services at a health facility (Cassidy et al. 2021). Arrows with polarity indicate a causal relationship between two system variables and the direction of effect, for example, an increase in incentive payments during the intervention results in health workers feeling further motivated to deliver incentivised health services.
Delays in effect can also be represented, identified as a double line through an arrow. For example, we observe a delay in effect between the number of patients treated and an increase in the incentive payment then issued to health workers.
A series of arrows that close to form a ‘loop’ are labelled as either a reinforcing or balancing loop. A reinforcing loop exhibits amplified or spiralling behaviour (all arrows in the loop have the same polarity). An increase in health worker incentive payments leading to an increase in health worker motivation and the number of patients who are then treated leading to an increase in the incentive payments then issued to health workers is an example of a loop that shows reinforcing behaviour. A balancing loop is prevented from exhibiting spiralling behaviour by the presence of one or more variables and instead presents a dampened behaviour. An increase in the stock of drugs available at facilities results in an increase in health worker ability to provide services and the number of patients who are then treated. However, an increase in the number of patients treated results in a decrease in the stock of drugs at the facility.
For more information on interpretation and best practice for drawing CLDs (naming variables, identification of loops, etc.), please see Sterman (2000c) and Tomoaia-Cotisel et al. (2017)
When can I use a CLD?
There are a variety of potential applications of CLDs of relevance to the health systems research and policy community. CLDs can be used ex-ante, to inform the design of a health systems intervention or policy, or to develop a theory of change to guide its evaluation (McGill et al., 2021). Used in this way CLDs can determine the likely risks to a future programme that can be monitored during implementation to enable course correction (Sarriot et al., 2015) and/or understand underlying mechanisms (drivers) for health system behaviour, and leverage points which can be targeted to produce optimum system behaviour (Kwamie et al., 2014; Cassidy et al., 2021). CLDs can also be used retrospectively to explore how policy implementation changes over time (Nigenda et al., 2015), or to explore why health policies have succeeded or failed (Agyepong et al., 2012; Paina et al., 2014). They can be used in conjunction with existing health system frameworks, for example by identifying interconnections and/or dynamic behaviour between the WHO health system building blocks (Sharma et al., 2020). Finally, CLDs can also support the synthesis of evidence regarding a health systems intervention, used to present the results of realist and systematic reviews (Namatovu and Semwanga, 2020; Singh et al., 2021).
CLDs can also be used outside programme evaluation to explore how health systems respond to shocks or disruption (Ozawa et al., 2016; Jamal et al., 2020), and identify factors leading to system resilience, specifically the ‘absorptive, adaptive and transformative capabilities’ of the system. CLDs can highlight supply and/or demand side mechanisms related to a particular health condition, such as drivers for inadequate childhood immunization (Rwashana et al., 2009; Varghese et al., 2014; Kanniyan et al., 2021), uptake and provision of mental health services (Trani et al., 2016; Noubani et al., 2020) and refugee and host community demand for healthcare (Noubani et al., 2020; Zablith et al., 2021).
How to design a causal loop diagram study for a LMIC health system setting
What is the scope of this research?
When defining the scope of the CLD, there are three elements that need to be considered: the time frame of interest, the boundary of the issue, and the level of system aggregation (Kim, 2000). For what period of time did the policy or behaviour of interest unfold and therefore what period of time will be reflected in the CLD? What is the boundary i.e. where do we draw the line for what should be included in the diagram and what is external to it? Will the focus be on capturing community and/or facility dynamics (Rwashana et al., 2014), or is the focus on district or state (Cassidy et al., 2021), national (Paina et al., 2014) and/or global level dynamics (Glenn et al., 2020)? Relatedly, what is the level of aggregation in the CLD or level of detail needed to understand patterns of behaviour? To model the behaviour of interest, do actions and outcomes that occur on a daily, weekly, monthly or yearly basis need to be captured? When determining the scope of a CLD, the goal should always be to use CLDs to map key structural drivers for a given behaviour or problem of interest, not to try and map the feedback that drives behaviour in the entire, wider health system (Sterman, 2000a). This is key to avoiding overly complex diagrams which may obscure key dynamics around the behaviour or phenomena of interest.
The decision regarding the scope of the CLD can evolve during the process of the research, in response to discussion with stakeholders, new findings or resource availability for the project. In Cassidy et al. (2021), the research sought to determine constraints to achieving key service delivery targets in primary care facilities during a results-based financing programme. The time frame of interest was the duration of the programme (two years). The boundary and aggregation were informed by the research question (primary care facilities) and stakeholder experiences; their description of key events that led to their achievement or failure of targets during the intervention (at the facility, community and district-level) guided CLD development.
What data do I need to collect or source?
CLDs can be generated using a variety of data sources, including primary and secondary data; often a combination of sources is used.
Primary data
Popular primary data sources include key informant interviews (Sharma et al., 2020) and group model building (GMB) sessions (Noubani et al., 2020). In GMB, development of the CLD takes place with direct real-time input from stakeholders present (more on GMB in the next section) whereas with key informant interviews CLDs are developed post-hoc. The purpose of data collection is to obtain causal information on drivers for a behaviour/phenomenon of interest; this information will then be mapped out in the CLD. Stakeholders can also be asked to comment on potential leverage points within the system and actions that could be taken to alleviate problematic behaviour which can be represented in the CLD.
A recent paper has compared CLDs developed from key informant interviews to those developed through GMB (Valcourt et al., 2020). Although the CLDs developed from individual interviews yielded more variables and causal links, the CLDs produced from GMB workshops contained more feedback loops and more information on dynamic system behaviour. This was thought to be attributed to the design of GMB workshops, where stakeholders are actively encouraged to focus on feedback effects and dynamic behaviour. The decision to opt for key informant interviews versus GMB will be driven by several factors, including the availability of stakeholders, the topic under investigation (suitability for group discussion) and experience of the team. Due to global restrictions on travel during the recent COVID-19 pandemic, primary data collection has also successfully taken place through online mediums (Wilkerson et al., 2020; Cassidy et al., 2021).
Selection of stakeholders can be driven by researchers’ own knowledge of influential actors of the system under study or inferred from the literature. Who has expert knowledge of the problem we want to investigate? Those involved in funding, policy formulation, implementation and users/beneficiaries will have varying perspectives on the system and drivers for health system behaviour. Depending on the research question, different groups may need to be consulted to create a complete picture. Key informants can also be identified via snowballing during an initial round of interviews. Many studies in the current literature incorporate a provider perspective, with fewer including, or with the sole focus on the patient experience. Examples of study design and data collection tools for patients can be found in (Rwashana et al., 2014; Zablith et al., 2021).
Secondary data
Where a CLD is being used to understand causal pathways or programme mechanisms ex-post; programme evaluation data can be used to support the construction of a CLD (Varghese et al., 2014; Sarriot et al., 2015; Cassidy et al., 2021). Other secondary data such as published or grey literature (Yu et al., 2018; Kurnianingtyas et al., 2020), health surveys or reports (Li et al., 2019) and policy documents (Nigenda et al., 2015) can also be used to develop CLDs. Data extracted through a systematic or realist review can be cleaned, integrated and categorized to generate cause and effect relationships that can be represented in a CLD (Namatovu and Semwanga, 2020; Singh et al., 2021).
The decision to use secondary data to develop a CLD may be driven by difficulty in accessing stakeholders for primary data collection and/or a rich source of secondary data being available and suited for CLD development (Cassidy et al., 2021). Whilst secondary data might be less resource intensive to obtain, care should be taken to ensure the data contributes causal information on what is driving behaviour in the system. CLDs developed using primary data can also be triangulated with evidence from the literature and other secondary sources (Alonge et al., 2017; Ahmad et al., 2019). For studies where repeated access to stakeholders for CLD development is not possible (e.g. humanitarian settings), a combination of primary and secondary data sources may be preferable.
The results from a CLD developed using secondary data can be presented to stakeholders for triangulation and validation to ensure key information has been retained in the diagram (Agyepong et al., 2012; Cassidy et al., 2021). Stakeholder engagement encourages buy-in to the research, with higher likelihood of uptake of findings by stakeholders and policy makers (Zimmerman et al., 2016).
What is my chosen method for CLD development?
There are different approaches for developing a CLD. Depending on the purpose of the research and data requirements, researchers may choose ex-post development (developing CLD from data collected/sourced) or real time development (developing the CLD with stakeholders). For further information on presentation of CLDs, see Box 3.
There are software packages specifically developed for creating CLDs such as Vensim (Ventana Systems Inc. 2015) and STELLA (Isee Systems Inc. 2021). Each have different licenses available to purchase depending on the functionality needed by the user. At the time of writing, Vensim offers a free personal learning edition for educational use.
For ease of viewing, analysis and validation, it can be helpful to develop multiple CLDs or present the CLD in smaller segments (Sterman 2000b). Multiple CLDs can be used to demonstrate the policy effect and emergent behaviour (Paina et al. 2014; Renmans et al. 2017) and shifting community perspective on vaccine acceptance (Varghese et al. 2014) in the system at different time steps. A single CLD can also be presented in smaller segments, for example, key mechanisms related to the supply, demand and reporting of healthcare services (Rwashana et al. 2014; Cassidy et al. 2021); perception, causes and health seeking practices related to mental health (Noubani et al. 2020) can be presented in segments (that are connected in the wider, whole CLD). An example of how to illustrate where these segments connect in the wider CLD is given here (Cassidy et al. 2021).

Notes to Box: High-level snapshot of how three smaller diagrams presented in the paper fit together in the larger CLD is given. Three main mechanisms responsible for provider achievement of (or failure to reach) targets during payment for performance programmes are shown here. Mechanisms that result in changes in the supply of services (blue), mechanisms that result in changes in facility reporting (green) and mechanisms that result in changes in demand for services (red). Source: Cassidy et al. (2021).
Ex-post development
Thematic analysis is a popular choice for extracting information that can then be used for CLD development. Deductive, inductive and blended coding (Skjott Linneberg and Korsgaard, 2019) have been used to analyse primary and secondary sources of data in preparation for CLD development. With the former method, codebooks can be developed using relevant literature, conceptual frameworks and middle range theories (Kwamie et al., 2014; Xu and Mills, 2017) and used to traverse and extract variables, their relationships and linkages to be represented in the CLD. Codebooks can be updated where the researcher identifies new themes during data analysis. Deductive coding provides structure for traversing data from the outset but there is a possibility that new themes and concepts that emerge from the data might be missed.
With inductive coding, codes are derived directly from the data (Renmans et al., 2017; Lembani et al., 2018); codes or categories can be iteratively refined, and data reanalysed. Inductive coding is a suitable choice, where there is a lack of theoretical background to the research topic (Skjott Linneberg and Korsgaard, 2019). In practice, blended coding is often used to harness the strengths of each approach (Elliott, 2018).
Purposive Text Analysis is another option for analysing data and extracting information for CLD development (Kim and Andersen, 2012). This approach involves systematically reviewing key informant transcripts, extracting quotations that describe drivers for behaviour of interest, and extraction of cause-and-effect statements, with diagrams that represent these relationships. Cassidy et al. (2021) used this approach to develop their CLD (Box 4) and a method called CLD Combination (Tomoaia-Cotisel, 2018) to systematically merge together key informant CLDs into a single CLD. This approach involves ordering key informant CLDs in order of their ‘complexity’ (number of links, variables and delays). The most complex and second most complex CLD are compared. Additions are made to the most complex CLD where new information about system behaviour is revealed. Key informant CLDs are continually compared to this ‘anchor’ CLD until information from all CLDs are represented in one CLD.
(1a) Question: Are there any strategies being implemented that aim to address these challenges (to provision of quality health services)?
(1b) Quotation: ‘Yes, there is strategy done in the district, which is community health fund. We realized that the shortage of equipments and drugs was becoming a common problem which resulted in poor health service delivery [1], the community health fund was established as alternative to solve those problems. So once the government supply insufficient medicine [2] the community health fund money are used to substitute [3/4]’.
Main argument: When the Medical Stores Department (autonomous government department that procures and distributes health commodities to facilities, MSD) cannot provide drugs and equipment, facilities must draw on other sources of funding like the community health fund (community-based health insurance scheme) to buy medical commodities.
(1c) Causal structure:
| [1] | Causal variable | Relationship | Effect variable |
| Stock of drugs/equipment | Increase | Delivery of health services | |
| [2] | Causal variable | Relationship | Effect variable |
| MSD issue facility resources | Increase | Stock of drugs/equipment | |
| [3] | Causal variable | Relationship | Effect variable |
| MSD issue facility resources | Decrease | Facility use insurance funds to buy resources | |
| [4] | Causal variable | Relationship | Effect variable |
| Facility use insurance funds to buy resources | Increase | Stock of drugs/equipment |
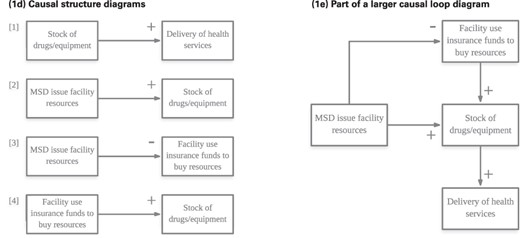
Notes to Box: In the example, the interviewer asked the stakeholder how health providers addressed challenges to the provision of quality health care in their facilities (1a) during a payment for performance programme. Quotations were deemed relevant and extracted if they described events or scenarios that furthered understanding of how stakeholders responded to the programme or demonstrated health system behaviour that facilitated or hindered facilities delivering quality health care (1b). Isolated cause and effect statements, with their associated quotations were extracted from transcripts and stored in an Excel file. The direction of the relationship (positive or negative, see Box 1 for details on interpretation of CLDs) was also noted; in the given example, an increase in the stock of drugs and equipment at facilities resulted in providers being able to deliver health services (1c).At the end of this data extraction process, all cause and effect statements were drawn as simple diagrams with a polarity indicating the direction of the relationship (1d). Each of these simple diagrams were then combined to form a single CLD representative of an individual’s mental model of the system (1e). Stakeholders may not use the same terminology in relaying information; as coding progresses, it becomes easier to standardise variable names assigned to cause and effect statements. Medical Stores Department (MSD).
Real time development
For real time development of CLDs, GMB is a popular choice. Scripts are freely available that can help researchers guide GMB sessions (Hovmand et al., 2011), hosted on the Scriptapedia website (Wikibooks Contributors, 2022). There are a range of activities that can be undertaken in GMB sessions depending on the purpose of the workshop; examples include encouraging stakeholders to discuss and list variables they think are driving a system process ‘Variable Elicitation script’ and developing a CLD as a group exercise ‘Initiating and Elaborating a Causal Loop Diagram script’ (Trani et al., 2016; Noubani et al., 2020; Wikibooks contributors, 2022).
A combination of methods can also be used to develop CLDs. For example, researchers may start by developing an initial CLD from secondary data or prospective interviews and then use a GMB workshop to develop a final CLD (Lembani et al., 2018; Jamal et al., 2020). Alternatively, CLDs can be initially developed through GMB sessions before triangulating the results with thematic analysis of subsequent key informant interviews (Zablith et al., 2021). Triangulating the results with data sources or presentation and discussion of the CLD with stakeholders lends weight to the validity of the CLD to represent real health system behaviour (see validation).
How will I validate the CLD?
The developed CLD needs to be validated to minimize any unconscious bias that may have been introduced by the researcher during development or misinterpretation of data. Stakeholder dialogue is the most popular method to validate CLDs in the LMIC health literature, with illustrative tools provided in Cassidy et al. (2021) and Rwashana et al. (2014). The decision to approach stakeholders will be dependent on accessibility to stakeholders and the nature of the topic under investigation.
Other examples of validation using primary sources of data include comparison of CLD structure to key informant interview transcripts or the original primary data source used for CLD development (Xu and Mills, 2017; Zablith et al., 2021) and multiple group model building sessions to validate structure (Trani et al., 2016). Secondary sources of data can also be used to validate the CLD, with CLD structure compared to findings in published or grey literature (Alonge et al., 2017; Ahmad et al., 2019), organization reports or policy documents (Paina et al., 2014; Jamal et al., 2020).
It is recommended that for analysis and validation, large CLD structures are broken down into smaller segments (Sterman, 2000b). Cassidy et al. (2021) initially split the CLD into three smaller diagrams, related to three broad mechanisms responsible for facility achievement of targets during a payment for performance programme and presented these individual segments to stakeholders for validation. This also allowed presentation of parts of the CLD to stakeholders with knowledge of that sector (rather than presenting the entire CLD for validation). However, initial stakeholder feedback indicated that they were interested in seeing how this smaller segment fed into the wider CLD. The research team felt this was an important issue—in presenting a single segment of the CLD, knowledge of how that segment operates within the wider CLD structure is lost and stakeholders are unable to see the ‘bigger picture’. In future interviews, stakeholders were still asked to comment and provide feedback on one of the three mechanisms, but the mechanism was now highlighted in the wider CLD. An extract of the validation tool used in this study is shown in Box 5, where stakeholders were verbally taken round the CLD to elicit their feedback.
Extract of the causal loop diagram validation tool to guide interviews with stakeholders. Original tool adapted from Rwashana et al. (2014) and Andersen et al. (2012). Source: Cassidy et al. (2021), adapted with permission
The interviewer does not have to explicitly run through these questions while discussing the diagram, can instead probe ‘Does this make sense? Are we missing anything important in this section of the diagram? Is there anything that you feel should be removed in the diagram?’. When an interviewee gives their feedback, it will generally fall into these compartments and help the modeller to go back and make modifications to the diagram:
● Does this part of the system exist to your knowledge?
● Are appropriate system variables represented? If not, what variables are missing or should be removed?
● Are appropriate in- and outflows represented? If not, what flows are missing or should be removed?
● Is the polarity of in- and outflows accurately represented? If not, what changes would you make?
● Are appropriate delays in the system represented? If not, what delays are missing or should be removed?
Conclusion
CLDs are a valuable tool for research or decision making, enabling consideration of problem behaviour, its drivers, and potential health systems policies or interventions as part of a wider, dynamic system. CLDs can identify bottlenecks and leverage points, areas where it would be opportune to intervene to produce optimal system behaviour. They can also be used as direct input to other research tools [e.g. to develop a system dynamics model (Pruyt, 2017)] or complement other research methods [such as realist reviews (Singh et al., 2021) or case studies (Jamal et al. 2020)]. Increased familiarity and understanding on how to use systems thinking tools, strengthened science-policy partnerships and dissemination of findings to appropriate audiences are essential to ensure their application to evaluate complex health system behaviour and use of findings (Kwamie et al. 2021).
Funding
This research is funded by the Medical Research Council under the Health Systems Research Initiative grant (MR/R013454/1).
Authorship statement
Conception or design of the work: Rachel Cassidy, Karl Blanchet, Josephine Borghi, Neha S. Singh
Drafting the article: Rachel Cassidy
Critical revision of the article: All authors
Final approval of the version to be submitted: All authors
Reflexivity statement
Article authors consist of four female and two male researchers, with both early career (RC) and senior researchers. Two authors (ARS and PB) are from the article study region.
Ethical approval
This study received a favourable ethical opinion from the Observational/Interventions Research Ethics Committee at The London School of Hygiene and Tropical Medicine (LSHTM Ethics Ref: 16139 – 3), the Institutional Review Board at Ifakara Health Institute (IHI/IRB/No:17 -2021) and National Institute for Medical Research (NIMR/HQ/R.8a/Vol. IX/3154) in Tanzania.
Conflict of interest statement
None declared.
