


Abstract
Fees charged at the point of use are a barrier to the health services’ users, especially for the poorest. Two decades ago, Cambodia introduced the so-called health equity fund (HEF) strategy, a waiver scheme which enhances access to public health services for the poor without undermining the economic situation of facilities. Evidence suggests that hospital-based HEF effectively removed financial barriers and reduced out-of-pocket expenditures. There is less evidence on the effectiveness of the HEF when assistance is extended to the primary level of healthcare. This research explores the impact of a HEF extended to health centres in two rural health districts. Two household surveys and 16-month diary data allowed to assess the impact of the intervention on health-seeking behaviours and expenditure of poor households. Though HEF effectively removed user fees at public health facilities, health centre utilization of sick and poor people did not budge much in the intervention district; self-medication and private provider consultations remained the preferred health-seeking behaviours, by far, even if more expensive. Difference-in-difference estimates confirmed that HEF had a slight impact on health-seeking behaviours, but only for the subgroups of HEF beneficiaries living close to the health centre and ready to test their new entitlement. This research reminds on the importance of the context for the effectiveness of any policy: in a highly pluralistic health sector, waiving already low-user fees in public health centres may be insufficient to increase rapidly the use of those facilities and reduce catastrophic spending. In such context, apart from distance to health centres, perceived quality of services at the health centres, which was relatively low compared with other providers, also matters. Although the HEF scheme plays a role in improving perceived and objective quality of care, complementary means are to be deployed.
Evaluation findings suggest that reimbursement of user fee exemption of health centre outpatient consultation services by health equity funds (HEFs) for the poor did not significantly increase their utilization of such services, despite a successful implementation of the scheme in the study rural district.
User fees of outpatient consultations were not the main barrier preventing the poor to use the health centres; they were already low and probably attractive enough compared with other providers.
Perceived quality of curative services and distance to health centre seem the real barriers to health centre outpatient services utilization. Although the HEF scheme played a role, this finding supports the decision to deploy complementary strategies focusing on improving the user experience at health centre level.
The nature of the healthcare market can have an influence on the effectiveness of a waiver scheme in the public health facilities. In pluralistic health systems, understanding health-seeking behaviours matters.
Introduction
Fees charged at the point of use can be a barrier to the users, especially for the poorest (Gilson, 1997; Xu et al. 2003; Lagarde and Palmer, 2011). User fees being a component of their healthcare financing system, many governments of low-income countries (LICs) face a difficult choice: either they keep the user fees but then limit access by the poor to public services or they remove user fees but then deprive their health facilities from a direct and easy access to cash and may disrupt their health system (Ridde et al. 2012). The Ministry of Health of Cambodia and its technical and financial partners have been particularly committed to address this problem. Two decades ago, they designed an original strategy to assist the poor to avail health services without compromising the economic situation of public health facilities: the health equity fund (HEF; Ir et al., 2010).
The HEF is a demand-side health-financing mechanism to enhance access to priority public health services for the poor. Ideally, the management of the funds is entrusted to a third party, usually a local non-governmental organization (NGO), which operates independently of the health facility (Hardeman et al., 2004). HEF beneficiaries are identified according to pre-defined eligibility criteria either at the community before healthcare demand (pre-identification) or at the health facility through interviews by NGO staff (post-identification). At the health facility, eligible poor patients get support from HEFs for the cost of user fees, as well as, in the case of hospitals only, for transportation cost, food allowance and cost for funeral in case of death. In comparison to other solutions, the HEF model is original in at least two ways: first, it tries to address the various barriers constraining the poor in their utilization of services (information, user fees, transport and self-esteem; Hardeman et al., 2004; Jacobs et al., 2011); second, through a split of functions, it ensures that targeting of resources is accurate and that the health facility faces an economic incentive to accept the poor. Ultimately, health facilities are encouraged to improve the quality of their services to both poor and non-poor in order to ensure their financial stability.
Since the first pilots in 2000, HEFs have been gradually scaled-up nationwide. Historically, HEFs have focused first on the barriers for using hospital services. As a further policy development stage, some HEFs have expanded their benefit package to health centres (Jacobs et al 2018), both to improve quality health services access and related financial protection and to re-establish the gate-keeping function of health centres towards hospitals (being overrun with the HEF scheme). Available evidence suggests that hospital-based HEFs effectively address financial barriers to accessing public health services for the poor and reduce their out-of-pocket health expenditures (Noirhomme et al. 2007; Flores et al. 2013), but there is less evidence on the effectiveness of health centre-based HEFs.
This article reports on an impact evaluation of an extension of HEF to health centre services carried out in 2012. It measures effectiveness of the HEF by comparing health-seeking behaviours of poor households in two neighbouring districts. It provides an interesting case to inspire strategies to increase access by the poorest to health services in LICs, as it challenges some usual recommendations. In the next section, we provide some background information. We then present the research design and the data. The following section presents the main results, which will be discussed in a final section.
Background
Healthcare financing in Cambodia
At the time of the study, Cambodia was a LIC, experiencing a rapid economic growth over the last two decades. The reconstruction of the health sector had to be done from scratch after the massive killings and destruction under the Khmer Rouge regime. Today, the health sector is highly pluralistic, with a public sector dominant in some niches but growingly marginalized for other curative needs, for which households prefer to go to a quite unregulated private sector (Meessen et al., 2011). The Ministry of Health of Cambodia and its partners have taken different initiatives to strengthen the public health system, many featuring a health care financing component (Annear et al. 2008, 2015; Ir et al. 2010, 2015; Van de Poel et al. 2014, 2016). The HEF is a key building block in this strategy.
As mentioned in the Introduction section, HEF has focused first on hospital services especially inpatient admissions. As the evidence supporting the HEF strategy grew (Noirhomme et al. 2007; Flores et al. 2013), HEF operators progressively developed interest for extending the HEF benefit package to first line curative services, which in Cambodia are provided by health centres. Several arguments pleaded in favour of such an extension, including: the overall under-utilization of health centres, especially for curative services, the need to correct inappropriate health-seeking behaviours (e.g. self-medication or unnecessarily expensive care, often of hazardous quality, in the private sector; Van Damme et al., 2004), the possibility that the user fees charged at health centre level, in spite of their low level, were still a barrier for the poorest and the risk that by its focus on hospital services only, the HEF scheme distorts health-seeking behaviours at the detrimental of more cost-effective services of the first line.
HEF extension to health centres
Behind the decision to extend the HEF to health centres lies a theory of change, i.e. the identification of a problem and a reasoned proposition of solution. The identified problem was the limited utilization of public health centres by poor households. The assumption behind the intervention was that this under-utilization was explained by two main barriers: the financial one, i.e. poor cannot afford the user fees at health centre level, and the informational one, i.e. poor ignore or underestimate the benefits of using those services (compared with lower-end services provided in the unregulated private sector or with self-medication), and they ignore that there is a scheme to assist them in their utilization of public health services. Trust in providers affects healthcare-seeking behaviour and perceptions prevent people from using public health facilities and having such a scheme may change their mind (Ozawa and Walker, 2011; GIZ, 2014).
The HEF scheme applied to both health centres and hospitals was designed and implemented as a mechanism to mitigate these barriers as well as to improve the objective quality of health centre services and to not overwhelm hospitals with HEF focusing only hospital services. It guarantees an entitlement to poor people to free care at the health centre and at the hospital (including medication), through the provision of a HEF family card and of information about its use. On the supply side, it provides resources to health facilities improving their financial stability. There may also be an incentive effect: the HEF pays health facilities along an output-based payment logic, and one strategy to attract more patients is to improve amenities and all the dimensions of quality which are observable by the users (Meessen et al., 2006).
It is expected that through visiting the health centre, entitled people experience the quality of the services provided by the public facilities and are incentivized to come more frequently and in time—we expect a change in health-seeking behaviour with both an increase in use of health services in general and a shift in health providers choice towards public health centre. On the supply side, the HEF extension provides incentives to accept patients for free: as the health facility gets reimbursed for the services provided to the poor and that part of this revenue goes to bonuses, staff are more motivated to receive them, which should in turn lead to better service quality and increase utilization by the poor. At the end, the programme planner expects greater well-being for poor households, through better health status and lower out-of-pocket payments and opportunity costs. The success of the intervention depends though on more systemic assumptions such as whether the HEF is well funded or whether the health centre is attractive, including that it is not too far from the poor households (as distance implies transport and opportunity costs), it does not practice under the table payments and it provides good quality services (Figure 1).
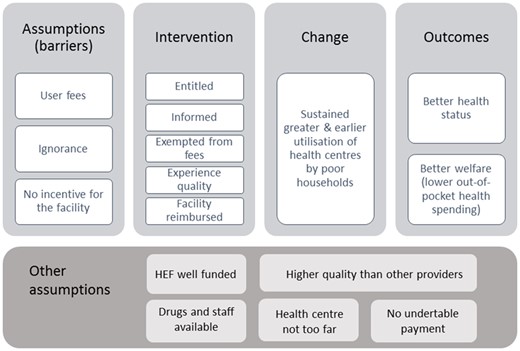
Theory of change of the HEF scheme to health centre and hospital. Source: Authors.
Methodology
Research design
The research design is a prospective observational study in two non-randomly selected neighbouring rural health districts in the Province of Battambang, where the HEF extension strategy was not yet in place in 2011 and has been implemented in one out of the two health districts in 2012 (Sampov Luon); the delay in implementation in the other health district, our control (Thmar Koul) was made purposely for the evaluation. The criteria to choose these two districts were (1) the opportunity of rolling out of HEF to health centre (HC) that allowed for intervention and control; and (2) similar characteristics of the two operational districts (OD), both rural ODs with similar health services. These two districts were considered as quite similar in terms of health system performance as well as of economy and population (Ir et al., 2011) and the baseline analyses confirmed that the two surveyed populations in the two districts were similar on many aspects, including demographics and socioeconomics (Lannes et al., 2011).
Roll-out of the intervention
In Cambodia, the identification of households eligible for social assistance programmes (including the HEF) is done by the Ministry of Planning. In both health districts, this identification was performed early 2011; the distribution of the HEF cards and the provision of information on how to use them was done in the second half of 2011. The entitlement consisted in free access to the health centre and hospital services, yet, with a slight difference: HEF households living in the intervention district had access to free care at the local district hospital and at all public health centres of the district (from January 2012), whereas HEF households living in the control district did not have access to free care services in their own district before summer 2013. The latter could, however, access these services for free in existing HEF supported facilities, in other districts, as the HEF card is portable; consequently, if they needed to, they could access for free services at the provincial hospital, which was at a 30-min drive from their district hospital.
Research questions
We aimed to check the programme theory of change (cf. above and Figure 1), and more specifically to study whether the HEF extension intervention generated changes in health-seeking behaviour of poor households, with a focus on the utilization of health centre outpatient consultation services and related health expenditure.
Data collection
Information was obtained in both health districts through surveys among households identified as poor (and eligible), before and >1 year after the intervention had been implemented in the intervention district. In-between, monthly aggregated diary data on health-seeking behaviour and expenditure were collected.
Sampling
This is a two-stage stratified cluster sample with 30 villages randomly selected in each district and 15 identified HEF households randomly selected in each selected village, reaching a total of 450 households and about 2250 individuals in each district; within a selected household, all individuals were eligible for the survey. The study was powered based on the number of individuals. The sample size was calculated with health centre utilization as main reference and the assumption of an increase of it by 75%, considering a two-sided significance level of 5%, a power of 90%, as well as the clustering and the attrition risks. A design effect of two was assumed at both village and household clustering levels, giving a theoretical ICC of 0.25 which was very cautious (survey data observed an ICC of 0.05). The assumed increase of 75% was based on a few pilot experiences of HEF extension to HC where routine data suggested that HC utilization had more than doubled with the HEF intervention after a few months.
Datasets
Survey data
There were two waves of household surveys, which together made up a panel database. For both surveys, a structured questionnaire was administered to each household who accepted the invitation. It included information on household socioeconomic status, morbidity, related health-seeking behaviours, health expenditures and mechanisms for coping with healthcare costs.
The baseline survey was performed in June 2011, i.e. even before the distribution of HEF cards. Among the 900 selected households, 868 were interviewed, yielding to information on 3977 individuals. The end-line survey was performed in May 2013, i.e. 16 months after the implementation of HEF in the intervention district, and before any HEF related intervention had started in the control district (where the implementation was delayed to Summer 2013). Among the 868 households that were interviewed at the baseline, 747 were retrieved and interviewed at the end line, which means 121 households were missing (14%). This is mainly explained by labour migration—a phenomenon which has accelerated over the last years in Cambodia. Although these missing households were on average poorer, they had roughly the same health status and seeking behaviour as the 747 households present at the end line. To get a balanced panel dataset for the before–after comparisons made from the survey data, we excluded from the analysis of all individuals for which we do not have data in both surveys.
Both baseline and end-line samples are gender balanced and composed of roughly 13% of under 5-year children and 13% of elderly (>50 years) adults. Age, gender and wealth distribution in the two districts is also roughly the same.
Diary data
In addition to the surveys, households interviewed at the baseline were asked to hold a healthcare diary where they would register their episodes of illness, health-seeking behaviours and related expenditure and costs, from September 2011 until December 2012. The completed diaries were collected, reviewed and validated by data collectors each month. In case diaries were not completed or not completed properly with missing information, data collectors asked the household head or related adult members for clarifications and information to complete the missing data as much as they could. Only data of validated diaries were entered into the computerized database, cleaned and analysed by data collectors each month. This healthcare diary provided information on healthcare utilization and related expenditure for each household member each month. It is worth noting that diary data and survey data were analysed separately, mainly because they rest on different recall periods: for the survey data, households were asked to recall their illness episodes during the preceding month, whereas for the diary data, they were asked to report them daily (i.e. as soon as an episode happened) on their logbooks; in practice, compliance with this request was variable as many diaries were not filled out daily by the participants. One should note, however, that thanks to the monthly visits of enumerators, the attrition rate remained relatively low over the study period, with a slight decline of observations on the way: we collected data from around 840 households during fall 2011 to around 700 households during fall 2012.
Data analysis
Descriptive analysis
Following the research protocol (Ir et al., 2011), the baseline survey data were first used to compare the two health districts and to ensure there were no significant differences among our main variables of interest. In addition, diary data collected before the start of the intervention allowed to test for the parallel trends assumptions. When applying a differences-in-differences design, we require that, without treatment, outcomes would need to increase or decrease at the same rate in both groups (Gertler et al., 2011).
Both types of data were used to assess whether the eligible households had received their HEF card and information related to it, and whether public health centres were effectively removing user fees for those households in the intervention district.
Impact on health-seeking behaviour
where is the indicator function and the error term is assumed to follow a logistic distribution. Impact of HEF scheme is provided by the coefficient associated to the time varying variable which is an interaction term multiplying district with period: it equals 1 only in the intervention district and for periods in which HEF operates and 0 otherwise. We controlled through dummy variables for time effects () that were common across both districts, and district as well as health centre specific effects ( and ) that were common over time. Individual and household (fixed or time varying) characteristics that are known determinants of health-seeking behaviours were included to gain precision (). Among other things, the vector included age, gender, migration status, economic quantile, literacy and whether the individual suffers from a chronic disease.
A similar model as (1) was applied to observe whether HEF intervention impacted:
Self-medication or consultation at the pharmacy (1, 0), among the sick individuals;
Private providers consultations (1, 0), among the sick individuals; and
More generally healthcare seeking (1, 0), among sick individuals.
Logistic estimates were performed for these models, alternatively with survey data and diary data. To check whether some conditions had made the intervention works, the models were also run with interactive variables. For instance, a variable multiplying with the distance to the health centre variable allowed to assess whether the intervention did work better for the households living closer to the health centre; other conditions checked included: severity of sickness, having a chronic disease, gender, economic median and literacy.
The theory of change of the intervention acknowledged that both the HEF entitlement and outpatient care are experience goods: the characteristics of the service are difficult to observe in advance but can be ascertained upon consumption. This suggests us to check whether HEF beneficiaries change their health-seeking behaviour after an experience at the HC. We explored this by testing a fixed effects logit estimator at individual level on the diary data and by adapting our sample on purpose. By construction, fixed effects models need at least two observations per individual, then all individuals who had not been sick or only once during the 16-month period were de facto excluded. Also, for the individual observations to be included, the dependent variable had to be variable over time. This means that, for instance, for the model on the probability to use health centre when sick (1), the individuals who had been sick twice had to have been once at the health centre and once to have another behaviour to be included in the estimates. These estimates lose many observations—about four-fifths of observations lost for health-seeking care and HC use, and one-third of observations lost for self-medication or pharmacy and private provider use—and this may create a bias of selection; though it helps to draw on the theory of change, as all the included individuals have tested at least once the public health centre.
Impact on health expenditures and costs
Results
Descriptive statistics
Baseline survey data revealed that the two districts samples were comparable in almost all respects (cf. baseline report, Lannes et al., 2011; Table 1). However, some differences are worth noting as they might have affected the main findings. First, health centre was significantly more utilized in the intervention district (10% among the sick) than in the control district (7%). Moreover, the composition of healthcare expenditure was different as the share of transportation costs was significantly higher in the intervention group (16%) than in the control group (8%). This might be because the intervention district is sparser.
Mean tests for outpatient care variables—baseline survey data
| Total sample | Intervention group | Control group | Difference | ||||||||
|---|---|---|---|---|---|---|---|---|---|---|---|
| Obs. | Mean | SD | Obs. | Mean | SD | Obs. | Mean | SD | Diff. I-C | T-test | |
| Outpatient care history | |||||||||||
| Sick or injured last month | 3977 | 62% | 0.01 | 2, 016 | 63% | 0.02 | 1, 961 | 60% | 0.02 | 3pp | 1.28 |
| Type of care received | |||||||||||
| Self-medication | 2463 | 29% | 0.02 | 1, 279 | 27% | 0.03 | 1, 184 | 31% | 0.03 | −5pp | −1.26 |
| Outpatient consultation | 2463 | 67% | 0.01 | 1, 279 | 69% | 0.02 | 1, 184 | 65% | 0.01 | 4pp | 1.74* |
| Inpatient care | 2463 | 1% | 0.00 | 1, 279 | 1% | 0.00 | 1, 184 | 1% | 0.00 | 0pp | 0.10 |
| No care at all | 2463 | 10% | 0.01 | 1, 279 | 10% | 0.01 | 1, 184 | 11% | 0.01 | −1pp | −0.64 |
| Initiation of treatment | |||||||||||
| # of days before care seeking | 1657 | 2.06 | 0.09 | 885 | 2.02 | 0.11 | 772 | 2.11 | 0.14 | −0.09 | −0.50 |
| First outpatient consultation | |||||||||||
| At hospital | 1657 | 2% | 0.00 | 885 | 2% | 0.01 | 772 | 2% | 0.01 | 0pp | −0.14 |
| At health centre | 1657 | 13% | 0.01 | 885 | 15% | 0.02 | 772 | 11% | 0.02 | 5pp | 1.98** |
| At private provider | 1657 | 28% | 0.02 | 885 | 28% | 0.03 | 772 | 29% | 0.03 | −1pp | −0.19 |
| At pharmacy | 1657 | 56% | 0.02 | 885 | 55% | 0.03 | 772 | 57% | 0.03 | −2pp | −0.49 |
| At traditional healer | 1657 | 1% | 0.00 | 885 | 0% | 0.00 | 772 | 2% | 0.00 | −1pp | −2.97*** |
| Health expenditures | |||||||||||
| Cost of treatment (% of total) | 1611 | 85% | 0.01 | 877 | 83% | 0.01 | 734 | 88% | 0.01 | −4pp | −2.45*** |
| Cost of transport (% of total) | 1623 | 12% | 0.01 | 882 | 16% | 0.01 | 741 | 8% | 0.01 | 7pp | 4.36*** |
| Total cost (in 10 000 riels) | 1652 | 3.44 | 0.28 | 885 | 3.32 | 0.27 | 767 | 3.58 | 0.52 | −1.20 | −0.44 |
Riels 10 000 were equivalent to around USD 2.5. pp means percentage point; P-value categories.
Source: Baseline report (Lannes et al., 2011).
P < 0.01,
P < 0.05,
P < 0.1.
Though there were these initial differences, econometric estimates using the diary data collected from September to December 2011 (i.e. before the intervention started) found that trends in these outcomes as well as in sickness and health-seeking rates were parallel, suggesting that differences observed in these outcomes are constant over time and actually no more significant (see Table A1 in Annexe). Further, it suggests that any difference observed in these outcomes once the intervention starts would be the result of the intervention (Gertler et al., 2011).
Effectiveness of the implementation of the intervention
Our datasets allowed to confirm that the intervention was fully implemented. In the end-line survey, almost all households (all 747 but 3) reported they had received their HEF card. Among them, 91% were informed about the use of the HEF card, and, within the intervention group, 86% had understood that it was for free care at health centre.
On the supply side, health centres in the intervention district effectively waived fees and did not request any under-table payment: between the baseline and the end-line survey, user fees reported by individuals that visited a health centre effectively decreased from a median of 2000 Riels (USD 0.50) per consultation to 0 Riels (cf. Figures 2 and 3). Moreover, no extra money was requested at a public health centre in any of the groups.
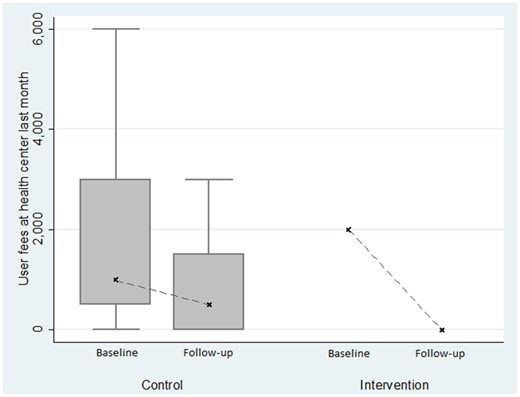
Evolution of user fees observed in health centres, with survey data.
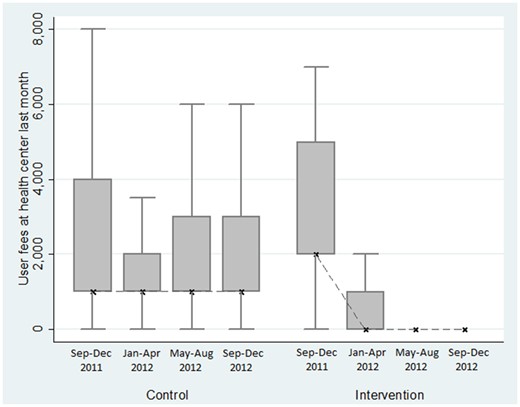
Evolution of user fees observed in health centres, with diary data.
However, it is worth noting that the HEF did not remove some other financial barriers. The total costs for using the health centre in the intervention district remained at a median of 5000 Riels (USD 1.25), thus representing 100% of their out-of-pocket expenditure. This was mainly due to transportation costs which were not part of the package.
Effect of the intervention on health-seeking behaviour
In the end-line survey data, 57% of individuals were reported as sick in the previous 4 weeks. Among them, about 95% sought care (compared with 90% at the baseline survey). According to both survey and diary data, health centre utilization among the individuals reported as sick was low before the intervention in both districts (according to survey data, 6.6% and 10.4%, respectively, in the control and in the intervention districts), and remained low afterwards in both districts (5.7% and 11.9%, respectively, in the control and intervention districts, cf. Figures 4 and 5), suggesting no or very low impact of HEF on health centre utilization. One should note that there might be a selection bias risk: additional difference-in-difference analyses found out that HEF had a significant impact on the probability of reporting a sickness (reducing the probability by 7 percentage points with survey data and 4.6 percentage points with diary data).
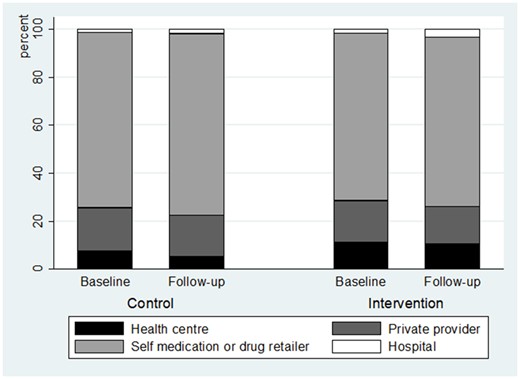
Type of healthcare provider utilization, among the healthcare users, with survey data.
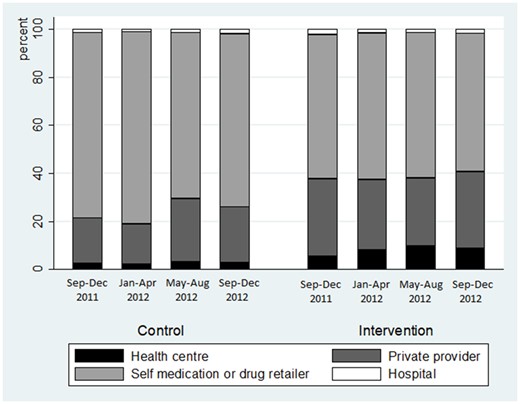
Type of healthcare provider utilization, among the healthcare users, with diary data.
On both sets of data, we ran econometric regressions to assess the difference-in-difference estimates, controlling for confounding factors (cf. Table 2). The results from the surveys confirmed no significant impact of the HEF on health centre utilization, but those from the diaries slightly suggest a positive impact of 2.5 percentage points (at the 10% level). No significant change was found on rival health-seeking behaviours, among the population who experimented at least one sickness episode during the period, using both datasets.
Effects of HEF on health-seeking behaviour
| Column | (1) | (2) | (3) | (4) | |||
|---|---|---|---|---|---|---|---|
| Data source | Sample | Estimator | Dependent variable: probability to… | Seek care when sick | Use health centre when sick | Use self-medication or drugstore consultation when sick | Use private clinic when sick |
| Survey data | All | Logit | Average marginal effect of HEF at HC | −0.030 | 0.022 | −0.029 | −0.022 |
| (0.026) | (0.030) | (0.034) | (0.034) | ||||
| Observations | 3724 | 3659 | 3724 | 3724 | |||
| Individuals | 2430 | 2390 | 2430 | 2430 | |||
| Pseudo R2 | 0.0776 | 0.0594 | 0.0458 | 0.0894 | |||
| Diary data | All | Logit | Average marginal effect of HEF at HC | 0.016 | 0.025* | 0.034 | −0.055 |
| (0.016) | (0.015) | (0.045) | (0.039) | ||||
| Observations | 17 092 | 18 244 | 18 889 | 18 889 | |||
| Individuals | 3160 | 3332 | 3398 | 3398 | |||
| Pseudo R2 | 0.1415 | 0.1144 | 0.1249 | 0.1085 | |||
| Only individuals with at least two different observations of the dependent variable | FE logit | Average marginal effect of HEF at HC | 0.091* | 0.167*** | 0.058*** | −0.097*** | |
| (0.054) | (0.048) | (0.021) | (0.021) | ||||
| Observations | 2450 | 3772 | 13 769 | 12 641 | |||
| Individuals | 304 | 509 | 1911 | 1760 | |||
| Logit | Average marginal effect of HEF at HC | 0.100 | 0.128** | 0.033 | −0.067 | ||
| (0.083) | (0.054) | (0.058) | (0.055) | ||||
| Observations | 2450 | 3772 | 13 769 | 12 641 | |||
| Individuals | 304 | 509 | 1911 | 1760 | |||
| Pseudo R2 | 0.1012 | 0.0484 | 0.0782 | 0.0750 |
Cluster-robust standard errors in parentheses (cluster at village level). The logit estimates control for health centre fixed effects as well as for individual variables such as: age, gender, whether they suffer from a chronic disease, the rate of the sickness, whether they are a farmer or a casual worker; and household variables such as: age, gender, literacy and occupation of the household head, age composition of the household, distance to health centre, poverty median. All estimates control for period fixed effects.
P < 0.01,
P < 0.05,
P < 0.1.
The models using the fixed effect logit estimator provide a different picture (Table 2, row 3). As explained in the methodological section, we kept only the individuals that had at least two sickness episodes during the 16-month period and for which the outcome varied over time. A lot of observations were then let aside: for instance, 2450 observations (on 304 individuals) have been used on the healthcare-seeking model using the fixed effects logit estimator compared with >17 000 observations for the one using the logit estimator. Among these individuals who had been sick at least twice and who did not always seek care (but did so at least once), the intervention of HEF at the health centre level did have a significant positive impact of 9.1 percentage points on healthcare-seeking behaviour (at the 10% level).
Similarly, the intervention had an important and very significant impact on those that had been sick at least twice and who did not always seek care at the health centre: among them, the probability to seek care at the health centre when sick increased by 16.7 percentage points (at the 1% level, col. 2; similar findings were found using the simple logit estimator with confounding variables and using the same sample of observations). This means that the intervention worked relatively well, once individuals had tested the health centre and had assessed both the effectiveness of their HEF card and the quality of services. It seems that this occurred at the cost of private clinics: the findings suggest that the intervention had a negative and significant impact of -9.7 percentage points (at the 1% level) on the use of private clinics, among the individuals who had been sick at least twice and who had visited a private clinic at least once but not always, during the 16-month period (col. 4).
Interactions
The diary data estimates of conditional effects (Table 3) strongly suggest that the distance to health centre reduced the effect of HEF on the probability to use the health centre when sick. Results from the logit estimates on the whole population who had been sick at least once over the period suggest that HEF increased by 4.5 percentage points the probability to use health centre for people living close to the health centre (i.e. <5 km), while this effect was almost cancelled for larger distances (Table 3, col. 2). The findings are rather similar with the fixed effects estimates where only the individuals who had been sick at least twice over the period and who had not always used the health centre: HEF increased by 28.3 percentage points the probability to use health centre for people living close to the health centre, while the effect was almost cancelled for larger distances (Table 3, col. 3). The other tested conditional variables, such as poverty median, sickness rate, chronic disease and gender, did not provide consistent findings over the various models (results available on demand).
Conditional effects of HEF on health centre utilization when sick
| Column | (1) | (2) | (3) | (4) |
|---|---|---|---|---|
| Data source | Survey | Diary | ||
| Sample | All | All | Only individuals with at least two different observations on health centre utilization | |
| Estimator | Logit | Logit | FE logit | Logit |
| HEF at health centre | 0.007 | 0.045*** | 0.283*** | 0.212*** |
| (0.032) | (0.015) | (0.047) | (0.046) | |
| HEF × distance to HC of 5–10 km (/<5 km) | 0.081* | −0.040*** | −0.274*** | −0.162*** |
| (0.043) | (0.014) | (0.046) | (0.028) | |
| HEF × distance to HC of 10+ km (/5 km) | −0.031 | −0.006 | −0.165** | −0.074 |
| (0.028) | (0.037) | (0.082) | (0.063) | |
| Observations | 3659 | 18 244 | 3772 | 3772 |
| Individuals | 2390 | 3332 | 509 | 509 |
| Pseudo R2 | 0.0647 | 0.1198 | 0.0560 | |
Dependent variable: probability to use health centre when sick. Cluster-robust standard errors in parentheses (cluster at village level). The logit estimates control for health centre fixed effects as well as for individual variables such as: age, gender, whether they suffer from a chronic disease, the rate of the sickness, whether they are a farmer or a casual worker; and household variables such as: age, gender, literacy and occupation of the household head, age composition of the household, distance to health centre, poverty median. All estimates control for period fixed effects. Average marginal effects are reported.
P < 0.01,
P < 0.05,
P < 0.1.
Effect of the intervention on health expenditure
Our findings above point out that though health centre services were less expensive thanks to the HEF, its impact on health-seeking behaviours of the poor was very limited. This may, in turn, hinder HEF impact on poor households total health expenditure. Indeed, to cut the total bill, it was a key to dramatically reduce the recourse to the private providers, who are by far, the most expensive option: at the end line a private provider consultation costs around USD12.5, i.e. 10 times the price of a consultation at the health centre, transport costs included.
Econometric estimates displayed in Table 4 suggest that HEF at HC did not have any impact on the incidence of household health expenditure. In addition, looking at the amount of household health expenditure in Riels per capita, we did not find any significant effect using the survey data. We, however, found a significant effect of the intervention on the amount of household health expenditure with the diary data using the fixed effects model, which we believe is the most efficient estimator. With this model, we observed that the amount of health expenditure was reduced by 16.3% thanks to the HEF intervention (at the 5% level).
Effects of HEF on total household health expenditure expressed per capita
| Data | Survey data | Diary data | ||||
|---|---|---|---|---|---|---|
| Column | (1) | (2) | (3) | (4) | (5) | (6) |
| Estimator | Logit | GLM, Gamma link-log | Fixed effects | Logit | GLM, Gamma link-log | Fixed effects |
| Dependent variable | Prob HE >0 | Level HE if HE >0 | Level HE if HE >0 (ln) | Prob HE >0 | Level HE if HE >0 | Level HE if HE >0 (ln) |
| Average marginal effect of HEF at HC | −0.019 | 2114.0 | −0.234 (% change) | 0.032 | 852.1 | −0.163*** (% change) |
| (0.034) | (8643.5) | (0.187) | (0.050) | (3385.5) | (0.048) | |
| Observations | 1313 | 1235 | 1235 | 13 039 | 10 536 | 10 536 |
| Households | 660 | 672 | 672 | 823 | 868 | 868 |
| Pseudo R2 | 0.0559 | 0.0701 | ||||
Cluster-robust standard errors in parentheses (cluster at village level). The logit and GLM estimates control for health centre fixed effects as well as for household variables such as: age, gender, literacy and occupation of the household head, age composition of the household, distance to health centre, poverty median. All estimates control for period fixed effects.
P < 0.01,
P < 0.05,
P < 0.1.
At the baseline, the main source of financing costs associated with outpatient care was cash (i.e. 81%; respectively, 84% and 79% in the intervention and control districts), whereas 15% (14% and 16%) of outpatient users borrowed money to pay their care. At the end line, although this picture was roughly the same in the control district, it had changed in the intervention district: around 15% received free healthcare (at the health centre), 69% paid cash (at the level of other providers). However, still 15% borrowed money to pay for their healthcare. The econometrics performed did not reveal any effect of HEF on coping strategies occurrence. Unfortunately, as we don’t have data on the level of debt, we cannot check whether the amounts borrowed diminished or not with HEF.
Discussion
Summary of findings
The main finding of this study is that the extension of the HEF scheme to health centre outpatient consultation services in Sampov Luon health district did not work as expected, within the study timespan, in terms of increase in health centre outpatient consultations by the poor; it only increased utilization by the poor living nearby. Despite their new entitlement to free services at health centre level, most of the poor households continued to disregard public health centres as a place to get curative services. The main positive finding is that households curious to test their entitlement seemed to adapt their health-seeking behaviours afterwards.
The lack of significant effect of the intervention was not due to poor implementation: the population surveyed had received their HEF card; they reported a good understanding of the scheme; and those using the health centres in the intervention district were indeed waived from payment when intervention occurred. This suggests that the programme did not succeed in increasing health centre utilization because one of the main assumptions was probably wrong: user fees for health centre outpatient consultations were not the main barrier preventing the poor to use such services; they were already low and probably attractive enough.
To explain the low utilization of health centre curative consultations by poor households, we have to turn to other explanations. One is the distance to health centre, and the direct and indirect costs it implies. In our study setting, this distance is on average larger in the intervention district, and our findings suggest that the distance to health centre impeded HEF impact on their utilization. This is consistent with the fact that proximity to the provider was also among the main reasons reported for choosing one or the other provider.
Another explanation is the perceived quality of services at the health centre—which seems to be rather low compared with other types of providers in Cambodia. Indeed, our estimates suggest that for slight and moderate diseases, poor people self-medicate, whereas for more serious ones, they go to the private providers (who may consist of the health centre staff outside opening hours). This pattern of behaviours is very consistent with behaviours observed elsewhere in Cambodia (Meessen et al., 2011). However, our findings provide some hope that this may change on the long run—assuming that the quality of services provided at the health centre is good enough at least from users’ perspective: estimates performed on a sample of individuals who had tested at least once the services provided at the health centre point out that the intervention had an important and positive impact on their utilization of public health centres the next times they sought care. This suggests that these users appreciated the quality of services provided at the health centre.
Consistent with these findings, we found no effect of the HEF strategy on the incidence of health expenditure, though the amount of health expenditure was significantly reduced. This is in line with findings from Flores et al. (2013). Looking at the sources of financing costs associated with outpatient care, we found out that the percentage of households receiving free healthcare had increased in the intervention district; however, the percentage of households adopting coping strategies to finance their health expenditure had not been reduced. It suggests that, within the study timespan, the HEF intervention did not reduce long-term welfare risks related to coping strategies such as borrowing (Ir et al., 2012), but instead resulted in a shift from paying to receiving free care for those that could already afford their health expenditure.
Policy and scientific lessons
Our research suggests that in rural Cambodia, entitling poor households to free healthcare may not be enough to persuade them, at least over a 2-year period, to avail to health centres for curative services when sick.
Over the last two decades, a lot of creativity and efforts have been put into innovative healthcare financing schemes addressing specific health and social protection needs to vulnerable groups in the country. It happened that many of these schemes have managed to get households using public services (Flores et al. 2013; Ir et al. 2015; Van de Poel et al. 2014, 2016). The HEF was an important component of this policy and there is today a sound body of evidence that the HEF has secured access to hospital services for tens of thousands of poor households in the country. This has indirectly proven that user fees (as well as transport costs and lack of information) were barriers affecting hospital utilization by the poor. But there were also some disappointing results with some of these health financing innovations, the most remarkable being probably the very low subscription of rural households to a micro-insurance scheme in Takeo Province (Levine et al., 2016). The main cause explaining the lack of effectiveness of the HEF at health centre level in our study may be the same than the one behind the failure of the micro-insurance experiment: Cambodian households are selective in their use of health facilities; whereas households use public health centres for preventive services, they largely rely on various forms of private provision for their curative services (Meessen et al., 2011). The Takeo experiment pointed out that they were not ready to buy a health insurance for non-specialized curative services; this study suggests that even if they receive this insurance for free, they do not use it.
What can be done? Policy action could take several directions but increasing the performance and attractiveness of the health centres seems a priority. This is the route taken by a recent pilot initiative, the ‘Integrated Social Health Protection’ scheme (ISHPS), implemented in another rural province. The ISHPS allowed non-HEF beneficiaries to enrol in HEF against a payment; it also combines vouchers for selected health services, pay-for-performance for quantity and quality of care and interventions aimed at increasing the accountability of health facilities. A recent evaluation confirmed that this approach was superior to narrower HEF interventions (Jacobs et al., 2018).
Expanding the free entitlement beyond the poor—i.e. consolidating the insurance nature of the HEF—makes a lot of sense. Households’ perceptions of quality of care can be very important determinants of utilization (Peters et al., 2008). Perception of quality may also depend on how the other groups of the population behave. Our findings suggest that the low utilization of health centres is probably partly a problem of image: after a positive experience, health centre users can appreciate the quality of services provided at that level. Interventions improving the performance of public health facilities to the benefit of other groups as well, should also be welcomed. A nationwide governmental scheme incentivizing the institutionalization of deliveries has for instance shown that pay-for-performance financing mechanisms could be part of the solution (Ir et al., 2015). A pilot experiment of a performance-based financing scheme with a heavy focus on quality of care is currently ongoing.
This study has relevance beyond Cambodia. ‘User fees or not’ has been one of the most passionate debates over the last 20 years in international health (James et al., 2006). No one denies that high fees create major problems of access. Some have argued that even low fees can constitute a major barrier for the poorest (Kremer and Miguel, 2007; Yates, 2009): this is probably true for preventive services or for some specific contexts (Kremer and Miguel, 2007), but it may not be that true in some situations, as our study suggests.
This study reminds that ‘low utilization’ does not equate to ‘low access’. In a situation where households do not use health centres, and largely choose other types of providers instead, the priority is probably to try to understand the reasons behind these behaviours and to focus on the related bottlenecks and frustrations (if increasing the utilization of the public health centres is a goal per se). Scratching the fees, especially if they are already low, or entitling households to an insurance to use the public facilities may not be sufficient. In countries, where the health sector is highly pluralistic (sometimes because of the prior weak performance of the public sector), price elasticity for public services may be lower than in countries where there is not much alternative to the public sector. Waiving user fees may then be less effective than hoped. In our sample, poor households were ready to pay, on average, 10 times more for a private provider than for a public health centre. This suggests that improving the user experience at health centre level could be a more appropriate strategy for attracting poor and non-poor households in the public sector. Some could argue, in a provocative way, that in such competitive health markets, increasing fees in the public health centres (if it is the only way to finance a substantial improvement of the patient experience) could lead to a reduction in the catastrophic spending (if the latter mainly occur in the private sector).
We are not aware of many studies investigating how reimbursed user fee exemption schemes or free health care initiatives displace (or not) alternative health-seeking behaviours in LICs. This deserves more attention from the research community. Among other things, the fact that healthcare is an experience good—the experience with the entitlement and the provided services influences future behaviours—could be better considered. Our research also suggests that empirical studies on initiatives and experiments aimed at reducing financial barriers should pay more attention to the health sector context. A first step could be to provide information on the health market composition (Meessen et al., 2011) in the background section.
Study limitations
It is important to keep in mind that our study took place in two health districts only. Our findings should, therefore, be interpreted with caution and not be generalized too hastily for the whole country. Difference-in-difference methods come with some limitations too: even when trends of the two groups are parallel before the start of the intervention, bias in the estimation may still appear if any other potential factor was present during the intervention period in one of the two groups. Another limitation is the loss-to-follow up of several households during the study. In addition, the HEF card is mobile and allows the holders to seek care in the neighbouring district; unfortunately the questionnaire did not allow to check which health centres the users were going to, meaning that the impact might have been underestimated if holders from the control district used health centres in the intervention district to get free care. We, however, believe that this could only marginally happen as the transport costs to go to the neighbouring district may easily compensate for the removed fees at health centre.
Another issue is the risk of selection bias. In additional analyses, we found that HEF had a significantly reducing impact on the probability of reporting a sickness episode. We have no explanation for this finding, since there’s only a slight impact of HEF on public facilities utilization.
The study design did not allow to assess the impact on gate keeping for hospital benefits nor on objective quality improvements at health centre level, while these were primary motivations of the intervention implementers.
Unfortunately, data on self-medication and drug retailer utilization were not collected the same way at baseline and at end-line surveys and did not provide comparable figures and merging the two was the best way to consider medicines in our analysis. In Cambodia, medicines are provided for free in all public health facilities. Mild stock-outs may happen (Annear et al., 2015) but a possibly more important driver of health-seeking behaviour is the fact that at HC level, the essential drug list is rather restrictive (Vong et al., 2005; Bigdeli et al., 2016).
When analysing our data, we found useful to develop the programme theory of change supporting the intervention. We believe that this theoretical effort is a good practice which could enhance the scrutiny of other healthcare financing interventions elsewhere.
Despite limitations, we are confident in our findings that are resulted from analysis and triangulation of two types of data collected among the same households: baseline and end-line survey data, as well as diary data collected over a 16-months period—which together make up a higher number of observations and a greater statistical power. It must be noted that there are discrepancies between the two types of data, e.g. morbidity rates during the last month. This may be due to recall errors: individuals may under-report true episodes of sickness or healthcare utilization due to faulty memory during surveys where people are asked to remember what happened during the last month. In a similar way, telescoping errors occur when people compress the sickness or healthcare utilization episodes that occurred over a longer period into the reference period asked. This is more likely to happen when we observe more severe or expensive episodes. One might think that, without being subject of these types of errors, diary data are of better quality. However, while in theory entries are recorded daily by the respondent, in practice it can often be the case that interviewers assist in completing the diary; thus, it may be that in the case of illiterate or unmotivated respondent, diary data correspond more to a month recall survey. Consequently, this is hard to judge about which type of data is more reliable: survey data or diary data? This would need investigations such as those performed by Beegle et al. (2012) on consumption data or Das et al. (2012) on health data using various recall periods.
Conclusion
In this article, we assessed the impact of a HEF scheme applied to both hospital and health centre on the utilization of health centre outpatient consultation services by poor households and on their health expenditure. We found that this intervention generated an increase in the utilization of health centre outpatient consultations, but only for those living closer to the health centre and ready to give a chance to the health centre; on average, utilization of health centre outpatient consultations remained low. Consistent with these findings, we found no effect of the HEF strategy on the incidence of health expenditure, though the amount of health expenditure was significantly reduced by about 16%.
The observed effects of such reimbursed user fee exemption scheme in terms of increased health centre outpatient consultations by the poor living nearby and reduced amount of household health expenditure does not seem significant enough to expect a major contribution to universal health coverage in Cambodia. In this context, it may require more holistic interventions leveraging demand-side financing mechanisms together with greater efforts to improve the supply side, in terms of both developing the public sector and harnessing a private sector sometimes insufficiently regulated. This recommendation is probably relevant for some other countries with pluralistic health sectors.
Acknowledgements
We thank Tapley Jordanwood and Chean Men for their key role in implementing the intervention and the study, Laurence Lannes for her work on the baseline analysis, Joris Menten and Tom Smekens for their statistics advice, and Tim Johnston for the World Bank co-funding. We also thank individuals who commented on our work at the HEFPA workshop in Yogyakarta in 2013, the JESF congress in Dijon 2015 and the seminar organized in CERDI, Clermont-Ferrand, France, in February 2016. This study was funded through EU-FP7 research grant HEALTH-F2-2009-223166-HEFPA on ‘Health Equity and Financial Protection in Asia’; the endline survey was co-financed by the World Bank. This funding covered the research design, data collection and data analysis costs.
Conflicts of interest statement. None declared.
Ethical approval. The research protocol was approved by the Institute of Tropical Medicine of Antwerp Institutional Review Board on 26 April 2011, with the reference IRB/AB/kw/077.
References
GIZ.
Annexe
Parallel trends assumption check
| Dependent variable: probability to… | Report a sickness episode | Seek care when sick | Seek care at health centre when sick |
|---|---|---|---|
| Explanatory variables: | |||
| Time (month) | −0, 14*** | −0, 38*** | −0, 11 |
| (0, 03) | (0, 10) | (0, 12) | |
| Time × HEF district | 0, 05 | −0, 11 | 0, 03 |
| (0, 04) | (0, 14) | (0, 14) | |
| District | 0, 02 | −0, 47 | 0, 67 |
| (0, 14) | (0, 54) | (0, 54) | |
| Observations | 15 123 | 5940 | 5940 |
Logit estimates, constant included (not displayed). Cluster-robust standard errors in parentheses (clustered at village level).
P < 0.01,
P < 0.05,
P < 0.1.
