


Abstract
Background. In Sub-Saharan Africa, maternal and neonatal morbidity and mortality rates are associated with underutilization of skilled birth attendance (SBA). In 2007, Burkina Faso introduced a subsidy scheme for SBA fees. The objective of this study was to evaluate the effect of Burkina Faso’s subsidy policy on SBA rate across socioeconomic status (SES) strata.
Methods. We used a quasi-experimental design. The data sources were two representative surveys (n = 1408 and n = 1403) of women from Houndé and Ziniaré health districts of Burkina Faso, and a survey of health centres assessing structural quality of care. Multilevel Poisson regression models were used with robust variance estimators. We estimated adjusted rate ratios (RR) and rate differences (RD) as a function of time and SES.
Results. For lowest-SES women, immediately upon the introduction of the subsidy policy, the rate of SBA was 45% higher (RR = 1.45, 95% confidence interval (CI): 1.19–1.77) than expected in the absence of subsidy introduction. The results indicated a sustained effect after introduction of the subsidy policy, based on RR estimate (95% CI) of 1.48 (1.21–1.81) at 2 years. For middle-SES women, the RR estimates were 1.28 (1.09–1.49) immediately after introduction of the subsidy policy and 1.30 (1.11–1.51) at 2 years, respectively. For highest-SES women, the RR estimates were 1.19 (1.02–1.38) immediately after subsidy introduction and 1.21 (1.06–1.38) at 2 years, respectively. The RD (95% CI) was 14% (3–24%) for lowest-SES women immediately after introduction of the policy, and the effect was sustained at 14% (4–25%) at 2 years.
Conclusion. Our study suggests that the introduction of a user-fee subsidy in Burkina Faso resulted in increased rates of SBA across all SES strata. The increase was sustained over time and strongest among the poorest women. These findings have important implications for evidence-informed policymaking in Burkina Faso and other countries in Sub-Saharan Africa.
Key Messages
Empirical evidence of subsidy policies’ effect on skilled birth attendance (SBA) in Sub-Saharan African countries remains weak, and the effect across socioeconomic status (SES) remains limited and contradictory. Decision-makers and funders of such policies in Africa need more evidence.
Introduction of a user-fee subsidy policy in Burkina Faso resulted in increased rates of SBA across all SES strata. The increase was sustained over time and strongest among the poorest women.
This evidence supports the effectiveness of subsidizing maternal health services, with important implications for evidence-informed maternal health policymaking in Burkina Faso and other countries in Sub-Saharan Africa.
Introduction
Each year around 287 000 women die worldwide from complications related to pregnancy or childbirth (WHO et al. 2012). Almost all maternal deaths occur in low- and middle-income countries (LMICs), with the majority taking place in Sub-Saharan Africa (WHO et al. 2012) It is largely acknowledged that promoting facility-based skilled birth attendance (SBA) contributes to the reduction of maternal (and neonatal) morbidity and mortality (Say and Raine 2007; Gabrysch and Campbell 2009). Less than half of women (46%) who give birth in Sub-Saharan Africa do so in the presence of a qualified professional (United Nations 2010). To increase the utilization of essential obstetric care, including SBA, 17 African countries have adopted subsidy policies in the last decade (Dzakpasu et al. 2013). Previous studies have suggested that subsidizing maternal services has a positive impact on SBA utilization in African settings (Lagarde and Palmer 2008; Ridde and Morestin 2011), including Burkina Faso (Ridde et al. 2011; De Allegri et al. 2012). Yet, serious validity concerns complicate the interpretation of the results, as most of them relied solely on hospital- or facility-based data (Dzakpasu et al. 2013), very few studies used rigorous analytical methodology adjusting for underlying trends and autocorrelation (Lagarde 2012; Dzakpasu et al. 2013), and the strong possibility of residual confounding remains (Hussein et al. 2004; Dzakpasu et al. 2013). Thus, empirical evidence of user-fee subsidy policies’ effect on SBA in Sub-Saharan African countries remains weak (Dzakpasu et al. 2012).
Insofar as the user-fee subsidies have an effect on SBA rate, its magnitude remains unknown, especially across socioeconomic status (SES) strata (Mills et al. 2012). Three systematic reviews on SBA subsidy in LMICs produced inconsistent results with respect to potential heterogeneity of effect by SES (Lagarde and Palmer 2011; Ridde and Morestin 2011; Dzakpasu et al. 2013). In Ghana, the policy on free delivery care seemed to yield a greater increase in SBA rate among the poorest (Dzakpasu et al. 2012). In Kenya, there was no apparent difference in the policy’s effect on SBA rates between upper and lower SES strata (Perkins et al. 2009), yet in South Africa, the subsidy policy seemed to mostly favour the well-off (Mills et al. 2012). Evidence of subsidy’s effect across SES remains limited and contradictory, and decision-makers and funders of such policies in Africa need more evaluation results (Ridde et al. 2012).
In Burkina Faso, maternal mortality ratio is 332 per 100 000 live births (Hogan et al. 2010). In that country, SBA consists of obstetric care provided within a health facility by a doctor, registered nurse, midwife, male midwife practitioner or licensed auxiliary midwife (Newlands et al. 2008; Amnistie internationale 2009). In 2007, the government of Burkina Faso introduced a national policy to subsidize SBA (Ministère de la santé du Burkina Faso 2006). The subsidy covers 80% of direct costs for non-indigents (and 100% for indigents) for SBA, at point of service within a primary healthcare center (CSPS, Centre de Santé et de Promotion Sociale). CSPSs are equipped and staffed to deliver basic emergency obstetric care services. Previous evidence suggested that after subsidy introduction, utilization gap across SES remained unchanged in the country’s rural settings (De Allegri et al. 2012).
Taking advantage of the introduction of the user-fee subsidy policy in Burkina Faso in 2007, we carried out a quasi-experimental study to evaluate the immediate and longer-term effect of the policy on SBA rate across socioeconomic strata.
Methods
Data sources
We collected data both at population and health centre levels, in order to produce evidence on the effect of the subsidy policy while controlling for a comprehensive array of determinants of SBA utilization. We carried out our study in the population of 24 rural and 10 semi-urban localities serviced by 27 CSPSs of Houndé and Ziniaré health districts. The Houndé and Ziniaré health districts include rural and semi-urban localities, representative of the socioeconomic, demographic and health characteristics of the population of Burkina Faso living outside the main cities (Banque mondiale 2003). We used a database containing data from two representative surveys conducted in the study population. The first survey, carried out in 2008, was based on a multi-stage random cluster sampling strategy, using probability-proportional-to-size sampling of enumeration areas of the 2006 general population census. About 1517 households were initially selected, of which 1413 (93.1%) were eligible for inclusion on the basis of having one woman of childbearing age (15–49) who experienced at least one childbirth in the 5 years preceding the survey. From those households, 1408 (99.7%) women agreed to participate in the survey.
Data on sociodemographic and economic characteristics of households and women, conditions of childbirth and healthcare-seeking behavior during pregnancy and delivery were collected. The survey also collected information on childbirths that occurred before the subsidy policy introduction. Women were interviewed face-to-face by surveyors using a structured questionnaire, which had been pre-tested on a convenience sample. Surveyors included representatives of Burkina Faso’s Public Health Research Society, Burkina Faso’s National Demography & Statistics Institute and Medical School students, who received extensive methodological training. Quality control, including routine data quality checks, was carried out in the field by controllers. The second survey was conducted in 2010, when the same set of data was collected on childbirths in the 2 years preceding the survey. Nearly three quarters (74%) of women participated in both the first and second surveys. Figure 1 illustrates the data collection process. The observation window covered a 50-month pre-subsidy-introduction period and a 41-month post-subsidy-introduction period.
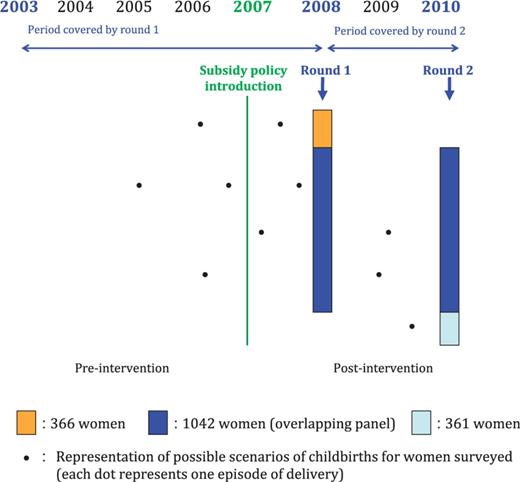
Timeline of data collection
In addition, we used the data from a survey of primary health centers conducted in 2010, which assessed quality of care characteristics of the 27 CSPSs servicing the study areas. Data were collected via a structured questionnaire assessing availability of (1) qualified health professionals, (2) medical equipment and devices and (3) CSPS infrastructure and resources. According to Donabedian’s quality of care model, data collected thus pertain to structural quality of care at primary health facilities (CSPS) level (Donabedian 1988;Villar and Shah 2004; Hotchkiss et al. 2005). (Hussein et al. 2004). CSPSs in Burkina Faso hold records on the availability of equipment and staffing on a yearly basis, for reporting purposes on the health center’s resources deemed essential to cover the ‘basic package of health services’ (Banque mondiale 2003; Nikiema et al. 2010). We thus collected data from the CSPS registers on resources available yearly, from 2003 to 2010.
Study variables
Outcome
SBA status for each episode of childbirth was ascertained during the household survey by asking women if the delivery at issue took place inside or outside a health facility (the corresponding binary variable was coded as Y = 1 for SBA and Y = 0 for absence of SBA). Data on the outcome were missing in 16 observations (0.6%), which were excluded from analysis. We validated self-reported SBA during the primary health centers survey, by verifying the maternity ward registers of a random sample of health centers. We thus ascertained 628 self-reported SBA and 592 (94.3%) were recorded in the maternity ward registries.
Intervention (subsidy policy introduction and maintenance)
Exposure to the subsidy policy was determined according to the date of delivery, in comparison with official introduction of SBA subsidy on March 1, 2007 for Ziniaré and April 1, 2007 for Houndé. Date of delivery was collected by consulting official administrative documents during the household survey, including birth certificate, Burkina Faso’s identity card (CIB), health booklet and immunization record. Data quality checks were also performed to assess consistency with children’s age reported at time of the household survey. Data on date of delivery was missing for 52 observations (1.96%), which were excluded from analysis.
Covariates
Women’s sociodemographic and economic characteristics included age and parity at time of delivery, marital status, occupation, and place of residence. A woman’s autonomy was appraised by self-reported decision-making power in health-seeking behavior. To assess women’s SES, a household poverty index was derived from 13 durable household assets; living conditions; and characteristics of the dwelling using principal components analysis (Gwatkin 2007). Households were categorized as belonging to the lowest SES (below the first quintile), middle SES (≥ 2nd but < the 5th quintile) and highest SES (>5th quintile). Additional covariates included self-reported distance (km) between the household and health center, as well as husband’s age, education, and occupation. Quality of care provided at health center level was estimated by means of its structural components (Donabedian 1988; Villar and Shah 2004; Hotchkiss et al. 2005). The first quality of care proxy was the professional skill mix in CSPS: four professionals, namely a midwife, registered nurse (RN), auxiliary midwife (AM) and itinerant health agent (IHA); vs three professionals (RN, AM, IHA); vs one or two professionals (RN and/or AM). The second category of proxy related to health centers’ infrastructure (functional source of water in CSPS), and the last category related to medical equipment (sphygmomanometer, speculum).
The study was approved by the ethics committees of Burkina Faso’s Ministry of Health (MOH) and Ministry of Higher Education and Scientific Research, and University of Montreal Hospital Research Center (CRCHUM). Informed consent was obtained from all participants and heads of households.
Statistical analysis
The unit of analysis was childbirth episode, for a total sample size of 2655. Descriptive statistics were produced to describe the sociodemographic and economic characteristics of the participants. Next, we fitted multilevel modified Poisson regression models with robust variance estimators to estimate the rate ratios (RRs) quantifying the association between user-fee subsidy and SBA as a function of time since subsidy introduction and SES (Zou 2004; Rabe-Hesketh and Skrondal 2012). We used segmented regression analysis to control for secular trends and adjust for serial correlation of observations (Lagarde 2012). Time (in months) since the start of the observation period was modeled as a continuous variable. To estimate the change in SBA rate after the subsidy, we also included a variable representing time since the onset of the intervention (postslope), and fixed the latter to 0 for the pre-subsidy introduction period (Lagarde 2012). A hierarchical order of variables was classified from childbirths (repeated measures, level 1) nested in women (level 2), further nested in servicing areas of CSPS (level 3). We tested the fit of nested models using likelihood ratio (LR) tests. Potential multicollinearity of independent variables was assessed by estimating variance inflation factors.
In this model, β1jk estimated the secular trend in SBA rate; β2jk estimated the immediate effect of subsidy introduction on SBA rate; β3jk is associated with time post-subsidy introduction or change in SBA rate after subsidy introduction (Lagarde 2012); and β5jk represented the coefficient of the interaction between subsidy and SES. The reference socioeconomic category was lowest-SES. The partially-adjusted regression model included time and SES level, while the fully-adjusted model also included woman’s age at the time of delivery, education, place of residence, distance to health center, health district, health center’s staff skill mix, and functional access to water. We used the Wooldridge test to assess residual autocorrelation in the errors of the regression model. In addition, we fitted logistic models to estimate odds ratios (ORs).
Furthermore, we estimated absolute rate differences (RDs) based on marginal outcome predictions as a function of covariates and time since introduction of the policy, under the scenarios of: (1) actual exposure to subsidy; and (2) counterfactual non-exposure to subsidy in the post-intervention period. To this end, we carried out model-based standardization, with the post-intervention experience serving as the (implicit) standard experience (Rothman et al. 2008). We computed the probability of SBA for each woman in the post-intervention period while setting the policy status to 0 and 1, and estimated the predicted SBA rates by averaging these probabilities across the observations for both of the scenarios (Wilcosky and Chambless 1985; Ahern et al. 2009). We estimated the expected rates of SBA in the post-subsidy-introduction period under the counterfactual scenario of the subsidy not having been introduced in this population, thus enabling the causal interpretation of estimated changes in SBA rates (Ahern et al. 2009; Steinhardt et al. 2011; Dzakpasu et al. 2012; Lagarde et al. 2012). To our knowledge, there was no other major intervention targeting SBA during the time period at issue in Ziniaré and Houndé districts, so we believe that the presumption that the pre-existing trend would have continued in the post-policy time period is reasonable. Our data collection and analysis strategy, along with the multilevel modeling approach, also served as the basis for assessing the presumptions to be met in order to allow interpretation of the contrast between the observed and predicted rates causally: temporality, stability assumption and experimental treatment assignment assumption (Ahern et al. 2009).
Data analysis was performed using GLLAMM (generalized linear latent and mixed models) programme using Stata IC 12.0 (StataCorp LP).
Results
Descriptive statistics are provided in Table 1. The distribution of covariates in observations occurring before and after subsidy introduction was largely similar. Nevertheless, after subsidy introduction, participants were more likely to live in rural areas (49% before vs 61% after), and health centers were more likely to provide care through four professionals including a midwife (15% before vs 24% after) and to have a functional access to water (52% before vs 66% after). Table 2 presents the estimated regression coefficients of the multilevel log-linear regression model (Lagarde 2012), partially- and fully-adjusted. The results of the LR tests for nested models were statistically significant (P < 0.001), as was the result of the omnibus test of interaction between subsidy and SES (P = 0.014). Results from the fully adjusted regression model indicate a statistically significant upward secular trend in SBA rate (P = 0.028).
Sociodemographic and economic characteristics
| Characteristic | Pre-subsidy introduction | Post-subsidy introduction | Total | P value |
|---|---|---|---|---|
| n = 1260 | n = 1395 | n = 2655 | ||
| Woman's age (%) | <0.001 | |||
| 15–19 | 14.3 | 11.9 | 13.1 | |
| 20–29 | 61.3 | 56.3 | 58.7 | |
| 30–49 | 24.4 | 31.8 | 28.2 | |
| Woman's parity (%) | 0.004 | |||
| Nulliparous | 22.1 | 17.1 | 19.5 | |
| 1–4 | 51.9 | 56.0 | 54.0 | |
| 5–8 | 26.0 | 26.9 | 26.5 | |
| Socioeconomic status (SES)(%) | 0.947 | |||
| Lowest SES | 20.7 | 20.9 | 20.8 | |
| Middle SES | 61.4 | 61.9 | 61.7 | |
| Highest SES | 17.9 | 17.3 | 17.5 | |
| Woman's literacy (%) | 0.695 | |||
| Illiterate | 64.7 | 65.8 | 65.3 | |
| Woman's education (%) | 0.184 | |||
| No education | 74.0 | 76.1 | 75.2 | |
| Primary | 15.8 | 16.1 | 15.9 | |
| Secondary or higher | 10.2 | 7.8 | 8.9 | |
| Woman's occupation (%) | <0.001 | |||
| Homemaker | 28.2 | 26.8 | 27.5 | |
| Agriculture | 33.6 | 41.8 | 37.9 | |
| Commerce | 24.4 | 16.1 | 20.0 | |
| Remunerated profession or service | 13.8 | 15.3 | 14.6 | |
| Woman's decision making power (%) | 0.104 | |||
| Woman's decision | 25.2 | 21.8 | 23.4 | |
| Husband's or other's decision | 74.8 | 78.2 | 76.6 | |
| Marital status (%) | 0.101 | |||
| Monogamous | 45.4 | 48.6 | 47.1 | |
| Polygamous | 34.4 | 32.5 | 33.4 | |
| Unmarried union | 18.1 | 17.5 | 17.8 | |
| Other | 2.1 | 1.4 | 1.7 | |
| Husband's education (%) | 0.151 | |||
| No education | 70.1 | 67.7 | 68.9 | |
| Primary | 18.3 | 21.2 | 19.8 | |
| Secondary or higher | 11.6 | 11.1 | 11.3 | |
| Husband's occupation (%) | 0.402 | |||
| Unemployed | 19.4 | 19.2 | 19.3 | |
| Agriculture | 63.8 | 65.8 | 64.9 | |
| Commerce or profession or service | 7.9 | 8.3 | 8.1 | |
| Association or other | 8.9 | 6.7 | 7.7 | |
| Place of residence (%) | <0.001 | |||
| Rural | 48.9 | 60.6 | 55.0 | |
| Semiurban | 51.1 | 39.4 | 45.0 | |
| Distance to health center (%) | 0.006 | |||
| In area (≤ 1 km) | 26.3 | 21.9 | 24.0 | |
| 1 < 5 km | 47.4 | 52.0 | 49.8 | |
| 5 < 10 km | 16.9 | 14.2 | 15.5 | |
| ≥10 km | 9.4 | 11.9 | 10.7 | |
| Health district (%) | 0.907 | |||
| Ziniaré | 57.3 | 55.8 | 56.3 | |
| Houndé | 42.7 | 44.2 | 43.5 | |
| Professional skill mix in CSPSa (%) | <0.001 | |||
| Four professionals | 14.9 | 24.5 | 19.9 | |
| Three professionals | 62.2 | 60.5 | 61.3 | |
| One to two professional(s) | 22.9 | 15.0 | 18.8 | |
| Access to water in CSPS (%) | <0.001 | |||
| Functional | 51.9 | 66.3 | 59.3 | |
| Absence or non-functional | 48.1 | 33.7 | 40.6 |
Unit of observation=childbirths, aCSPS = primary health center (centre de santé et de promotion sociale).
Results of multivariable multilevel log-linear regression models of the rate of skilled birth attendance as a function of subsidy introduction and time
| Variable | Partially adjusted model | Fully adjusted modela | ||||
|---|---|---|---|---|---|---|
| Coefficient | SE | P value | Coefficient | SE | P value | |
| Intercept | −0.7390 | 0.1456 | 0.000*** | −0.5169 | 0.1258 | 0.000*** |
| Time since beginning of observation period (months) | 0.0022 | 0.0012 | 0.06 | 0.0032 | 0.0014 | 0.028* |
| Subsidy introductiona | 0.2679 | 0.0858 | 0.002** | 0.2129 | 0.086 | 0.013* |
| Socioeconomic status (SES) (ref = lowest) | ||||||
| Middle SES | 0.2043 | 0.0758 | 0.007** | 0.1681 | 0.0685 | 0.014* |
| Highest SES | 0.3105 | 0.0885 | 0.000*** | 0.2127 | 0.0724 | 0.003** |
| Subsidy* Middle SES | −0.1769 | 0.0730 | 0.015* | −0.1301 | 0.077 | 0.089 |
| Subsidy* Highest SES | −0.2927 | 0.0843 | 0.001** | −0.2018 | 0.0813 | 0.013* |
| Time since subsidy introduction (months) | −0.0018 | 0.0015 | 0.23 | −0.0025 | 0.0019 | 0.184 |
| Woman’s age (ref = 15–19) | ||||||
| 20–29 | −0.0742 | 0.0262 | 0.005** | |||
| 30–49 | −0.0676 | 0.0272 | 0.013* | |||
| Maternal education (ref = none) | ||||||
| Primary | 0.0869 | 0.0268 | 0.001** | |||
| Secondary or higher | 0.0614 | 0.0235 | 0.009** | |||
| Place of residence (ref = rural) | ||||||
| Semiurban | 0.1041 | 0.0597 | 0.081 | |||
| Health district (ref = Ziniaré) | ||||||
| Houndé | 0.0146 | 0.0635 | 0.818 | |||
| Distance to health center (ref = ≤ 1 km) | ||||||
| 1 < 5 km | −0.0574 | 0.0341 | 0.092 | |||
| 5 < 10 km | −0.2177 | 0.0657 | 0.001** | |||
| ≥10 km | −1.1213 | 0.1962 | 0.000*** | |||
| Professional skill mix (ref = 1–2 professional(s)) | ||||||
| Three professionals | 0.1293 | 0.0509 | 0.011* | |||
| Four professionals | 0.0380 | 0.0838 | 0.650 | |||
| Functional access to water (ref = absence or non-functional) | −0.0289 | 0.0631 | 0.647 | |||
| Random-effects parameters | ||||||
| Health center level (εook) | 0.2650 | 0.1523 | 3.06e − 15 | 8.98e − 13 | ||
| Women level (μ0jk) | 6.31e − 25 | 4.29e − 21 | 1.21e − 22 | 3.28e − 20 | ||
Notes.aChange for the lowest SES households. *P < 0.05, **P < 0.01, ***P < 0.001.
The adjusted RRs based on these models, speaking to the effect of subsidy introduction on SBA rates as a function of time and SES level, are presented in Table 3 and Figure 2. Results show that among lowest-SES women, immediately upon introduction of the subsidy policy, the adjusted rate of SBA was 45% (95% CI = 19–77%) greater than the corresponding frequency under the scenario of the policy not having been introduced. The magnitude of the adjusted RR was sustained over time, with the adjusted rate (95% CI) being 46% (20–78%) higher at 6 months, 47% (20–78%) higher at 1 year and 48% (21–81%) higher at 2 years after policy introduction, compared with their respective expected counterparts under the counterfactual scenario of non-introduction of the subsidy. Among middle-SES women, the RR estimates also indicated an increase in SBA rate immediately upon the policy introduction: RR (95% CI) = 1.28 (1.09–1.49). The magnitude of the adjusted RR estimates was sustained over time: RR at 6 months = 1.28 (1.10–1.49), RR at 1 year = 1.29 (1.11–1.50), and RR at 2 years = 1.30 (1.11–1.51). For highest-SES women, the estimates were RR = 1.19 (1.02–1.38) immediately upon the policy introduction 38), RR = 1.19 (1.03–1.37) at 6 months, RR = 1.20 (1.04–1.37) at 1 year and RR = 1.21 (1.06–1.38) at 2 years. In addition, the adjusted ORs based on logistic regression models are included in Table 4.
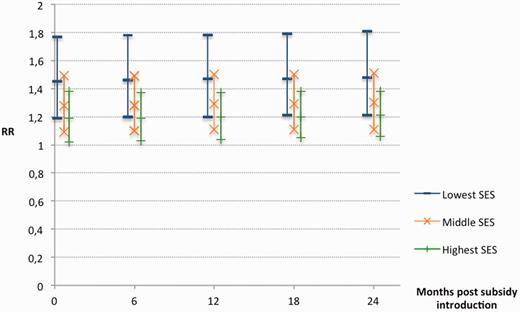
Estimated rate ratio (RR) and 95% confidence intervals for association between subsidy introduction and SBA over time, according to the SES stratum
Rate ratio (RR) and rate difference (RD) with the corresponding 95% confidence intervals (CI) for association between subsidy introduction and skilled birth attendance over time, across the socioeconomic status strata
| Time since subsidy introduction (months) | Lowest SES | Middle SES | Highest SES | |||
|---|---|---|---|---|---|---|
| RR (95% CI) | RD (95% CI) | RR (95% CI) | RD (95% CI) | RR (95% CI) | RD (95% CI) | |
| 0 | 1.45 (1.19–1.77) | 14.0% (3.5–24.5%) | 1.28 (1.09–1.49) | 6.7% (−2.7 to 16.2%) | 1.19 (1.02–1.38) | 1.0% (−8.1 to 10.1%) |
| 6 | 1.46 (1.20–1.78) | 14.1% (3.5–24.6%) | 1.28 (1.10–1.49) | 6.8% (−2.6 to 16.2%) | 1.19 (1.03–1.37) | 1.0% (−8.1 to 10.2%) |
| 12 | 1.47 (1.20–1.78) | 14.1% (3.6–24.6%) | 1.29 (1.11–1.50) | 6.8% (−2.6 to 16.3%) | 1.20 (1.04–1.37) | 1.0% (−8.1 to 10.2%) |
| 18 | 1.47 (1.21–1.79) | 14.2% (3.6–24.7%) | 1.29 (1.11–1.50) | 6.8% (−2.6 to 16.3%) | 1.20 (1.05–1.38) | 1.1% (−8.1 to 10.2%) |
| 24 | 1.48 (1.21–1.81) | 14.2% (3.7–24.8%) | 1.30 (1.11–1.51) | 6.9% (−2.6 to 16.3%) | 1.21 (1.06–1.38) | 1.1% (−8.1 to 10.3%) |
Estimated odds ratios (OR) with the corresponding 95% confidence intervals (CI) for association between subsidy introduction and skilled birth attendance over time, accross the socioeconomic status strata
| Time since subsidy introduction (months) | Lowest SES | Middle SES | Highest SES |
|---|---|---|---|
| OR (95% CI) | OR (95% CI) | OR (95% CI) | |
| 0 | 5.90 (3.05–11.42) | 4.37 (2.12–9.04) | 2.11 (0.80–5.52) |
| 6 | 6.01 (3.17–11.40) | 4.46 (2.24–8.87) | 2.15 (0.83–5.55) |
| 12 | 6.13 (3.21–11.71) | 4.54 (2.32–8.92) | 2.20 (0.85–5.69) |
| 18 | 6.25 (3.17–12.35) | 4.72 (2.29–9.76) | 2.28 (0.83–6.30) |
| 24 | 6.38 (3.05–13.33) | 4.91 (2.08–11.61) | 2.37 (0.76–7.41) |
Figure 3 presents the marginal rates of SBA plotted as a function of time for the entire population. The observed rates (smoothed by regression modeling) correspond to the factual scenario of subsidy introduction in 2007, and are contrasted with the corresponding expected rates under the counterfactual scenario of no subsidy introduction in the post-intervention period. Throughout the post-intervention period, the observed SBA rate under the subsidy introduction were consistently higher than the expected rates under the counterfactual scenario of non-introduction of the subsidy. Table 3 and Figure 4 illustrate the SES-stratum-specific results of the corresponding sets of analyses. At the time of introduction of the subsidy policy, the SBA rates for women of lowest, middle and highest SES level were, respectively, 59, 78 and 94%. For lowest- and middle-SES women, the observed SBA rates under subsidy exposure were consistently higher than the rates expected in the absence of the subsidy introduction. For lowest-SES women, the adjusted RD was 14% (95% CI = 3–24%) immediately after introduction of the subsidy policy. The magnitude of the adjusted RD estimates (95% CI) was sustained over time: RD = 14% (4–25%) 1 year after subsidy policy introduction, and RD = 14% (4-25%) at 2 years. For middle-SES women, the corresponding estimates (95% CI) were: RD immediately after policy introduction = 7% (−3 to 16%), RD at 1 year = 7% (−3 to 16%) and RD at 2 years = 7% (−3 to 16%). For highest-SES women, immediate RD (95% CI) = 1% (−8 to 10%), RD at 1 year = 1% (−8 to 10%) and RD at 2 years = 1% (−8 to 10%), respectively.
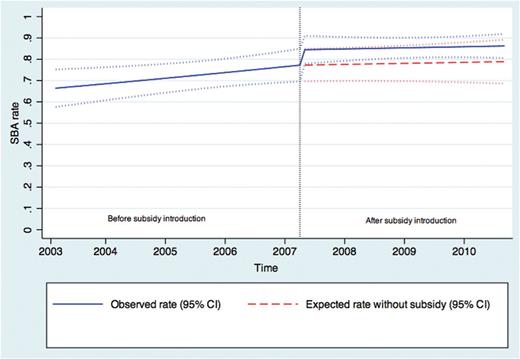
Overall observed and expected SBA rates with and without subsidy introduction
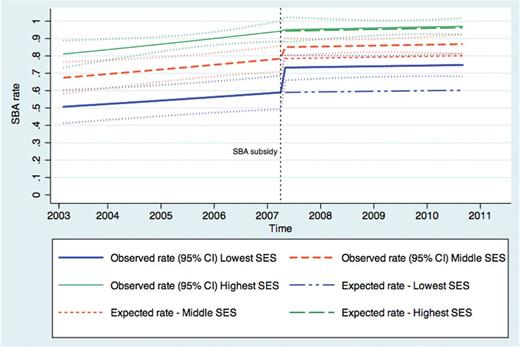
Observed and expected SBA rates with and without subsidy introduction, by SES
Discussion
Our study suggests that the introduction of the user-fee subsidy policy in Burkina Faso in 2007 resulted in increased SBA rate in the population, across all SES strata. The estimated effect was strongest in the poorest women. Furthermore, our results suggest that the effect of the subsidy policy was sustained over time after introduction of the policy, even showing a tendency towards increased magnitude.
Our findings are consistent with prior evidence of the policy’s effects in other districts of Burkina Faso (Ridde et al. 2011; De Allegri et al. 2012). The sustained effect over time is also consistent with recent findings from Burkina Faso. For example, Johri et al. (2014) suggested increased SBA utilization following the subsidy policy, with increased magnitude over time (Johri 2014). The upward trend in SBA rate before subsidy introduction documented in our study is also consistent with prior data from Burkina Faso suggesting that the increase in SBA started before subsidy policy introduction (Ridde et al. 2011).
The greater increase in propensity to use SBA services among poorest women implies an apparent decline in socioeconomic inequities in accessing obstetric care services in Burkina Faso. Previous evidence also suggested that Ghana’s policy on free delivery care yielded a greater increase among the poorest (Dzakpasu et al. 2012). Nevertheless, there remains an important gradient in SBA rate according to SES in Burkina Faso. Our study suggests the existence of persistent socioeconomic inequities even after adjusting for distance and subsidy, indicating that women’s contributive capacity likely remains a constraint. The evidence supporting the existence of the socioeconomic gradient is in line with previous reports for Western Africa (Stephenson et al. 2006; Say and Raine 2007). Partial subsidy thus seems a necessary but not sufficient condition for universal SBA utilization.
Furthermore, our study suggests that geographic accessibility remains a strong barrier to SBA utilization in Burkina Faso, which is also consistent with prior evidence (Amooti-Kaguna and Nuwaha 2000; Hounton et al. 2008). Policies aimed at increasing obstetric care accessibility should also consider the strong geographic barrier; subsidies should cover transportation expenses, and CSPS availability should be considered, particularly in rural areas.
Strengths of our study include its large sample size, high response rates, and reliance on a comprehensive database. Further strengths include its analytical features, such as the multilevel modeling approach accounting for autocorrelation (Lagarde 2012), adjustment for the underlying time trend and a number of potential confounders, assessment of both short- and long-term effects (Dzakpasu et al. 2013), and estimation of absolute rates under the counterfactual scenario of no subsidy introduction during the study period (Ahern et al. 2009; Dzakpasu et al. 2013).
A limitation to our study is the retrospective assessment of some childbirth characteristics, introducing the possibility of recall bias, particularly for the 2008 survey. Yet, the assumption of time-invariance for covariates such as education and SES is fairly robust, as socioeconomic determinants are considered very stable in rural and semi-urban settings over a relatively short period of time (Say and Raine 2007). Nevertheless, insofar as some characteristics were documented with errors, those errors would most likely be non-differential, which would have biased our results towards the null (Rothman et al. 2008). Furthermore, we cannot exclude the possibility of misclassification of the structural quality of care components, which were estimated on a yearly basis. As proxies for structure quality of care, the indicators measured also have content validity limitations, as they do not estimate process quality of care nor perceived quality of care. Yet, we cannot exclude the possibility that improvements in health services delivery and health facilities might have played a role in the observed increase in SBA rates, via improved process and structural quality of care (Donabedian 1988). For instance, the likelihood of receiving care by additional healthcare professionals after the introduction of the policy might have had an impact on the increase in SBA rates. Another limitation is the loss to follow-up between 2008 and 2010 data collection rounds. Attrition was slightly higher in semi-urban localities, where women tend to have higher SBA rates (Gabrysch and Campbell 2009). Should loss to follow-up introduce a bias in ours results, the latter would also tend towards the null (Rothman et al. 2008). Finally, the validity of our results and the causal interpretation of the estimated post-intervention change in SBA rates depend on the presumption that extrapolation of the pre-existing trend in SBA rate into the post-intervention segment of time was warranted.
Conclusions
Obstetric services utilization remains a critical issue in Sub-Saharan Africa. The effect of subsidy policy in increasing SBA yields the potential to significantly reduce maternal morbidity and mortality (De Allegri et al. 2012). Nevertheless, medically assisted deliveries still represent the largest disparity in health services utilization between women of the highest and lowest SES in Sub-Saharan Africa (Gwatkin 2007). Also, more efforts are needed in research, policy and programming to foster equity in SBA. Policies and programmes to increase accessibility to obstetric services should also address nonmedical costs such as food and lodging attributed to patients' and their family's health care needs, and opportunity costs for the household. For instance, previous evidence suggests that demand-side financing programmes, such as vouchers covering transportation to a health centre, are effective in reducing inequities in institutional delivery (Ir et al. 2010; Agha 2011). Previous studies also speak to the impact of participatory women’s groups in improving equity in maternal and neonatal health outcomes (Manandhar et al. 2004; Houweling et al. 2013).
Our findings support the effectiveness of subsidizing maternal health services, with important implications for evidence-informed maternal health policymaking in Burkina Faso and other countries in Sub-Saharan Africa. While a few countries in the region have already adopted a form of national health insurance scheme, including Ghana, Nigeria, Kenya and Rwanda (Rodin and de Ferranti 2012), thorough efforts towards equitable use of obstetric services will have to be taken by Sub-Saharan Africa’s policy makers to place the region on the path of universal healthcare coverage.
Acknowledgements
We express our warmest gratitude to the Houndé and Ziniaré women and communities for their most valuable participation in this research project, along with the CSPS and CMA health professionals and the health districts managers and decision-makers. We thank the team of surveyors, controllers and supervisors for their work on the field. Special recognition is provided to Adama Tiendrebeogo, Boubacar Ouedraogo, Bernard Sawadogo and Narcisse Kam for the paramount input they provided to this project. We wish to thank Dr Zubin Shroff for revision and proof-reading of this article.
Funding
This work was supported by the International Development Research Center (IDRC), namely the study entitled Étude sur la problématique du choix des interventions de réduction de la mortalité maternelle au Burkina Faso, of which A.B. was the principal investigator. E.V.L. was affiliated with the University of Montreal Hospital Research Center while conducting this study, and received funding through the Frederick Banting and Charles Best Canada Graduate Scholarship of the Canadian Institutes for Health Research (CIHR); the International Development Research Center (IDRC); and the Global Health Research Capacity Strengthening Program (GHR-CAPS).
Ethical approval
The study was approved by the ethics committees of Burkina Faso’s Ministry of Health (MOH) and Ministry of Higher Education and Scientific Research, and University of Montreal Hospital Research Center (CRCHUM). Informed consent was obtained from all participants and heads of households.
Conflict of interest statement. None declared.
