


Introduction
The first cancer-specific alternative payment pilot from the Centers for Medicare and Medicaid Innovation began with the Oncology Care Model (OCM; 2016–2022),1 followed by its successor after a 1-year break, the Enhancing Oncology Model (EOM; 2023).2 These voluntary programs provide monthly payments to support practice redesign, but ask providers to reduce expenditures for assigned Medicare beneficiaries—eventually holding them financially responsible for reducing expenditures. Providers could join or withdraw at any point. Cost and utilization outcomes of OCM have been studied,3 but we noted declining provider participation over time. We investigated trends of participation in these oncology payment models.
Data and methods
We assembled intermittently published lists of participating providers from 2016, 2019, 2022, and 2023. The lists included provider name and address but no dates of program entry or exit. Data were gathered from October through November, 2023, and analyzed from November to May 2024.
Study team members (S.B., A.S.H.) used provider websites and press releases to identify whether providers changed names/consolidated while continuing participation. Group practices were combined with affiliated hospitals.
We matched to a directory of Medicare-participating providers4 to identify ownership (for-profit vs nonprofit), and confirmed nonprofit status using Candid.org. We defined academic providers as members of the Association of American Medical Colleges.
We used this longitudinal provider list to examine trends in provider group participation, and stratified trends of participation across these 2 characteristics. We modeled the decline in provider participation between 2016 and 2023 by adjusting for standard errors for multiple observations contributed by the same provider over time, using generalized linear mixed models, adjusting for the proportion of academic and nonprofit providers.
We used SAS (version 9.4; SAS Institute, Cary, NC) and Microsoft Excel (Microsoft Corporation, Redmond, WA) for data processing, then R (version 4.4.0; R Foundation for Statistical Computing, Vienna, Austria) for modeling (eSupplement Methods for modeling details, R code). The University of Texas Southwestern Institutional Review Board deemed this non-human research (Y1-23-0438).
Results
The OCM started with 197 unique providers in 2016; this fell by 9.2% to 178 in 2019, and by another 30.0% to 125 in 2022, with only 44 remaining by the start of the EOM in 2023, a total decline of 78%. This included 12 providers new to the EOM.
The proportion of nonprofits fell from 27.9% (n = 55) in 2016 to 27.4% (54) in 2019, 18.8% (37) in 2022, and 18.2% (8) of providers by 2023. The proportion of academic providers slightly increased from 18.4% (n = 36) in 2016 to 19.3% (38) in 2019, then fell to 14.2% (28) in 2022, and down to 6.1% (12) by 2023 (Figure 1).
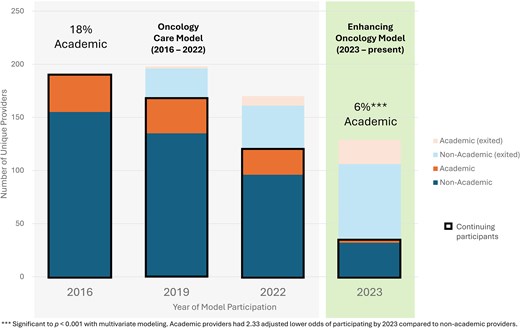
Medicare cancer value-based model participation trend, academic medical centers vs non-academic centers. The proportion of academic medical center provider groups participating in the Oncology Care Model (2016–2022) and its successor program, the Enhancing Oncology Model (2023–present), compared with non-academic providers is shown. Academic providers had 2.33 lower adjusted odds of participating in oncology value-based care programs by 2023 compared with non-academic providers.
Mixed-effects modeling detected no statistically significant difference in nonprofit participation from 2016 to 2023 (adjusted odds ratio: −0.68; 95% CI: −2.00 to 0.65; P = .32), but academic providers from 2016 had 2.33 lower odds (95% CI: −4.06 to −0.58; P < .001) of continuing to participate through the start of the EOM in 2023 compared with non-academic providers.
Discussion
Nearly 8 in 10 providers that started in the OCM exited by the start of the EOM. Nonprofit and academic provider participation declined markedly after 2019 and into the EOM. Although many EOM participants are large multisite practices with high patient volumes,5 selective provider exit raises questions about the challenges of these payment models and their impact. Although the gap year between programs may have accelerated EOM non-participation, participation was falling before this.
The pattern of academic non-participation should be concerning since academic providers constitute the bulk of National Cancer Institute Cancer Centers and generate much of the published clinical and care delivery research. Academic medical centers face challenges participating in value-based models,6 including cross-subsidized education and research missions from clinical revenue. It is also possible that their clinical breadth leads to involvement in other value-based contracts, limiting their ability to focus on oncology-specific programs.
We are not aware of other reports on this trend in provider participation, although others5 have noted that non-academic providers had greater cost savings during the OCM.
A key limitation of our study is that we did not know the reasons providers dropped out, or the reason others never participated. However, reasons for non-participation may be multiple. We also were unable to assess other provider characteristics, such as number of oncologists or Medicare beneficiaries served.
Balancing voluntary participation with increased spending reduction is difficult, but policymakers should consider the unintended consequences of further bifurcating academic and non-academic providers. Indeed, in response to feedback7 from non-participating providers, EOM financial incentives and model duration were substantially increased for 2025.8
Future work should explore how selective provider exit affects specific populations,5 and how the new EOM changes impact participation going forward.
Supplementary material
Supplementary material is available at Health Affairs Scholar online.
Funding
A.S.H. was supported by grant R01CA282242 from the National Cancer Institute, Clinician Scientist Development Grant CSDG-20-023-01-CPHPS from the American Cancer Society, the Texas Health Resources Clinical Scholars Program, and grant P30CA142543 from the National Cancer Institute. The content is solely the responsibility of the authors and does not necessarily represent the official views of Texas Health Resources, University of Texas Southwestern Medical Center, Parkland Health, the National Institutes of Health, the Agency for Healthcare Research and Quality, or the American Cancer Society. The funders had no role in the design and conduct of the study; collection, management, and analysis, and interpretation of the data; preparation, review, or approval of the manuscript; or decision to submit the manuscript for publication.
Notes
Author notes
Conflicts of interest: Please see ICMJE form(s) for author conflicts of interest. These have been provided as supplementary materials.
