


Abstract
Expressed sequence tags (ESTs) are widely used in gene survey research these years. The EST Pipeline System, software developed by Hangzhou Genomics Institute (HGI), can automatically analyze different scalar EST sequences by suitable methods. All the analysis reports, including those of vector masking, sequence assembly, gene annotation, Gene Ontology classification, and some other analyses, can be browsed and searched as well as downloaded in the Excel format from the web interface, saving research efforts from routine data processing for biological rules embedded in the data.
Introduction
Accompanied with the increased EST sequences in recent years, many bioinformatical analysis tools were designed for various purposes. Here comes a problem that most biologists would encounter when facing these tools: how to use them? Recently, some research groups have published their automated or semi-automated procedures for EST data analysis, such as ESTAP (1), and some other web-based systems (2). However, the graphical view, the well organized and connected list views, the output capability, and the job logging systems make our EST Pipeline System more effective and user-friendly. The system was initially developed in 2001 by Hangzhou Genomics Institute (HGI), and its software register number was 2002SR2503 issued by National Copyright Administration of P. R. China in 2002. A new version, EST Pipeline System 2.0, is under its finish phase. This paper mainly describes the feature and function of the version 1.0.
The EST Pipeline System is designed to solve some problems for scientists who are not familiar with those software tools. The system combines bioinformatics tools like BLAST (3, 4), Phred (5, 6), Pfam (7), Crossmatch, Phrap (Phil Green, unpublished), Cap3 (8), and scripts of its own to make sure that the system can do a mining job in EST sequences automatically. Scientists who use this system only need to choose analysis tools and parameters, and then the Pipeline will do all the rest work and present the detailed and well organized information for users, so that scientists could focus on the biological aspect of their projects, saving time from routine data processing work.
Features of the EST Pipeline System
The EST Pipeline System is composed of web interface, Perl script, third-party bioinformatics software and database. It is easy to operate on the web interface for submitting jobs, selecting result formats, as well as searching the information. Jobs are executed by Java EJBs, which embed some third-party software like BLAST, Phred, Pfam, Crossmatch, Phrap, Cap3, and the raw results are parsed by Perl scripts to be loaded into the Mysql or Oracle relational database. The web interface uses JSP scripts to communicate with EJB and database. Because most of the programming languages we used are platform independent, such as JAVA and Perl, the EST Pipeline System could be executed under most operating systems, including Windows, AIX, Linux, Solaris and so on.
Job submission
The process of EST sequence analyses is a pipeline that goes through analysis modules systematically. The pipeline provides a detailed job-submitting page showing the default parameters first. All the parameters of analysis tools are designed in web interface and could be changed easily by users if necessary. Each library has its job logging system that shows what analyses in the pipeline have been done. The default data flow goes through the SequenceStat module for sequence data integrity check, the AssembleStat module for assembly and chimeric contig check, the Lable module for annotation and the GOTREE module for gene function classification.
Processing of EST sequence raw data
The first analysis after job submission by users is to check the sequence input. The pipeline accepts three kinds of input. The first kind is chromat-files; the second kind is sequence files plus quality files; and the third kind is sequence files only. The SequenceStat module will check sequence name duplication, and the consistence between the sequence file and the quality file. CROSSMATCH (Phil Green, unpublished, http://bozeman.mbt.washington.edu/phrap.docs/phrap.html) is used to mask vector sequences into “X”. Other masked sequences such as the E. coli genome sequence and simple repeat database are provided as an option. Users can also define their own screening sequences. Then the report of the masked sequences will be imported into the database by the SequenceStat module. The last step is to filter sequences that are shorter than 100 bp (by default) after trim cut-off and vector masking. Users are able to change the length threshold of filtered sequences. Only the cleansed sequence data will go on to the assembly module.
Sequence assembly
The AssembleStat module calls PHRAP (Phil Green, unpublished, http://bozeman.mbt.washington.edu/phrap.docs/phrap.html) or CAP3 to assemble the EST sequences into consensi (contigs) according to the user preference, and distills the assembly information. This module is also able to check the quality of each contig, by comparing its member ESTs to its consensus sequence. Contigs suspected to be chimerics will be re-assembled.
Gene annotation
The Pipeline firstly uses similarity search tools such as BLAST to find homology for the checked contigs in the NCBI non-redundant protein and nucleotide databases (9) and the SWISS-PROT protein database (10). Then the Pipeline uses HMMPFAM (11) to search protein domains in each contig. The BLAST and HMMPFAM E-values can be adjusted by users. According to the homology information, the species, the gene description, E-values, and bit scores will be taken into account to define the final annotation by the Lable module. Notably, there are two user-definable similarity searches using databases of special interest.
Gene classification
The Gene Ontology is composed of networked key words describing the molecular functions, biological processes, and cellular components property of genes (12). The GOTREE module draws a tree view of the contigs according to their annotation and GO ID assignment. Each GOTREE branch will hierarchically indicate the function of the annotated contigs.
Database
The EST Pipeline System uses Oracle or MySQL relational database, which users could choose between the advantage of reliability, or speed. Perl modules import the parsed results into database automatically.
Web Interface of the EST Pipeline System
Every user has a unique ID to enter the pipeline system. After logging in, the index page shown in Figure 1 will introduce the main report pages in the pipeline, which include the Library View, Contig View, Sequence View, and Gene Catalogue View.
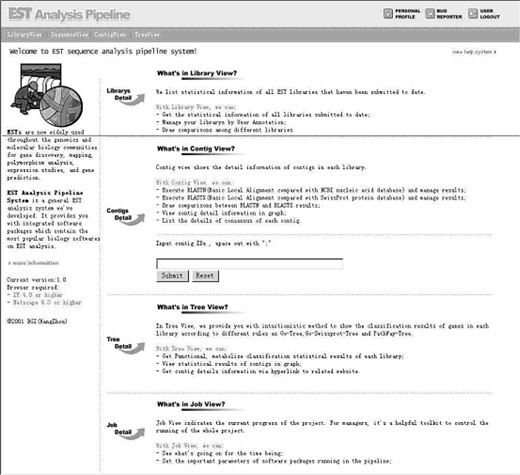
The index page of the EST Pipeline System. Users can get concise information of each view.
Library View
The Library View shows the information about all the libraries belonging to a user. It includes the summary of EST sequences’ number, unique gene number, and some other descriptive information about the organism, tissue, period, etc. of each library (Figure 2).

The Library View. We used the rice EST project as an example. There are two species, indica and nipponbare, in this project. We could easily tell the information of each library from this view, and then choose the library which we are interested in to view more detailed results in detailed library view, sequence view and contig view.
The detailed library view shows up when the ‘detail’ button is clicked, which includes plots of distribution of the average sequence quality (Figure 3), distribution of the sequence length (Figure 4), the gene expression view (Figure 5), and the GC Content view (Figure 6).
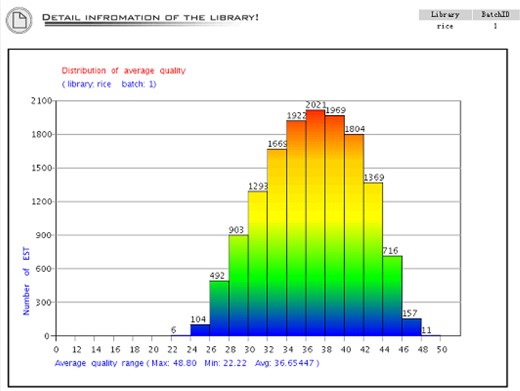
The distribution of average sequence quality. The X-axis is the quality from 0 to 50. This figure shows that all the quality of the sequences is above 20 because the system cuts off the low-quality bases, which is re-definable during base-calling. The Y-axis is the number of sequence in each range of the average quality.
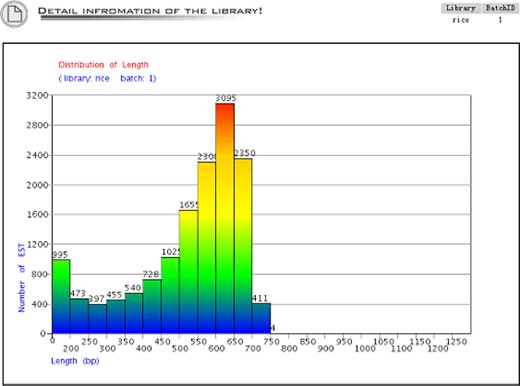
The distribution of sequence length. The X-axis is the sequence length and the Y-axis is the number of the sequence within the range of sequence length.
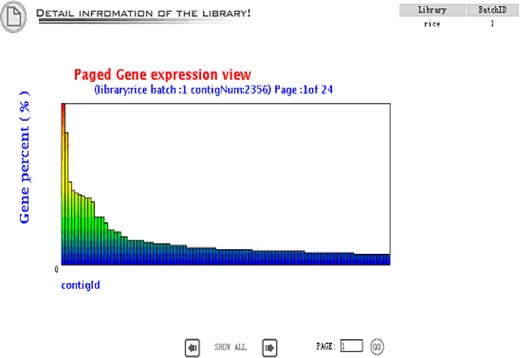
Gene expression view is an overview of the gene expression profile in the library. The gene abundance means the contig size divided by the total EST number in the library.
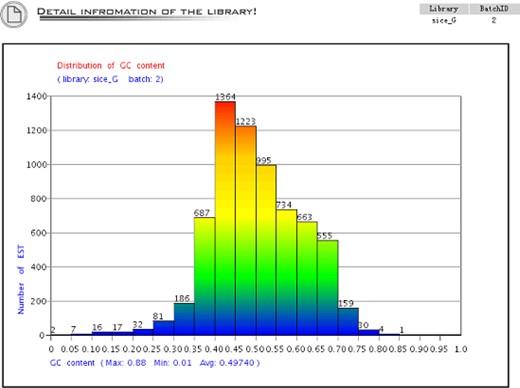
The distribution of the GC content. The X-axis is the GC content and the Y-axis is the sequence number of the GC content.
Sequence View
The Sequence View describes detailed information about the EST sequences. Columns listed in the view show the length, quality, GC content, and other detailed information of every EST sequences. The sequence length includes raw length and trimmed length (or effective length). The former is the length from base-calling, and the later means the sequence length after ignoring “X” and “N” in masked result from CROSSMATCH. All the sequences could be searched and sorted in the filter on the left of the screen (Figure 7).
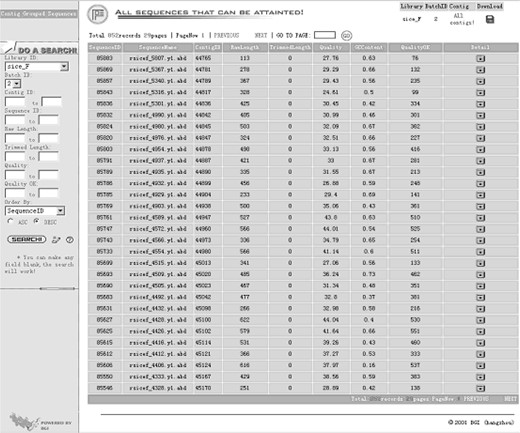
The Sequence View shows the basic information about each EST sequence in the library. It will be helpful for users who are interested in some special sequences. On the left of the page there are filters for users to search sequences by Contig ID, Sequence ID, Raw length, Trimmed length, and Quality, etc.
Contig View
The Contig View (Figure 8) is one of the most important views in the system. Contig size means how many EST sequences have been assembled into the contig, which is an indicator of gene expression level. If a contig contains only one EST sequence, it is called a singleton. The column BlastN Annotation is the result of BLAST search from NCBI non-redundant database chosen by the Lable module. The Lable module not only considers the best hit from the Blast result but also take organism information into account, and filter out BAC or EST hits (details are discussed in our former publication, ref. 13), so it will be able to assign a more reasonable annotation to the contigs. Users could see all the BLAST alignment information including hit score, E-value, and orientation by clicking the arrowhead button. The next column BlastX Annotation is the search result from SWISS-PROT protein database. All its information is similar to the BlastN Annotation but the annotation is taken from the best hit of BlastX result. Classification is a hotspot with mouse-over popup information for gene classification information, which will be expatiated in detail at the Gene Catalogue View. Clicking the “detail” button in the Contig View will display the graphic view and list view of BLAST alignment details (Figure 9).
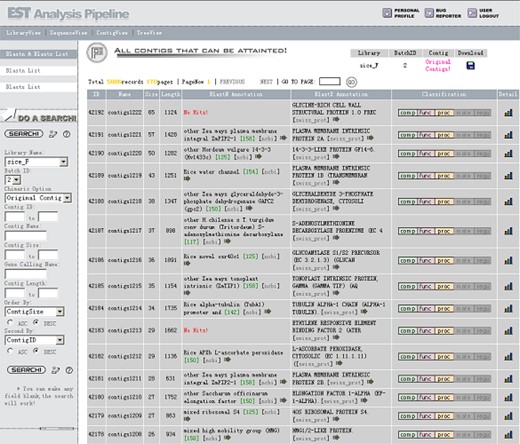
The Contig View. Contig size is one of the most important properties of a contig to define the expressing level of the gene. The columns BlastN Annotation and BlastX Annotation list the taken annotation from NCBI non-redundant and SWISS-PROT database, respectively. Different colors are used to indicate the cellular component, molecular function and biological process aspect of Gene Ontology classification. Detailed graphical view and list view are available by clicking the “detail” button
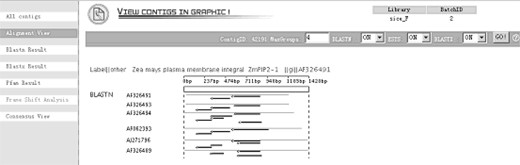
Graphical detail-alignment view. This view shows directly the alignment result between contigs and BLAST database hits. Each line means one hit and each arrowed line indicates an HSP with its orientation. The mouse over event would bring up detailed text boxes for the information of score, length, start, end, etc. of each hits or HSP.
Gene Catalogue View
Gene Ontology is developed for consistent descriptions of gene products in different databases (12). We can classify the annotated genes into cellular component, molecular function and biological process categories according to their accession numbers in SWISS-PROT Protein Knowledgebase or NCBI protein database. The classification could help a lot on the understanding of gene function (Figure 10).
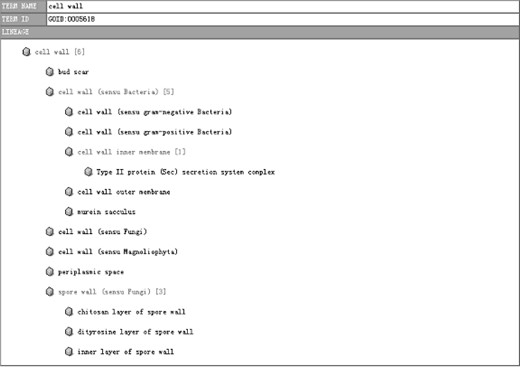
A part of the tree view. The number beside the cell wall indicates there are six contigs classified into this functional category, and branches bellow show the detailed functional category under the father category.
Conclusion
The EST Pipeline System is a highly automatic analysis pipeline for EST projects. What users need to do is to upload the library sequences and select parameters for the tools, and the system will complete all the base-calling, screening, assembly, annotation, and functional classification work. Therefore, the researchers could focus on the biological aspect of those well organized and representative analysis results, and quickly penetrate the biological meaning embedded in the data.
References
Author notes
These authors contributed equally to this work.
