


SUMMARY
A thermal conductivity profile through the upper crustal column is an essential ingredient in any thermal modelling. Granitoid is one of the major constituents of the upper crust in the Archaean cratons. Although granitoids have a wide range in composition, yet data on their thermal conductivity at elevated temperatures are very limited. At present, a single value is commonly used to characterize the decrease in thermal conductivity with temperature for the upper crust. We are reporting thermal conductivity measured at 25 °C, 50 °C and thereafter at 50 °C intervals up to 300 °C on 34 granitoid samples of four compositionally different types. The samples are alkali granite, biotite granite, granodiorite and metasomatised granodiorite from one of the Archaean cratons of the Indian shield, known as Bundelkhand Craton. Before studying the samples at elevated temperatures, these have been studied for their physical, petrological and geochemical characteristics. By 300 °C, the thermal conductivity decreases on the average by 28–31 per cent for metasomatised granodiorite, alkali granite and biotite granite, and in stark contrast by 16 per cent for granodiorite. Expressing the thermal conductivity variation with temperature as λT = λRT (1 + bT)–1, two distinct temperature coefficient (b) values have been found, 1.1 × 10⁻³ to 2.2 × 10⁻³ K–1 for alkali feldspar granite to monzogranite and 0.4 × 10⁻³ to 1.2 × 10⁻³ K–1 for granodiorite to tonalite to quartz diorite. One of the implications of this outcome is illustrated by applying these two distinct temperature coefficients for the upper crust for a 1-D generic model with a surface heat flow and appropriate radiogenic heat production of the crustal column in arriving at crustal temperature–depth profiles. The temperature differences at the base of a 40-km crust vary as much as 90 °C. Further, the temperature coefficient can be expressed as b = 0.71 × λRT– 0.63 for the alkali feldspar granite to monzogranite, whereas b = 0.83 × λRT– 1.26 for the granodiorite to tonalite to quartz diorite, which will be useful in determining the temperature coefficient of various types of granitoid from thermal conductivity at room temperature (λRT).
1 INTRODUCTION
Measurements of thermal conductivity on middle to upper crustal rocks (Birch & Clark 1940; Sibbitt et al. 1979; Seipold 1990, 2002; Seipold & Huenges 1998; Miao et al. 2014; Kant et al. 2017) and lower crustal rocks (Kukkonen et al. 1999; Seipold 2001) show that the lattice (phonon) conductivity pertinent to thermal structure of the crustal part of the lithosphere decreases with temperature. This decrease is much higher for upper crustal rocks than for lower crustal rocks in the laboratory conditions under which they have been studied. Measurement of thermal conductivity at elevated temperatures is beset with many practical problems. Sampling in all the studies reported so far is limited; only 6 granitoid samples have been studied up to 300 °C or higher temperature, and the rest (N = 8) are below 200 or 250 °C. We have attempted greater sampling, covering four types of granitoids from the Bundelkhand Craton (BC) of the Indian shield.
The BC is amongst the most well-studied Archaean cratons from a thermal perspective. Radioelemental, petrological and geochemical characterization of the craton and implication for the Archaean geodynamic evolution have been examined by Ray et al. (2016). Heat flow, heat production and models of the present-day crustal thermal regime have been reported by Podugu et al. (2017). As a case study, Chopra et al. (2018) have evaluated the best-mixing model for estimating thermal conductivity for granitoids from mineralogy.
Granitoids are one of the major constituents of the upper crust but widely vary in composition, which includes granite, monzogranite, quartz monzonite, quartz diorite, syenite, granodiorite, tonalite and trondhjemite. Other major components typical of Archaean upper crust are tonalitic gneiss and mafic volcanics, though volumetrically less common in the BC. Four types of granitoids comprising a very large areal extent of this craton afford an opportunity to study different types from a single terrane. Measurements here are on thermal conductivity of 34 samples of the four major types up to 300 °C. A decrease in thermal conductivity with temperature has been correlated with compositional variation by petrological and geochemical data. We also examine how the decrease in thermal conductivity emerging from this study could impact crustal temperature estimates using a plausible 1-D steady-state model.
2 GEOLOGICAL AND GEOPHYSICAL BACKGROUND
2.1 The setting
The BC, about 26 000 km2 in area (Basu 1986), is the northernmost craton in the Indian shield. It is bounded by the Vindhyan Basin in the west, southwest and southeast, Deccan Volcanic Province (DVP) in the southwest and the northern boundary is concealed beneath the Indo-Gangetic alluvial plain.
Major rock formations of the BC include gneisses and three types of granitoids (Fig. 1). The TTG suite of Meso-Neoarchaean Bundelkhand Gneissic Complex (BnGC) is considered to be the oldest litho unit (Mondal et al. 2002; Singh et al. 2007). The granitoids can be broadly divided into three categories based on geochemical composition, mineralogy, structures and textural characteristics. They are (1) K-feldspar rich pink granitoid (potassic granitoid), (2) biotite rich granitoid (biotite granitoid) and (3) mafic minerals/Na-feldspar rich grey granitoid (sodic granitoid) (Basu 1986; Ray et al. 2016; Podugu et al. 2017). In general, the northern part of the craton is dominated by sodic granitoid, the north-central part is mainly occupied by biotite granitoid and central to southern part is dominated by potassic granitoid (Basu 2010). These are I-type and granodiorite to alkali granite in composition (Mondal et al. 2002; Ray et al. 2016). All of those rock units are intruded by N–E trending quartz reefs followed by N–W trending dolerite dike swarms in large part of the craton (Basu 1986, 2010; Bhattacharya & Singh 2013).
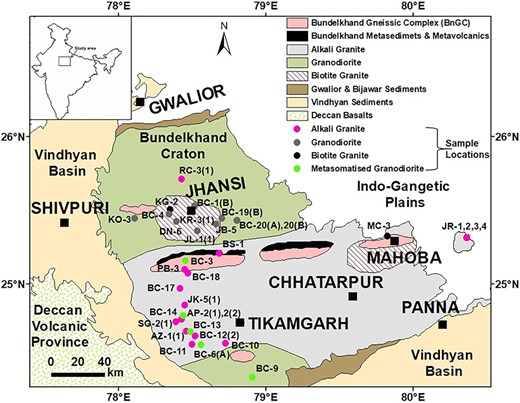
Geological map of the Bundelkhand Craton, central India (modified after Basu 1986; Singh et al. 2007; Ray et al. 2016). Sample locations of this study are shown by solid symbols in different colours for the four granitoid types. These are: (i) alkali granite (N = 17), (ii) biotite granite (N = 3), (iii) granodiorite (N = 9), (iv) metasomatised granodiorite (N = 5).
Detailed geochronological studies have been carried out by several workers (Sarkar et al. 1996; Mondal et al. 1998, 2002; Kaur et al. 2016). The oldest event took place around 3.5 Ga (Kaur et al. 2016) with TTG gneisses formation. Mondal et al. (2002) have reported a Pb–Pb model age of 3.3 Ga for gneisses and interpret this as defining the onset of TTG magmatism and deformation in the BC. Study on different types of granitoids shows that the successive events of granitoid magmatism occurred at the end of Neoarchaean (2.6–2.5 Ga).
In this paper, based on their geochemical composition (using the TAS diagram) potassic granitoid is termed as alkali granite, biotite granitoid is termed as biotite granite and sodic granitoid is termed as granodiorite.
Few geophysical studies, for example gravity, receiver function and magnetotelluric, have been carried out in this craton, providing possible crustal structure (Julia et al. 2009; Gokarn et al. 2013; Ravi Kumar et al. 2013). No deep seismic study has been carried out here. Gravity and receiver function results show that crust is 38–40 km thick. Upper 15 km of the crust mainly consist of felsic rock (VS: 3.5 km s−1) and followed by 25 km lower crust consist of mafic rock (VS: 3.8 km s−1). Global studies show the existence of the mid-crust in most of crustal sections. Magnetotelluric study suggests the high resistivity substructure which indicates the absence of major tectonic/magmatic activity.
2.2 The sampled rock types
Samples from this study are shown in Fig. 1. Sampling covers four rock types. Aerially, three of them cover about 80 per cent of the BC, the alkali granite by 40 per cent, the granodiorite by 35 per cent and the biotite granite by 5 per cent. The other variety we report is the metasomatised granodiorite. Samples have been characterized with the help of geochemical and petrological data. Among 34 samples, 17 are alkali granite, 3 are biotite granite, 9 are granodiorite and 5 are metasomatised granodiorite.
3 DETAILS OF MEASUREMENTS
3.1 Thermal conductivity at elevated temperatures
We have used a steady-state apparatus (guarded heat flow meter, DTC-300; Supporting Information Fig. F1a). It consists of a stack surrounded by a furnace guard. The schematic diagram of the stack is shown in Supporting Information Fig. F1(b). The stack consists of heater assemblies (top heater and bottom heater), plates (upper plate and lower plate), the sample to be measured, and a reference calorimeter. Above the stack, an air cylinder is placed that controls the required pressure on the sample during the experiment. The sample is placed under a reproducible compressive load between two polished metallic surfaces, each being automatically controlled at a different temperature. Two faces of the sample (cylindrical disc) are covered with a thin layer of thermal compound to minimize the air contact and ensure good conduction in the stack. As heat flows in the stack from the upper surface through the sample and the heat flux transducer to the lower surface, an axial temperature gradient is established in the stack. To minimize lateral heat flow to and from the stack, the guard (that surrounds the stack) is kept at the mean temperature of the two plates. Therefore, the heat flux through the stack is constant and equates the heat flux going through the heat flux transducer, whose output is measured. At steady-state, the temperature difference between the two faces of the sample is measured (Ts), along with the temperature difference across the reference calorimeter (Tr).
Five standard samples of known thermal conductivity (according to ASTM E1530 standards) are measured at desired temperatures to generate a calibration curve before starting the experiment with the sample. The estimated accuracy is 3–8 per cent, depending on the thermal resistance of the sample. One of the requirements is that the samples must have the same cross-section as the calibration references and could be about 20 mm (0.75 inches) in thickness. Calibration curves, 50 °C to 300 °C at 50 C° intervals, are shown in Supporting Information Fig. F1(c). After calibration, samples are measured to find out their Ts/Tr ratios at desired temperatures. With the Ts/Tr ratios and the thickness of the sample, thermal conductivity has been arrived at using a respective calibration curve.
3.2 Density and porosity
For measuring density and porosity, cylindrical discs were used. It involved measurements of three weights: (i) weight in the air at dry condition (Wair), (ii) weight in water at dry condition (Wwater) and (iii) weight in the air at saturated condition (Wsat), using a high precision balance (@Mettler Toledo). First, samples are dried in an oven for 12 hr, and weights are taken in air and water. The samples are dried again and then placed in desiccators for 15 min to remove the air from the pores. In vacuum condition, it is saturated with tap water and kept for 24 hr to allow water to enter into the pores (Chopra et al. 2018, 2020).
where, R and H are radius and thickness of the sample, respectively.
3.3 Major oxides
Major oxide concentrations were determined by Wavelength-Dispersive X-ray Fluorescence Spectrometry (PANalytical-WDXRF) using pressed pellets. The rock samples were crushed and converted into fine powders using agate mortar. Collapsible aluminium cups were filled with the boric acid and 2 g of the finely powdered sample, and then pressed under a hydraulic pressure (at 25-Ton) to make a pellet (Krishna et al. 2007).
3.4 T-test
Major oxides data for different granitoids have been analysed using the statistical t-test (with 95 per cent confidence level) to look at the variations in chemical composition between the four granitoids.
3.5 Modal analysis
Modal analysis has been done on thin sections to characterize volume per cent of major and accessory minerals using a petrographic microscope (NIKON LV 100 POL) under the plane and the cross-polarized light. Modal mineralogy is also calculated by CIPW NORM (Kelsey 1965) using major oxide and assuming pristine magmatic composition as secondary alteration present in a few samples is negligible.
4 RESULTS
4.1 Characterization of the samples
4.1.1 By major oxides
Data on the four granitoid groups are given in the Supporting Information Dataset D1. Mean values of major oxides, along with the standard error, are shown by Harker plots (Supporting Information Fig. F2). Statistically distinct geochemical characteristics (up to 95 per cent confidence level by t-test) have been observed between four types of granitoids for most of the oxides.
Classification of the granitoids by Total Alkali versus Silica (TAS) diagram (Fig. 2a) indicates that alkali granites, biotite granites and metasomatised granodiorites lie in the granite to alkali granite field, whereas granodiorites lie mostly in the granodiorite field.
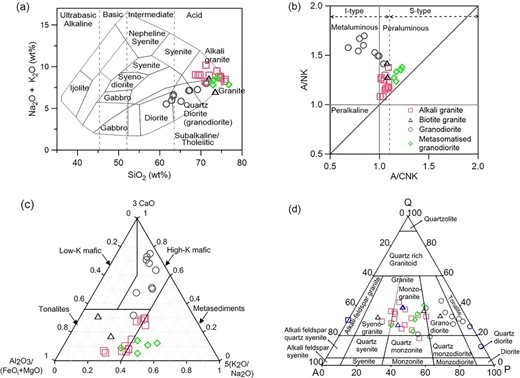
Geochemical characterizations of the granitoids, that is alkali granite, biotite granite, granodiorite and metasomatized granodiorite. (a) TAS diagram (Cox et al. 1979), (b) A/NK versus A/CNK diagram (Shand 1943), (c) Al2O3/(FeOt + MgO)–3CaO–5(K2O/Na2O) ternary diagram (Laurent et al. 2014) and (d) QAP diagram (Streckeisen 1974) for this and previously studied samples from petrography modal data. Previously studied samples in QAP are shown by blue colour symbols. These are—square: Birch & Clark (1940); triangle: Seipold (1990); circle: Miao et al. (2014). FeOt denotes total FeO.
Al2O3/(Na2O + K2O) versus Al2O3/(CaO + Na2O + K2O) plot (A/NK versus A/CNK, Fig. 2b) shows that alkali granites, biotite granites and metasomatised granodiorites are peraluminous, whereas granodiorites are metaluminous to peraluminous. All are I-type, except metasomatised granodiorites, which are S-type.
Source rock composition is determined by Al2O3/(FeOt + MgO)–3CaO–5(K2O/Na2O) ternary plot (Fig. 2c). Source rock for alkali granites and biotite granites are tonalites, granodiorites are mostly high-K mafic, and metasomatised granodiorites are mostly metasediments. Results indicates that granitoids are formed from different magma sources, which corroborates the study of Ray et al. (2016).
QAP diagram (Fig. 2d) shows that alkali granites, biotite granites and metasomatised granodiorites have more alkali feldspar, whereas granodiorites have more plagioclase feldspar. Alkali granites, biotite granites and metasomatised granodiorites are mostly in monzogranite, and granodiorites are in granodiorite to tonalite.
Peraluminous granite can be formed by partial melting of both S-type (metasedimentary) and I-type (meta-igneous) rocks (Gao et al. 2016, and references therein) or by fractional crystallization of mafic rocks (Lee & Morton 2015). Therefore, the peraluminous nature of alkali granites are perhaps due to the partial melting of tonalite source rock which has been metamorphosed to some degree, while the peraluminous nature of metasomatised granodiorites are likely due to the partial melting of metasedimentary source rock (Figs 2b and c).
4.1.2 By petrography
Petrographic modal mineralogy of this study is summarized in Table 1.
Petrographic data of the granitoids only from this study (N = 32).
| Sample No. | Major minerals (Vol. per cent) | Accessory minerals (Vol. per cent) | ||||||||||
|---|---|---|---|---|---|---|---|---|---|---|---|---|
| Qtz | Pl | Afs | Bt | Ms | Hbl | Zr | Ttn | Al | Ep | Chl | Opq | |
| Alkali granite | ||||||||||||
| AZ-1(1) | 30.4 | 34.8 | 31.1 | 1.7 | - | 1.9 | - | - | - | - | - | - |
| BS-1 | 29.8 | 25.4 | 40.7 | 4.2 | - | - | - | - | - | - | - | - |
| JK-5(1) | 30.6 | 41.4 | 21.6 | 3.2 | - | 3.2 | - | - | - | - | - | - |
| JR-1 | 33.0 | 38.1 | 26.8 | 0.9 | - | 1.0 | - | - | - | - | - | 0.1 |
| JR-2 | 22.6 | 38.6 | 33.9 | 1.4 | - | 1.5 | - | - | - | - | 2.0 | 0.1 |
| JR-3 | 35.2 | 21.1 | 40.5 | 1.3 | - | 1.8 | - | - | - | - | - | 0.1 |
| JR-4 | 34.0 | 24.7 | 39.6 | 1.6 | - | - | - | - | - | - | - | - |
| PB-3 | 35.8 | 28.2 | 31.5 | 1.5 | 1.5 | 1.5 | - | - | - | - | - | - |
| RC-3(1) | 35.2 | 23.9 | 39.4 | - | - | - | - | 1.4 | - | - | - | - |
| SG-2(1) | 26.6 | 24.7 | 43.2 | 1.4 | - | - | 0.4 | 1.5 | - | - | 2.1 | 0.1 |
| BC-10 | 17.9 | 46.8 | 33.8. | 0.5 | - | - | - | - | - | 0.1 | 1.0 | - |
| BC-11 | 26.4 | 33.6 | 37.5 | 1.1 | - | - | - | 1.2 | 0.1 | - | - | 0.1 |
| BC-12(2) | 24.0 | 33.2 | 40.6 | 2.1 | - | - | - | - | - | - | - | 0.1 |
| BC-17 | 27.0 | 18.5 | 46.3 | 1.2 | - | 6.9 | - | - | - | - | - | 0.1 |
| BC-18 | 41.1 | 22.9 | 32.9 | 1.5 | - | - | - | - | - | - | 1.5 | 0.1 |
| Biotite granite | ||||||||||||
| KG-2 | 30.0 | 15.0 | 47.5 | 6.8 | - | - | 0.1 | 0.5 | - | - | - | 0.1 |
| KR-3(1) | 32.0 | 50.0 | 14.0 | 3.0 | - | - | - | - | - | 1.0 | - | - |
| MC-3 | 36.0 | 40.0 | 22.0 | 1.9 | - | - | - | - | - | - | - | 0.1 |
| Granodiorite | ||||||||||||
| DN-6 | 36.8 | 39.5 | 19.7 | 2.3 | - | 1.3 | 0.2 | 0.2 | - | - | - | - |
| JB-5 | 25.1 | 57.3 | 3.0 | 6.0 | - | 7.0 | - | 0.5 | - | 1.0 | - | - |
| JL-1(1) | 31.6 | 47.9 | 9.4 | 3.8 | - | 6.7 | - | - | - | 0.5 | - | 0.1 |
| KO-3 | 21.2 | 47.7 | 7.5 | 7.8 | - | 13.6 | - | 2.0 | - | - | - | 0.1 |
| BC-1(B) | 16.7 | 45.8 | 24.0 | - | - | - | - | 1.0 | - | - | 12.5 | - |
| BC-4 | 15.5 | 33.6 | 25.1 | 7.2 | - | 17.6 | 0.1 | 0.5 | 0.1 | 0.2 | - | 0.1 |
| BC-19(B) | 24.6 | 44.4 | 6.1 | 6.2 | - | 16.6 | - | 2.0 | - | 0.2 | - | - |
| BC-20(A) | 32.8 | 36.2 | 6.9 | 6.5 | - | 17.0 | 0.1 | 0.5 | - | - | - | 0.1 |
| BC-20(B) | 21.3 | 43.6 | 3.0 | 4.3 | - | 17.5 | 0.1 | 0.4 | - | 0.9 | 9.0 | - |
| Metasomatised granodiorite | ||||||||||||
| BC-3 | 28.1 | 35.4 | 28.1 | 5.0 | - | - | - | 1.7 | 0.1 | - | 1.7 | - |
| BC-6(A) | 22.1 | 40.2 | 34.7 | 1.0 | - | 2.0 | - | - | - | - | - | - |
| BC-9 | 32.8 | 36.5 | 26.2 | 4.5 | - | - | - | - | - | - | - | - |
| BC-13 | 25.5 | 25.5 | 43.8 | 5.1 | - | - | - | - | - | - | - | - |
| BC-14 | 38.8 | 37.7 | 20.0 | 3.5 | - | - | - | - | - | - | - | - |
Qtz: Quartz; Pl: Plagioclase; Afs: Alkali feldspar (Mc: Microcline, Or: Orthoclase); Bt: Biotite; Ms: Muscovite; Hbl: Hornblende; Zr: Zircon; Ttn: Titanite; Al: Allanite; Ep: Epidote; Chl: Chlorite; Opq: Opaque.
The representative photomicrographs of the four types of granitoids are shown in Fig. 3. Details about the individual rock samples and their photomicrography are given in Supporting Information Dataset D2.
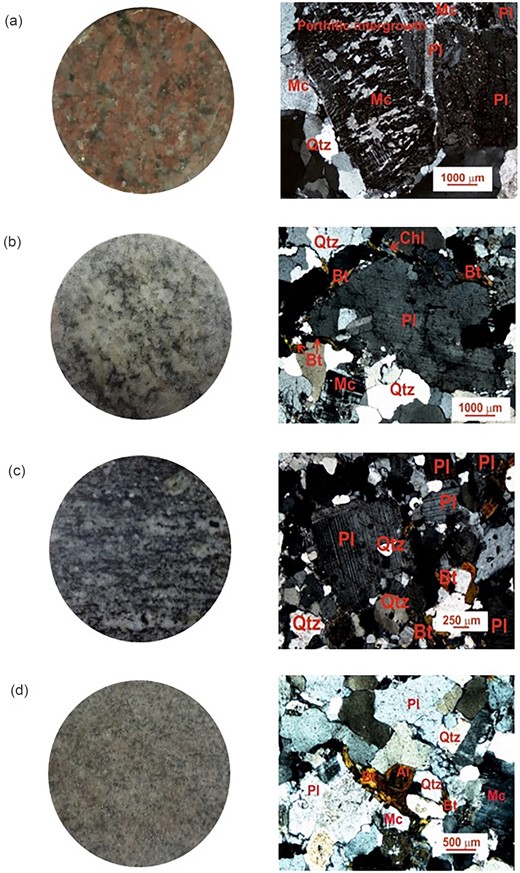
Megascopic view of polished samples (left-hand column) and typical photomicrographs under cross-polarized light (right-hand column). (a) Alkali granite, (b) biotite granite, (c) granodiorite and (d) metasomatised granodiorite. Abbreviations of minerals are as Table 1.
The alkali granites are two feldspar granites consisting of quartz, alkali feldspar (microcline and orthoclase) and plagioclase as the major constituents. Both the feldspars are similar in size, with the percentage of alkali feldspar higher than plagioclase. Biotite, muscovite and hornblende are the mafic components. Biotite is present in all the samples, while muscovite and hornblende are seen in a few samples. Zircon, titanite, allanite, epidote, chlorite and opaque are accessory minerals. Myrmekitic texture and perthitic intergrowths are prominent in most samples. Consertal texture of quartz is present indicating recrystallization of quartz. Minor grain orientation is seen in some samples.
The biotite granites are two feldspar granites with plagioclase, quartz and alkali feldspar as the major constituents. Biotite is present as a mafic component. All the feldspar grains are equigranular in size, with no distinct dominance of any of the groups. Zircon, titanite, epidote, chlorite and opaque are the observed accessory minerals. Some grains with pleochroic halos are also seen in biotite, indicating the presence of radioactive minerals. Perthitic intergrowth texture and very less myrmekitic texture are present.
The granodiorites are dominant in plagioclase along with alkali feldspar and quartz as the major constituents, while the dominant mafic phases are biotite and hornblende. The accessory phases are zircon, titanite, allanite, epidote, chlorite and opaque. Pleochroic halos are seen in some biotite grains. A very few exsolution textures are seen in the form of myrmekitic and perthitic intergrowth. Porphyritic texture is present with mostly plagioclase as the phenocrysts. Recrystallization of quartz is present. Grain orientation is seen in some samples.
The metasomatised granodiorites are two feldspar granites. Quartz, plagioclase and alkali feldspar are the major constituents, whereas hornblende and biotite are the mafic phases. Accessory phases are zircon, allanite and chlorite.
Petrographic study indicates that alkali granites, biotite granites and metasomatised granodiorites have a granitic composition (per cent of alkali feldspar > per cent of plagioclase), and granodiorites have granodioritic composition (per cent of plagioclase > per cent of alkali feldspar). All the granitoids are two feldspar granites with perthitic intergrowth in many of the samples. Two feldspar granites are subsolvus granites formed from a relatively wet melt at high pressure. Perthitic intergrowth also forms in subsolvus conditions. The mafic phases are biotite and hornblende, which are hydrous phases and confirm the formation of these granite samples from a hydrous melt.
Thus, geochemistry and petrography results show that studied granitoids are of different variety in terms of composition and their sources.
4.2 Density and porosity
The density and porosity of the thirty-four granitoid samples have been given in the Supporting Information Dataset D3 and are summarized in Table 2. Density shows a very narrow range for all granitoids, except for the granodiorites. Also, the average density of the granodiorites (2731 kg m−3) is slightly higher than the other types of presently studied granitoids (2624–2643 kg m−3) and the granitoids of the other region (Ray et al. 2003; Chopra et al. 2020). Porosity is very low (0.02–0.55 per cent) for all the samples.
Density and porosity of the granitoids from this study.
| Rock Type | N | Density, ρ (kg m−3) | Porosity, ϕ (per cent) | ||||
|---|---|---|---|---|---|---|---|
| Range | Mean | SD | Range | Mean | SD | ||
| Alkali granite | 17 | 2607–2663 | 2630 | 18 | 0.02–0.55 | 0.21 | 0.17 |
| Biotite granite | 3 | 2636–2649 | 2642 | 6 | 0.09–0.11 | 0.10 | 0.01 |
| Granodiorite | 9 | 2647–2776 | 2731 | 51 | 0.02–0.49 | 0.17 | 0.16 |
| Metasomatised granodiorite | 5 | 2616–2641 | 2624 | 10 | 0.23–1.84 | 0.64 | 0.68 |
SD: 1σ standard deviation.
4.3 Thermal conductivity at elevated temperatures
Thermal conductivity in the temperature range 25–300 °C of the 34 granitoid samples is presented in Supporting Information Dataset D4 and plotted in Fig. 4.
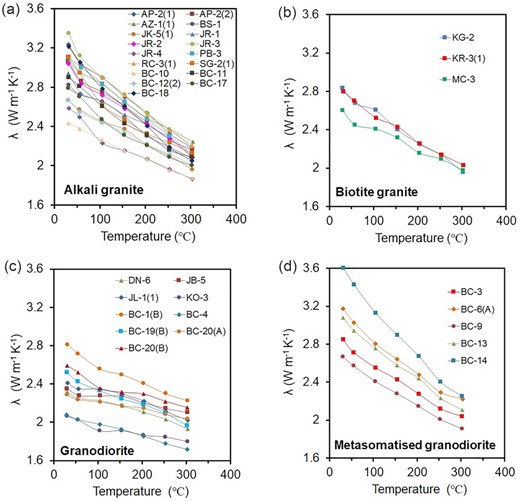
Thermal conductivity versus temperature plots for (a) alkali granite (N = 17), (b) biotite granite (N = 3), (c) granodiorite (N = 9) and (d) metasomatised granodiorite (N = 5).
At room temperature, the granitoids depict different ranges and averages (Table 3). Average thermal conductivity is highest for alkali granite and metasomatised granodiorite (3.0 and 3.1 Wm–1 K–1), intermediate for biotite granite (2.7 Wm–1 K–1) and lowest for granodiorite (2.4 Wm–1 K–1). The systematic decrease in thermal conductivity with temperature is higher for metasomatised granodiorite (average drop: 31 per cent), alkali granite (average drop: 29 per cent), biotite granite (average drop: 28 per cent), and lower for granodiorite (average drop: 16 per cent).
Thermal conductivity of the granitoids at room temperature, variations in thermal conductivity with temperature, temperature coefficient from this and previous studies.
| Rock Type a | N | QAP plot b | λRT (W m–1 K–1) | Δλ/λRT (per cent) | b (x10–3) (K–1) | References | |||
|---|---|---|---|---|---|---|---|---|---|
| Range | Avg. | Range | Avg. | Range | Avg. | ||||
| Metasomatised granodiorite | 5 | Monzogranite | 2.7–3.6 | 3.1 | 28–38 | 31 | 1.4–2.2 | 1.7 | This study |
| Alkali granite | 17 | Syeno-granite to Monzogranite | 2.4–3.4 | 3.0 | 23–36 | 29 | 1.1–2.0 | 1.5 | This study |
| Biotite granite | 3 | Syeno-granite to Monzogranite (mostly) | 2.6–2.8 | 2.7 | 24–31 | 28 | 1.1–1.5 | 1.3 | This study |
| Granite | 1 | Alkali feldspar granite | - | 3.4 | - | 28 | - | 1.4 | Birch & Clark (1940) |
| Granite | 3 | Monzogranite | 3.2–3.4 | 3.3 | 31–35 | 33 | 1.2–1.8 | 1.5 | Seipold (1990) |
| Summary | 29 | Alkali feldspar granite–Monzogranite | 2.4–3.6 | 3.0 c | 23–38 | 30 c | 1.1–2.2 | 1.5 c | |
| Granodiorite | 9 | Granodiorite to tonalite | 2.1–2.8 | 2.4 | 11–22 | 16 | 0.4–0.9 | 0.66 | This study |
| Granodiorite | 1 | Qtz Diorite | - | 2.0 | - | 14 | - | 0.54 | Miao et al. (2014) |
| Granite | 1 | Tonalite | - | 2.6 | - | 24 | - | 1.2 | Miao et al. (2014) |
| Summary | 11 | Granodiorite–Tonalite–Qtz diorite | 2.0–2.8 | 2.4 c | 11–24 | 17 c | 0.4–1.2 | 0.7 c | |
aAs given in references; b QAP plot is made using available mineralogical data in the mentioned references; c weighted average; λRT: thermal conductivity at room temperature; Δλ: drop in thermal conductivity between 25 and 300 °C; b: temperature coefficient; N: number of samples; Qtz: Quartz.
5. DISCUSSION
5.1 Temperature dependence of thermal conductivity
5.1.1 Granitoids
The systematic decrease in thermal conductivity, with an increase in temperature, stands out in Fig. 4. The decrease ranges from 11 to 38 per cent. It is lowest, 11 to 24 per cent with an average of 16 per cent, for granodiorite; followed by 24 to 31 per cent with an average of 28 per cent for biotite granite; from 23 to 36 per cent with an average of 29 per cent for alkali granite; and the highest, 28 to 38 per cent with an average of 31 per cent, for metasomatised granodiorite (Table 3).
The values of coefficient b are given in Table 3. The average b value is highest for metasomatised granodiorite (1.7 × 10 –3 K–1) and alkali granite (1.5 × 10 –3 K–1), intermediate for biotite granite (1.3 ×10 –3 K–1). Considerably lower b-values are observed for granodiorite (0.66 ×10⁻³ K–1). Thus, the study indicates that granodiorite shows a very low b-value compared to all other granitoids.
The data, which have been reported up to 300 °C or higher in the previous studies, have been shown in Supporting Information Fig. F3 and also compiled with the present data (Table 3). All the samples (previous and present) have been characterized using a QAP diagram (Fig. 2d). Our results along with previous studies, reveals two distinct ranges for the temperature dependence of thermal conductivity (b-value) of granitoids. The decrease in thermal conductivity with temperature for the alkali feldspar granite to monzogranite ranges between 23 and 38 per cent, whereas for granodiorite to tonalite to quartz diorite ranges between 11 and 24 per cent. Consequently, the temperature coefficient b of alkali feldspar granite to monzogranite ranges between 1.1 × 10⁻³ and 2.2 × 10⁻³ K–1 with an average of 1.5 × 10⁻³ K–1, whereas for granodiorite to tonalite to quartz diorite ranges between 0.4 × 10⁻³ and 1.2 × 10⁻³ K–1 with an average of 0.7 × 10⁻³ K–1.
Thus, the rocks with comparatively higher alkali feldspar, higher quartz and lesser plagioclase, that is alkali feldspar granite to monzogranite, have higher temperature dependence of thermal conductivity, than the rocks with comparatively higher plagioclase, lesser alkali feldspar and lesser quartz content, that is granodiorite to tonalite to quartz diorite.
λN versus temperature plots of the individual samples of the studied granitoids, along with previous data, are shown in Fig. 5(a) and average values for various types of the granitoids are shown in Fig. 5(b). As normalized thermal conductivity λN depends only on the temperature coefficient b, the above two varieties, that is alkali feldspar granite to monzogranite and granodiorite to tonalite to quartz diorite, show distinctly different characteristics.
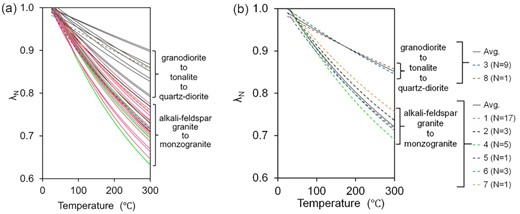
Normalized thermal conductivity (λN) versus temperature plots for the granitoids of this study (1, 2, 3, 4; N = 34) and previous studies (5, 6, 7, 8; N = 6), where N is number of samples. (a) Showing all data, (b) showing average data of various studies by dashed line and average of all data for each category of granitoids by grey solid line. Abbreviations are—1: alkali granite; 2: biotite granite; 3: granodiorite; 4: metasomatised granodiorite; 5: Birch & Clark (1940); 6: Seipold (1990); 7 & 8: Miao et al. (2014).
The study depicts that the variation of thermal conductivity with temperature and temperature coefficient for the above two types of granitoids are distinctly different.
5.1.2 Gneisses and granulites
Thermal conductivity at elevated temperatures on gneisses (Seipold 2001) shows that its value at room temperature is 2.9 Wm–1K–1, and its variations with temperature is 24 per cent in the temperature range 25–300 °C. Further, thermal conductivity study on different types of gneisses in the temperature range 25–275°C (Kukkonen et al. 2015) shows that at room temperature, it changes from 2.4 to 2.7 Wm–1K–1, and the decrease in thermal conductivity with temperature are: (i) Tonalitic-granodioritic-granitic gneiss: 17.4 per cent, (ii) Mica gneiss: 18.7 per cent, (iii) Veined gneiss: 18.2 per cent and (iv) Diatexitic gneiss: 22.6 per cent. Analysis of the available data on gneisses depicts that variation for different types of gneisses varies between 17 and 24 per cent.
Study on mafic granulites (Kukkonen et al. 1999) shows that thermal conductivity at room temperature ranges from 1.9 to 2.4 Wm–1K–1, and it decreases from 13 to 17 per cent in the temperature range 25–300 °C.
Thermal conductivity on the felsic and mafic granulites (Seipold 2001) shows that average thermal conductivity at room temperature for the above two varieties is 2.7 and 2.3 Wm–1K–1, and in the temperature range 25 – 300 °C variations are 24 per cent and 12 per cent, respectively.
Temperature coefficient b for mafic granulite is 0.6 × 10⁻³ K–1, whereas for felsic granulite is 1.3 × 10⁻³ K–1, and gneiss is 1.4 × 10⁻³ K–1. Within granulites, the temperature coefficient of felsic granulites is about double (1.3 × 10⁻³ K–1) that of mafic granulites (0.6 × 10⁻³ K–1). Further, the temperature coefficient of felsic granulite is on the lower side of the temperature coefficient observed for the alkali feldspar granite to monzogranite, whereas the temperature coefficient of the mafic granulite is similar to the granodiorite to tonalite to quartz diorite. Temperature coefficient of gneisses is in between the felsic granulite and alkali feldspar granite to monzogranite. The difference in temperature coefficients between the two types of granulites is due to the difference in their mineralogical composition. The felsic granulite is mainly composed of plagioclase, alkali feldspar, quartz with a minor amount of orthopyroxene, biotite, chlorite, kyanite, porphyroblasts of garnet, etc., whereas the mafic granulite is composed of plagioclase and a minor amount of quartz, clinopyroxene, ilmenite, etc. Similarly, the mineral composition of gneisses matches with these rocks. Thus, mineralogical composition plays an important role in controlling the temperature coefficient in the rock.
5.2 Thermal conductivity of granitoids at room temperature
5.2.1 Measured thermal conductivity
Thermal conductivity data at room temperature for the granitoids of different geological provinces having varied geochronology are shown in Fig. 6 and compiled in Supporting Information Table T1. Also, granitoids from major Archaean cratons have been summarized by Chopra et al. (2020). Extremely wide variations in thermal conductivity are discernible within granitoids.
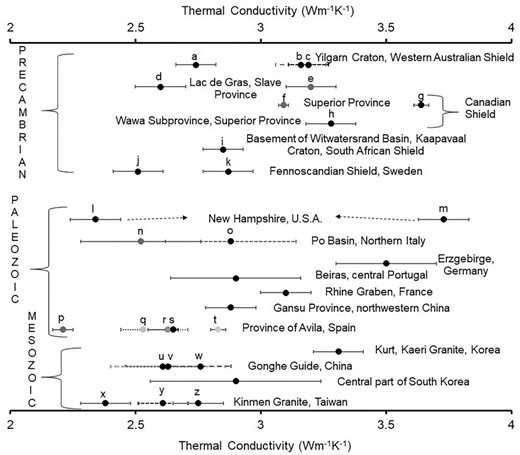
Mean thermal conductivity of the granitoids from various geological provinces in the world, along with standard error. In a few cases, the standard error is considered as 0.1 where it is not available (as the maximum observed standard error in the rest of the regions is within 0.1). For abbreviations, see Supporting Information Table T1.
Thermal conductivity studies at elevated temperatures show that thermal conductivity at room temperature for different varieties of granitoids varies in different ranges. For alkali feldspar granite to monzogranite, it varies between 2.4 and 3.6 Wm–1 K–1 with an average of 3.0 Wm–1 K–1, whereas for granodiorite to tonalite to quartz diorite, it varies between 2.0 and 2.8 Wm–1 K–1 with an average of 2.4 Wm–1 K–1 (Table 3).
Studies on elevated temperatures also reveal that for each variety of granitoid, the temperature dependence of thermal conductivity is dependent on their thermal conductivity at room temperature. Therefore, the granitoid with higher thermal conductivity at room temperature exhibit larger thermal conductivity variations with temperature that is drop D (Fig. 7a) and higher temperature coefficient b (Fig. 7b) compared to the samples having lower thermal conductivity at room temperature. The above variations for different types of granitoids can be attributable to the differences in the major mineral abundances.
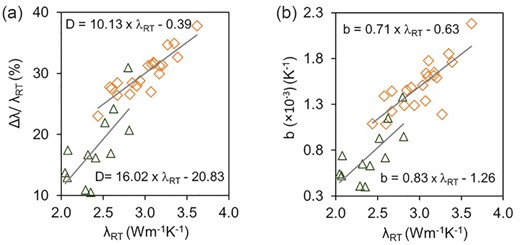
Bivariate plots for the granitoids studied at elevated temperatures (present and previous) showing (a) variations in thermal conductivity with temperature Δλ/λRT and (b) temperature coefficient b, versus thermal conductivity at room temperature λRT.
By knowing thermal conductivity at room temperature and composition of the rock, D and b values can be determined by the following expressions.
The above expressions are very useful for estimating the variation in thermal conductivity with temperature that can be easily extended to different regions where the composition and thermal conductivity at room temperature are known.
Among the major minerals in granitoids, quartz has maximum thermal conductivity (7.64 Wm–1 K–1), followed by alkali feldspar (microcline: 2.49 Wm–1 K–1, orthoclase: 2.33 Wm–1 K–1) and plagioclase feldspar (albite: 2.22 Wm–1 K–1, anorthite: 1.69 Wm–1 K–1). Therefore, the granitoids having higher quartz and alkali feldspar, such as alkali feldspar granite to monzogranite, show higher thermal conductivity at room temperature compared to the granitoids having a comparatively lower content of the above minerals but higher plagioclase, such as granodiorite to tonalite to quartz diorite. For both the varieties of granitoids, thermal conductivity at room temperature, variations in thermal conductivity with temperature, and temperature coefficients show an increasing trend with quartz and alkali feldspar, whereas shows a decreasing trend with plagioclase feldspar (Figs 8a–i). Surprisingly, a much better trend is observed for the above thermal parameters with SiO2 (Figs 8j–l), although quartz and feldspar (orthoclase and plagioclase) both contribute to SiO2 content. Thermal conductivity data at room temperature of Fuchs et al. (2018) and Jennings et al. (2019), for similar type of the granitoids (Supporting Information Fig. F4), follow a comparable trend with quartz, alkali feldspar, plagioclase feldspar and SiO2 as found for the data from the elevated temperature studies (Figs 8a, d, g, j). For these two studies considered those thermal conductivity data for which mineral data are available.
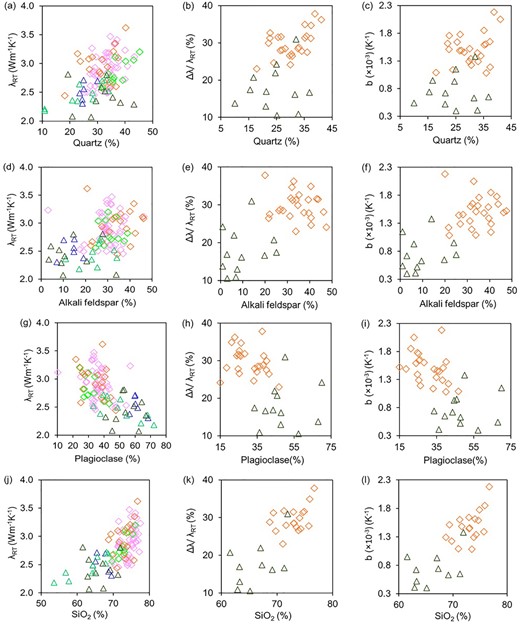
Bivariate plots for the granitoids studied at elevated temperatures showing three thermal parameters (i.e. thermal conductivity at room temperature λRT, variations in thermal conductivity with temperature Δλ/λRT and temperature coefficient b) versus major mineralogy (i.e. quartz, alkali feldspar, plagioclase feldspar) and SiO2 of the studied granitoids at elevated temperatures. Also, thermal conductivity at room temperature for the samples of Fuchs et al. (2018) and Jennings et al. (2019) are shown in (a), (d), (g) and (j).
Analysis of all data shows that thermal conductivity at room temperature depends on the relative abundances of the major mineral contents (quartz, alkali feldspar, plagioclase feldspar) in rock, that is the granitoid type. Further, the temperature dependence of the thermal conductivity depends on the thermal conductivity at room temperature and relative abundances of quartz, alkali feldspar and plagioclase feldspar. Thus, granitoid type control thermal conductivity at room temperature and its temperature dependency in rock.
5.2.2 Calculated thermal conductivity
Previous studies (Chopra et al. 2018; Fuchs et al. 2018) showed that in case of non-availability of proper sample for measurement in the laboratory, thermal conductivity could be calculated from mineralogy by various mathematical models (arithmetic mean, geometric mean, harmonic mean, Voigt-Reuss mean, effective mean) with certain limitations and uncertainty. We have carried out the similar exercise to discern the variation between measured and calculated thermal conductivity on the studied samples.
Mineralogical data is considered from petrography (Table 1) and CIPW NORM (Supporting Information Dataset D5). Analysis showed that for most of the samples harmonic mean model has the least deviation among the models, discussed above, from the measured thermal conductivity (Supporting Information Table T2). Thermal conductivity is also calculated from the major oxide data using the expression given by Jennings et al. (2019). Measured thermal conductivity, along with calculated thermal conductivity, from the mineralogical data with harmonic mean model and oxide data are summarized in Table 4.
Measured thermal conductivity (λRT), calculated thermal conductivity (λCal) and deviations of the calculated thermal conductivity from the measured thermal conductivity.
| Sample No. | λRT | λCal | Deviation (in per cent) | ||||
|---|---|---|---|---|---|---|---|
| Using Modal a | Using NORM a | Using Jennings et al. (2019) b | From Modal derived a | From NORM derived a | From Jennings et al. (2019) derived b | ||
| Alkali granite | |||||||
| AZ-1(1) | 3.07 | 2.90 | 2.97 | 2.88 | -5.5 | -3.3 | -6.2 |
| BS-1 | 2.82 | 2.92 | 2.78 | 2.77 | 3.5 | -1.4 | -1.8 |
| JK-5(1) | 2.67 | 2.86 | 2.75 | 2.64 | 7.1 | 3.0 | -1.1 |
| JR-1 | 2.94 | 2.95 | 2.71 | 2.58 | 0.3 | -7.8 | -12.2 |
| JR-2 | 3.04 | 2.75 | 2.71 | 2.62 | -9.5 | -10.9 | -13.8 |
| JR-3 | 3.35 | 3.11 | 3.03 | 2.99 | -7.2 | -9.6 | -10.8 |
| JR-4 | 2.58 | 3.05 | 3.08 | 3.00 | 18.2 | 19.4 | 15.9 |
| PB-3 | 3.10 | 3.07 | 2.65 | 2.58 | -1.0 | -14.5 | -16.8 |
| RC-3(1) | 3.21 | 3.09 | 2.91 | 2.88 | -3.7 | -9.4 | -10.3 |
| SG-2(1) | 3.11 | 2.91 | 3.03 | 2.94 | -6.4 | -2.6 | -5.5 |
| BC-10 | 2.44 | 2.59 | 2.82 | 2.75 | 6.1 | 15.6 | 12.7 |
| BC-11 | 2.90 | 2.82 | 2.85 | 2.77 | -2.8 | -1.7 | -4.5 |
| BC-12(2) | 2.67 | 2.76 | - | - | 3.4 | - | - |
| BC-17 | 2.79 | 2.95 | - | - | 5.7 | - | - |
| BC-18 | 3.21 | 3.28 | - | - | 2.2 | - | - |
| Biotite granite | |||||||
| KG-2 | 2.84 | 2.91 | - | - | 2.5 | - | - |
| KR-3(1) | 2.80 | 2.84 | 2.79 | 2.74 | 1.4 | -0.4 | -2.1 |
| MC-3 | 2.60 | 2.98 | 2.82 | 2.85 | 14.6 | 8.5 | 9.6 |
| Granodiorite | |||||||
| DN-6 | 2.32 | 2.99 | 2.78 | 2.78 | 28.9 | 19.8 | 19.8 |
| JB-5 | 2.35 | 2.66 | 2.83 | 2.68 | 13.2 | 20.4 | 14.0 |
| JL-1(1) | 2.41 | 2.86 | 2.76 | 2.71 | 18.7 | 14.5 | 12.5 |
| KO-3 | 2.07 | 2.64 | 2.79 | 2.59 | 27.5 | 34.8 | 25.1 |
| BC-1(B) | 2.81 | 2.74 | 2.90 | 2.66 | -2.5 | 3.2 | -5.3 |
| BC-4 | 2.08 | 2.62 | 2.77 | 2.68 | 26.0 | 33.2 | 28.9 |
| BC-19(B) | 2.52 | 2.74 | 2.82 | 2.66 | 8.7 | 11.9 | 5.6 |
| BC-20(A) | 2.29 | 2.97 | 2.79 | 2.58 | 29.7 | 21.8 | 12.7 |
| BC-20(B) | 2.59 | 2.86 | 2.76 | 2.56 | 10.4 | 6.6 | -1.2 |
| Metasomatised granodiorite | |||||||
| BC-3 | 2.85 | 2.83 | 2.99 | 2.87 | -0.7 | 4.9 | 0.7 |
| BC-6(A) | 3.17 | 2.70 | 2.94 | 2.88 | -14.8 | -7.3 | -9.2 |
| BC-9 | 2.67 | 2.92 | 2.95 | 2.85 | 9.4 | 10.5 | 6.7 |
| BC-13 | 3.08 | 2.82 | 3.12 | 2.91 | -8.4 | 1.3 | -5.5 |
| BC-14 | 3.62 | 3.07 | 3.21 | 3.09 | -15.2 | -11.3 | -14.6 |
aCalculated Harmonic mean thermal conductivity; b keff = exp (1.72 × CSiO2 + 1.018 × CMgO–3.652 × CNa2O–1.791 × CK2O), where Coxide represent volume fraction of the respective oxide (Jennings et al. 2019).
Deviation in calculated thermal conductivity from the measured data by the three approaches shows slightly different values for a particular sample. Considering any approach, deviations are less than 15 per cent for most of the samples and all approaches have their own limitations. The higher deviations in few samples could be due to the existence of natural heterogeneity within the sample. The deviation can be reduced further, by performing more petrographic sections and geochemical analysis for each sample and then averaging them.
Due to the wide variations observed within the granitoids, a more systematic study of thermal conductivity at room temperature is essential on varied granitoids, along with temperature dependence of thermal conductivity, to accurately assign initial thermal conductivity values in any thermal modelling.
5.3 Effect of the temperature dependence of thermal conductivity on thermal model
In thermal modelling, a fixed temperature coefficient is commonly considered for the upper and the mid-crust from the last few decades (e.g. Chapman 1986; Chopra & Ray 2020). But the upper crust generally consists of a different variety of granitoids, along with tonalitic gneiss and mafic volcanic rock in the mid-crust. In this study, it has been observed that temperature coefficients could be different for different types of granitoids. Granitoids with alkali feldspar granite to monzogranite composition show one temperature coefficient, whereas granodiorite to tonalite to quartz diorite composition show another temperature coefficient.
Previous studies show that thermal conductivity (e.g. Kukkonen et al. 1999), its variations with temperature and pressure (Norden et al. 2020) and heat production (e.g. Jaupart et al. 2016) can affect the thermal structure of the crust. In the light of the outcome of this study, our aim is to investigate further to know how the difference in temperature coefficient b for the upper crust can produce a difference in thermal structure considering other parameters constant, that is initial thermal conductivity and heat production model. Temperature coefficient b for the lower crust and pressure coefficient c for the entire crust are considered constant, using values from the previous studies (e.g. Chapman 1986).
Thus, to understand the effect of temperature coefficients on the thermal structure of the crust, a few plausible crustal heat production/thermal conductivity models are considered, by using crustal structures from the geological/geophysical studies of the study region (section 2.1), as well as using the knowledge from many geophysical studies globally on inclined cross-sections and deep boreholes, for example Kapuskasing uplift, Canada and Vredefort dome, South Africa. Global studies show the existence of the mid-crust in most of the crustal scenario. The overall crustal lithology is highly relevant for the geotherm calculation. Therefore, to make the analysis more general, both, two-layer and three-layer crustal models are discussed. These are (i) two-layer models with different upper crustal thicknesses (15 km, 20 km) (Models 1 and 3 in Figs 9 and 10), (ii) three-layer models with the mid-crustal layer (5 km), for both upper crustal thicknesses as mentioned above in (i) (Models 2 and 4 in Figs 9 and 10).
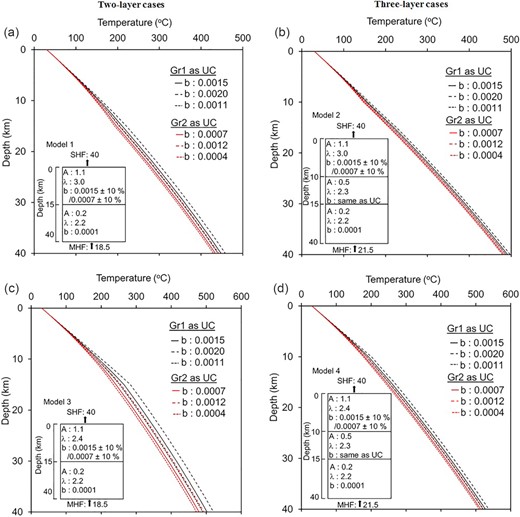
Crustal geotherms along with 1-D crustal heat production/thermal conductivity models. Abbreviations are—A: heat production (in μW m–3), λ: thermal conductivity (in W m–1 K–1), b: temperature coefficient (in K–1), UC: upper crust, SHF: surface heat flow, MHF: mantle heat flow, Gr1: UC with alkali feldspar granite to monzogranite, Gr2: UC with granodiorite to tonalite to quartz diorite. Geotherms with different b values for Gr1 and Gr2, keeping all other parameters same, are shown by different colours (black and red). Average, minimum and maximum temperature estimates for each model are shown by solid, dotted and dashed lines, respectively. Pressure coefficient is the same for all models.
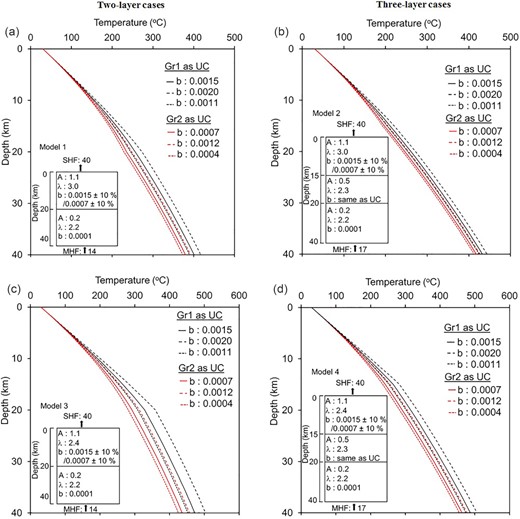
Crustal geotherms along with 1-D crustal heat production/thermal conductivity models. Except for upper crustal thickness, all parameters are similar as in Fig. 9.
Model 1 and Model 2 assume that upper crustal rocks are alkali feldspar granite to monzogranite with thermal conductivity 3.0 W m–1K–1. Different temperature coefficients (1.5 × 10⁻³ and 0.7 × 10⁻³ K–1) are considered to find out its effect on temperature by keeping other parameters same and shown by two different colours (solid lines in Figs 9a, b and 10a, b). Similarly, Model 3 and Model 4 assume that upper crustal rocks are granodiorite to tonalite to quartz diorite with thermal conductivity 2.4 W m –1K–1 with different temperature coefficients (solid lines in Figs 9c, d and 10c, d). In the case of the mid-crustal layer in the models (Model 2 and Model 4), it is considered as tonalitic gneiss/meta volcanic.
Further, ±10 per cent uncertainties in temperature coefficients are considered and shown by the dotted and dashed lines for all models. Results show (Table 5) few important things: (i) for a particular model, temperature coefficient can affect the temperature at Moho (∇Td) between 20 and 80 °C, (ii) introducing mid-crustal layer with similar upper and lower crustal parameters can change temperature by 30–90 °C at Moho (∇T31, ∇T42). Moreover, considering ±10 per cent uncertainty in thermal conductivity, the differences will be slightly lower (∇Td: 15–40 °C, and ∇T31, ∇T42: 30–55 °C). These imply the importance of considering proper temperature coefficients in addition to the other parameters discussed above.
Temperature estimates at Moho.
| Temperature (°C) | Model-1 | Model-2 | Model-3 | Model-4 | ∇T31 | ∇T42 |
|---|---|---|---|---|---|---|
| Output parameters related to Fig. 9 | ||||||
| Tmin | 430 | 479 | 472 | 510 | 42 | 31 |
| Tmax | 458 | 497 | 521 | 537 | 63 | 40 |
| ∇Td | 28 | 18 | 49 | 27 | – | – |
| Output parameters related to Fig. 10 | ||||||
| Tmin | 373 | 413 | 426 | 455 | 53 | 42 |
| Tmax | 417 | 444 | 503 | 506 | 86 | 62 |
| ∇Td | 44 | 31 | 77 | 51 | – | – |
Tmin, Tmax: minimum and maximum temperatures for each model; ∇Td: temperature difference for a particular model (Tmax − Tmin); ∇T31, ∇T42: temperature difference having same temperature coefficient with different initial thermal conductivity for two-layer and three-layer cases.
Thus, for a particular surface heat flow and heat production/thermal conductivity model, the temperature estimates in the crust and Moho depend on both parameters equally: the initial thermal conductivity of the upper crustal rock and its temperature coefficient. Inaccuracy in anyone of the parameters drastically changes temperature estimates and yields a significantly different result. Therefore, in thermal modelling, it is of utmost importance to consider appropriate granitoid type for the upper crustal rocks and consequently consider proper initial thermal conductivity and temperature coefficients to arrive at correct estimates.
6 CONCLUSIONS
Merging the decrease of thermal conductivity with temperature for the four types of granitoids (N = 34) from present study with previously reported data (N = 6), the following generalisations can be made.
Thermal conductivity at room temperature for granitoids depicts a wide range in general and specific range for particular granitoids. Among the studied granitoids, it is highest for metasomatised granodiorite and alkali granite, intermediate for biotite granite, while lowest for granodiorite. Considering all data at elevated temperature, it ranges from 2.4 to 3.6 W m–1 K–1 with an average of 3.0 W m–1 K–1 for alkali feldspar granite to monzogranite and ranges from 2.0 to 2.8 W m–1 K–1 with an average of 2.4 W m–1 K–1 for granodiorite to tonalite to quartz diorite.
The decrease of lattice thermal conductivity up to 300 °C is highest for metasomatised granodiorite and alkali granite, intermediate for biotite granite, and lowest for granodiorite. In the expression λT = λRT (1 + bT)–1, the temperature coefficient b varies between 1.3 × 10⁻³ K–1 and 1.7 × 10⁻³ K–1 for biotite granite, alkali granite and metasomatised granodiorite, but much different for granodiorite (0.66 × 10⁻³ K–1).
By and large, two b values could be used; 1.5 × 10⁻³ K–1 for alkali feldspar granite to monzogranite and 0.7 × 10⁻³ K–1 for granodiorite to tonalite to quartz diorite.
Thermal conductivity at room temperature and their temperature dependency for both varieties of granitoids, that is the alkali feldspar granite to monzogranite and granodiorite to tonalite to quartz diorite, show an increasing trend with quartz and alkali feldspar, whereas show decreasing trend with plagioclase feldspar. Therefore, quartz and different varieties of feldspar content, that is granitoid type, are primary parameters in controlling the thermal conductivity of granitoids at room temperature and their temperature dependency.
Expressions have been derived to determine variations in thermal conductivity with temperature (D) and temperature coefficient (b) for compositionally different granitoids by using thermal conductivity at room temperature (λRT). For the alkali feldspar granite to monzogranite these are D = 10.13 × λRT − 0.39 and b = 0.71 × λRT − 0.63, whereas for the granodiorite to tonalite to quartz diorite these are D = 16.02 × λRT − 20.83 and b = 0.83 × λRT − 1.26.
1-D steady-state thermal modelling, on different heat production/thermal conductivity models considering two b-values for the upper crust and ±10 per cent uncertainties in them, shows that difference in temperature estimates at the Moho could be as much as 90 °C. This indicates the utmost importance of assigning an appropriate value of thermal conductivity and its temperature coefficient of the upper crust according to its composition to arrive at accurate temperature estimates.
SUPPORTING INFORMATION
Supplementary Table T1. Thermal conductivity at room temperature for the granitoids from various cratons of the world.
Supplementary Table T2. Measured and calculated thermal conductivity, along with deviations.
Supplementary Figure F1.(a) Steady-state apparatus (guarded heat flow meter, DTC-300), (b) schematic diagram of stack and (c) calibration curves in the temperature range 50–300 °C using five standard samples (according to ASTM E1530 standards). Thicknesses (in mm) of the standards are given in parentheses.
Supplementary Figure F2. Harker's plot of the studied granitoid, that is alkali granite, biotite granite, granodiorite and metasomatised granodiorite.
Supplementary Figure F3. Thermal conductivity of the granitoids in the temperature range 0–300 °C from the previous studies. These are, 5: Birch & Clark (1940); 6: Seipold (1990); 7 & 8: Miao et al. (2014).
Supplementary Figure F4. Plot showing QAP diagram for the samples of Fuchs et al. (2018) and Jennings et al. (2019). NORM derived mineral data are used and nomenclature is considered as given by authors. Considered those samples for which mineral data are also available.
Supporting Information Dataset D1: Major oxides (in wt. per cent) of the studied granitoids.
Supporting Information Dataset D2: Geological details of the studied granitoids.
Supporting Information Dataset D3: Thermal conductivity, density and porosity of the studied granitoids at room temperature.
Supporting Information Dataset D4: Thermal conductivity of the studied granitoids at elevated temperatures (from 25–300°C).
Supporting Information Dataset D5: CIPW normative modal mineralogy (in volume per cent) of the studied granitoids.
Please note: Oxford University Press is not responsible for the content or functionality of any supporting materials supplied by the authors. Any queries (other than missing material) should be directed to the corresponding author for the paper.
ACKNOWLEDGEMENTS
Research is supported by the SHORE (PSC-0205) and GEOMET (MLP-0002–28-FBR-2) projects funded by the Council of Scientific and Industrial Research, India, and MOES/P.O.(Geo)/116/2017 project funded by the Ministry of Earth Sciences, India. We acknowledge S. P. Singh, Bundelkhand University, for his support in field work and geological discussions; K. Mahesh and S. Seshikanth Babu for preparing samples; Keshav Krishna for measuring major oxides in the XRF laboratory of CSIR-NGRI; Vikash Tripathy, Geological Survey of India, Hyderabad, for helping in the modal analysis by petrography. Our sincere thanks to the reviewers, Ilmo Kukkonen and Derrick Hasterok, Associate Editor Louise Alexander, and Editor Eduard Petrovsky, for their critical as well as constructive comments and valuable suggestions that helped to improve the paper substantially. Thanks to Director, CSIR-National Geophysical Research Institute (NGRI), for encouragement and giving permission for the publication. The reference number of the paper is NGRI/Lib/2020/Pub-125.
DATA AVAILABILITY
The data underlying this paper are available in the article and its online supplementary material.
