


SUMMARY
We present new shear wave anisotropy measurements in the continental crust along the Mexican subduction zone obtained from tectonic tremor. The new measurements were made in the states of Jalisco, Colima, Michoacán and Oaxaca. To make a complete analysis of the anisotropic crustal structure, we also include previous measurements reported in Guerrero using tremor signals. Since tectonic tremor is abundant along the Mexican subduction zone, it offers an opportunity to determine anisotropy parameters in this region. Polarization and splitting analyses were performed using broad-band, three-component seismograms. Results show that splitting times range between 0.07 and 0.34 s. These values are similar to the splitting magnitudes typically observed in the continental crust. Fast polarization azimuths are variable in Jalisco, Colima and Michoacán, but some of them tend to align with the regional stress field (margin-normal and maximum horizontal compressive stresses). On the other hand, the fast axes at the remaining stations are margin parallel, suggesting that in this case anisotropy could be controlled by active crustal faulting or geological structures. In Oaxaca, fast polarization directions tend to align with Tertiary inactive faults and are oblique with respect to the local stress field, which suggest that anisotropic geological structures are the source of anisotropy.
1 INTRODUCTION
Slow Slip Events (SSE) were first discovered in the Nankai subduction zone (Heki et al.1997; Hirose et al.1999; Ozawa et al.2001). Additionally, seismic, or tectonic tremors (TTs, Obara 2002) have been observed worldwide. According to Rogers & Dragert (2003) SSEs, they are slow, repeated motions of the crust observed to happen in the interface between the subducted slab and the continental crust. Furthermore, a seismic signal named TT has been found to correlate with SSE in space and time. This phenomenon has been dubbed Episodic Tremor and Slip (ETS) by Rogers & Dragert (2003). ETS have been discovered and analysed in various subduction zones such as Cascadia (Dragert et al.2001; Rogers & Dragert 2003), Mexico (Husker et al.2012), Alaska (Peterson & Christensen 2009) and Costa Rica (Brown et al.2009), and even in the San Andreas transform fault (Nadeau & Dolenc 2005). TTs were initially interpreted as hydraulic fracturing due to metamorphic dehydration during subduction of the oceanic slab (Obara 2002). Tremor signals lack high-frequency waves (1–10 Hz) compared to ordinary earthquakes, and they are not easily located using traditional earthquake location methods mainly due to their weak and emergent waveforms.
Additionally, TT persists longer in time than ordinary earthquakes, with durations varying from some minutes to several days. TT energy is more prominent in the horizontal components of seismograms and has moveouts that are consistent with S waves. Based on studies performed in the Nankai subduction zone, TT has been explained as a sequence of small shear failures on the transition section of the oceanic subducting plate interface (Ide et al.2007; Shelly et al.2007; La Rocca et al.2009).
Slow slip phenomena in the Mexican subduction zone (MSZ) have been analysed by several authors using GPS data (e.g. Lowry et al.2001; Kostoglodov et al.2003, 2010; Larson et al.2007; Payero et al.2008; Radiguet et al.2011; Ide 2012), and several permanent and temporary seismic stations have been used for tremor analysis (e.g. Brudzinski et al.2010; Husker et al.2012; Ide 2012). Studies in the region, however, have mainly focused on the southern Mexican states of Guerrero (Husker et al.2012) and Oaxaca (Brudzinski et al.2010). The MSZ is a complex tectonic environment where two oceanic plates, the small Rivera microplate and the Cocos plate, subduct under the North American continental plate (see arrows in Fig. 1). The subduction angle at this convergent margin is steep for the Rivera plate under Jalisco and Colima states. The Cocos slab is flat under Michoacán, Guerrero and western Oaxaca states, but it steepens under eastern Oaxaca and Chiapas states (Pardo & Suarez 1995) (dashed lines in Fig. 1). TT in Jalisco and Michoacán has been analysed by Ide (2012) using data from the MARS (Mapping the Rivera Subduction Zone) network that operated from 2006 January to 2007 June (Yang et al.2009). Ide (2012) reported more than 1500 tremor hypocentres over a period of 18 months with a typical duration of 10–20 s and located at an average depth of 20–30 km (Fig. 1). In Guerrero, TT has a hypocentre average depth of 45 km and occurs at two different locations (Fig. 1). (1) TT is recorded permanently in the Sweet Spot, around 130 km from the coast, (Husker et al.2012) and does not coincide with the area of maximum displacement of slow slip (Kostoglodov et al.2010). Husker et al. (2012) define the term ‘Sweet Spot’ as the geographical area where TT occurs persistently due to the existence of proper physical conditions of temperature, pressure and fluid content that allows TT to happen with a minimum of shear slip. (2) Low-energy signals appear mostly during slow slip episodes at ∼55 km from the coast, updip from the Sweet Spot (Husker et al.2012). In Oaxaca, TT is found at ∼100 km from the coast (Brudzinski et al.2010, see Fig. 1). Their best-resolved epicentres revealed that TT occurs over an elongated area of 125 km by 75 km (Brudzinski et al.2010). The distribution patch of activity is centred ∼170 km away from the Middle America trench, between the iso-depth contours of 40 and 60 km (Pardo & Suarez 1995) and it is parallel to the trench. Moreover, TT in Oaxaca occurs in a high conductivity area resulting from fluids released during metamorphic dehydration (Jödicke et al.2006). A similar high conductivity zone was also reported in Guerrero (Jödicke et al.2006), in addition to a high VP/VS ratio (Huesca-Pérez & Husker 2012). In Oaxaca, GPS analysis finds that slow slip occurs updip from the patch of TT (Brudzinski et al.2010). Likewise, in Guerrero, the Sweet Spot is located downdip from the slow slip area.

Tectonic plate map of the Mexican subduction zone. Panel a: three interacting plates compose this margin, where the oceanic Cocos and Rivera plates subduct under the continental North American plate. The convergence velocity varies from 1.7 cm yr−1 in Jalisco to 6.8 cm yr−1 in Oaxaca (grey arrows). The dashed lines represent the iso-depth contours determined for the Rivera and Cocos plates under North America by Pardo & Suarez (1995). The east–west shaded area in the north represents the TMVB. The blue boxes show the study regions. Black solid triangles represent the seismic stations used in this study. The orange dots and shaded area represent the location of TT activity in Mexico. Grey dots represent the seismic activity reported by SSN. Dashed pink lines represent the limits of the Jalisco, Michoacán and Guerrero blocks. Panel b is a zoom of the study area at western Mexico. Brown continuous lines represent the location of the major fault systems in the study areas. Panel c is a tectono-stratigraphic map of southern Mexico (coloured zones). Black boxes show the regions analysed by Soto et al. (2009), Huesca et al. (2016) and the present study. Acronyms: TMVB, Trans-Mexican Volcanic Belt; PVB, Puerto Vallarta Batholith; MP, Manzanillo pluton; ChR, Chapala rift; TJ, triple junction TZ, Tepic-Zocoalco rift; JB, Jalisco Block; MB, Michoacán Block and, GB, Guerrero Block. G, Mi, X, O and J are the Guerrero, Mixteco, Xolapa, Oaxaca and Jalapa terranes, respectively.
This article is organized as follows: (1) first we describe the tectonic settings of the region, summarizing the main lithological units that cause seismic anisotropy. It is important to note that this is a companion article that extends our results to the subduction zone of Mexico. A previous article of Huesca et al. (2016) studied the region of Guerrero and here we analyse the entire subduction zone of Mexico adding two new regions, Jalisco and Oaxaca, that flank the Guerrero region, at the west and east, respectively. (2) We describe the data processing and (3) we discuss the causes of anisotropy in the MSZ, with focus on the Jalisco–Colima–Michoacán and Oaxaca provinces. Finally, we give a brief overview of the anisotropy of the MSZ.
1.1 Tectonic and geological setting
As stated before, three tectonic plates interact in the MSZ. Two of them, the Rivera and Cocos plates underthrust the North America plate along the Middle America trench. The subduction rate of the subducting plates increases with age towards the southeast and the subduction geometry varies from steep subduction in Jalisco and Michoacán to subhorizontal subduction in Guerrero and then back to steep subduction in Oaxaca. The volcanoes in the MSZ are about 300 km from the trench forming the Trans-Mexican Volcanic Belt (TMVB) with a 16° angle respect to the trench. The volcanic arc ends where the Cocos slab reaches ∼100 km depth. The TMVB is considered to be linked to the subduction of the oceanic plate in the trench with its distribution following the geometry of the subducted slab.
According to Johnson & Harrison (1990), the crust located southwest of the TMVB can be divided into Jalisco, Michoacán and Guerrero blocks (Fig. 1). They further proposed that the blocks are moving independently from the North American plate as rigid bodies deforming at the borders, where seismic activity is present. The relative motion of these blocks produce faulting at the north part of the TMVB. It has also been proposed that the Jalisco block is starting to separate from mainland Mexico in a northwest direction (Bourgeois et al.1988; Allan et al.1991). The Colima rift is a structure predominantly oriented north–south, dividing the Jalisco from the Michoacán block (Johnson & Harrison 1990). The Colima rift is the southern branch of a rift–rift–rift system with the triple junction located to the north (Johnson & Harrison 1990; Pacheco et al.2003). The other two elements of the triple rift system are the Tepic-Zacoalco rift running northwest from the triple junction, and the Chapala rift extending eastward from the triple junction (Pacheco et al.2003). The Colima rift consists of three morphologically subrifts (Allan et al.1991; Pacheco et al.2003): the northern and central Colima grabens, and the southern Colima rift. The Colima rift is seismically active (Suárez et al.1994; Castellanos & Jiménez 1995; Pacheco et al.2003; Andrews et al.2011; Gutierrez et al.2015).
The Jalisco block is limited to the north by Tepic-Zacoalco rift, to the southeast by the Colima rift and to the south by the Middle America Trench. The Jalisco block is composed by different lithologic structures. At the coast, there is a late Cretaceous–Palaeocene plutonic belt (Schaaf et al.1993, 1995); and to the NE, there is a Cretaceous to early Cenozoic zone with silicic ashes flows that were intruded by Plio-Quaternary basalts (Wallace & Carmichael 1992). The thickness of the central Jalisco block has been inferred to be around 40 km (Urrutia-Fucugauchi & Flores-Ruiz 1996) and it is thought to be part of the Guerrero Terrane. This terrane was dominated by major periods of magmatism during the Mesozoic and extends from Sinaloa to Taxco (Valencia et al.2013). However, the western part of the Guerrero Terrane is scarcely studied and very little is known about its age and composition of its basement lithology (Valencia et al.2013). The Jalisco block has undergone rifting, batholith intrusion, early Cretaceous to Holocene volcanism and sedimentation (Taran et al.2002) and it can be divided into two geological domains that are based on the lithology of the exposed rocks. In the southwestern domain, there are Cretaceous to Palaeocene rocks that are calc-alkaline intrusive rocks (granite to tonalite) and sedimentary and volcano-sedimentary roof pendants (Schaaf et al.1995). Puerto Vallarta is a batholith composed with high-silica granite and white mica. The Manzanillo pluton is composed by plagiogranites, gabbros, granites and granodiorites as well as late Triassic metasedimentary rocks and middle Jurassic marine turbidities (Corbo-Camargo et al.2013).
The counterminus Michoacán block, located to the east of the Jalisco block is limited by the Río Balsas to the east, the Colima rift to the west, the Chapala rift and the Michoacán—Guanajuato volcanic field to the north, and the Middle America Trench to the south (Mosser 1972). The Michoacán block is a Cretaceous–early Tertiary batholith (Schaaf et al.1995) that intruded volcanic sediments from the Cretaceous of the Alberta and Tepalcatepec formations (Pimentel 1980). The volcanic sediments are intercalated with ash-flow tuffs and minor andesitic lava flows (Rodriguez 1980). Also, a Cretaceous limestone lies above this sequence. Subsurface geology performed by PEMEX (Mexican Petroleum Agency) determined that the Mesozoic rocks have a thickness between 2500 and 6000 m. The coast of the Michoacán block is a plutonic belt conformed by granitic rocks (Schaaf et al.1995). The ages for this geological unit were determined to be between 53 and 68 Ma, and it is a remnant Tertiary magmatic arc root parallel to the volcanic field of Sierra Madre del Sur developed during the earliest Tertiary (Morán-Zenteno et al.1999).
To the south-east of Mexico, in Oaxaca, the geology is highly influenced by the development of the North America–Caribbean plate boundary during the early Tertiary. It has been proposed that the Chortis block or the Central America isthmus was an integral part of the North America plate during the Jurassic to late Cretaceous (Meschede & Frisch 1998). During the late Cretaceous, the Chortis block detached from the North America plate and started to move to the east as a consequence of a change in the subduction convergence of the Farallon plate direction from normal to oblique (Meschede et al.1996). This resulted in a truncation of the continental margin of southern Mexico (Schaaf et al.1995) where middle to lower crustal rocks were digged up along a ∼60 km coastal band (Morán-Zenteno et al.1996). Cerca & Ferrari (2001) reported an episode of shortening of the Laramide Orogeny (between 88 and 67 Ma) that was followed by left-lateral transpression during the early Tertiary that deformed a wide band of 250 km northern to the modern coast. During the late Eocene, the stress regime changed from transpression to transtension that induced silica volcanism (Morán-Zenteno et al.1999).
The Mixteco terrane to the west (in Guerrero state) and the Oaxaca complex have the oldest basements in the south of Mexico. These complexes are composed by Precambrian metamorphic rocks, sedimentary rocks and a volcanic cover of Tertiary age (Campa & Coney 1983). The Mixteco terrane was formed between late Ordovician and early Silurian during the Acatecan orogeny related to the closure of the Iapetus Ocean (Ortega-Gutierrez et al.1999) that sutured the Mixteco terrane with the Oaxaca complex. On the other hand, the boundary of the Juarez terrane and the Oaxaca complex is the north–south mylonitic Sierra de Juárez complex which registers right-lateral movements. This deformation is related to the opening of the Gulf of México and the southward migration of the Yucatán block during Jurassic times. In addition, the eastern boundary of the Juarez terrane is the Vista Hermosa fault zone which is a transitional area from a thick continental crust to a thin Maya terrane thinned during the opening of the Gulf of Mexico. The crust thickness decreases from 45 km in the central part of Oaxaca to 25 km in the Tehuantepec isthmus zone (García-Pérez & Urrutia-Fucugauchi 1997) indicating that was partially emergent by late Cretaceous times presenting well-developed boundaries. South of the Mixteco terrane is located the Xolapa terrane composed of gneisses intruded by Cenozoic calc-alcaline plutons (Ducea et al.2004).
1.2 Previous work in the study area
Few papers concerning seismic anisotropy of the continental crust along the MSZ are available even though a few studies have documented the occurrence of local, crustal seismicity (e.g. Chávez-Hernández 2014; Gutierrez et al.2015). Soto et al. (2009) measured anisotropy using S-wave polarizations from local, intraslab earthquakes recorded by the MARS array. For the southern Jalisco block, they concluded that anisotropy is caused by stress-aligned fluid-filled microcracks in the uppermost crust (Soto et al.2009). The existence of tremor activity all along the subduction margin opens the possibility of analysing the polarization of these recurrent signals. Anisotropy studies using TT signals have been performed successfully in Vancouver Island, Canada (Bostock & Christensen 2012), in northern Washington State (Huesca-Pérez & Ghosh 2015), southern Cascadia (Huesca-Pérez et al.2017) and in Guerrero state at the MSZ (Huesca-Pérez et al.2016). However, crustal anisotropy has also been studied using other methods such as receiver functions (Castellanos et al.2017), P-wave azimuthal variations (Crampin et al.1980; Ji et al.1993), and surface wave analysis (Stubailo et al.2012). In this work, we quantify crustal seismic anisotropy using TT signals previously documented in Jalisco, Colima and Michoacán by Ide (2012) (Fig. 1, panel b), and in Oaxaca by Brudzinski et al. (2010) (Fig. 1, eastern box).
1.3 Crustal anisotropy
We can compute seismic anisotropy using the covariance method of Silver & Chan (1991). Two parameters can be quantified. These are the fast polarization direction, and the splitting time, or delay time, between the fast and the slow arrivals. Upon entering an anisotropic medium, a shear wave splits into two perpendicularly polarized waves travelling at different velocities. TT signals are S wave (Bostock & Christensen 2012), used to measure seismic anisotropy. The structure of the continental crust is complex and heterogeneous, and at least three possible causes have been proposed to explain its anisotropy. (1) Mineral lattice alignment in foliations. Several minerals such as greenschist facies basalts, phyllites, quartz schists, micas or gneiss are highly anisotropic and abundant in foliations (Christensen 1996). In this case, seismic waves propagate faster along the foliation than perpendicular to it. This mechanism has explained several observations worldwide. For instance, for the Alpine Fault in New Zealand, Okaya et al. (1995) found that waves propagating parallel to the foliation of the Haast Schist travelled 1 km s−1 faster than waves propagating perpendicular. Additionally, strong deformation in rocks or melt intrusions has been shown to produce a preferential alignment of minerals which is explained of having dominant slip system planes and slip directions that are coincident with the directions of the flow plane (Nicholas & Christensen 1987). (2) Fault zone anisotropy. For this mechanism, shear waves that travel parallel to the fault azimuth can undergo splitting due to anisotropic mineral within the fault zone or local fault zone stress regime. The stress field will induce fracture alignment (Balfour et al.2005; Boness & Zoback 2006; Bostock & Christensen 2012) and stress will induce the microcracks within the mineral crystals to rotate producing anisotropy in that direction. Also, shear can induce rotation of crystals without requiring microcracking, such as crystals in a quartz matrix; quartz can soften during shear (warming) which allows other crystals to rotate. This is how S-C fabrics can develop within a shear or fault zone (Lena et al.2014). In the case of mica crystals this shear can become very anisotropic. (3) Stress-induced crustal anisotropy has been analysed by Crampin (1994). In this case, the anisotropy results from the alignment of fluid-filled cracks along the maximum compressive stress orientation. Cracks will remain open only if they are parallel to the maximum compressive stress direction. A total of 1–10 per cent anisotropy can be produced depending on the density of cracks within the rock (Crampin 1994). Crampin & Chastin (2003) established that stress is zero at the surface, and therefore, cracks which are deeper than a critical depth tend to align vertically and are usually parallel to the maximum horizontal compressive stress, producing horizontal polarizations that are stress parallel (Crampin 1985). In fracture zones, it is difficult to distinguish whether anisotropy is induced by stress or mineral structure, especially if the maximum compressive stress is subparallel to the planes of the fractures (Balfour et al.2012). Cassidy & Bostock (1996) determined that splitting times are larger in the uppermost 20 km of the continental crust when compared to the bottom crust. This phenomenon can be explained because the upper crust is more heterogeneous, crystalline and fractured, and hence the anisotropic measurements can be related to microcracks produced by the stress field. On the other hand, anisotropy in the lower crust can be related to mineral alignment from shear and chemically modified rock (Balfour et al.2012).
2 DATA AND METHOD
We have used data from all available networks. In the Jalisco–Michoacán area we used the broad-band stations of the MARS seismic array, which were operational from 2006 January to 2007 June. We have downloaded tremor data from the Incorporated Research Institutions for Seismology Data Management Center (IRIS DMC) using as a reference the time period of TT activity catalogue reported by Ide (2012) for 2006 and 2007. In Oaxaca, we used broad-band stations from the Servicio Sismológico Nacional (SSN) permanent network (SSN 2007), and from the Oaxaca Network (OXNET) (Brudzinski et al.2010). OXNET data were processed following the time periods of TT activity reported in the catalogue of Brudzinski et al. (2010) for 2006 and 2007. To process SSN data, we used the TT activity periods reported in the catalogue of Allen Husker between 2013 and 2016. For interpretation of the anisotropic results, we downloaded all available stress field data from the World Stress Map Project (Heidbach et al.2008) that includes borehole, seismic and structural data.
Data were analysed using the method of Bostock & Christensen (2012). The polarization analysis required three-component broad-band seismograms that we have filtered between 1–8 Hz. This frequency range will determine TT wave lengths (∼0.44–3.5 km assuming a shear average velocity of 3.5 km s−1) that will propagate through crustal anisotropic structures, so we can analyse anisotropic structures of ∼500 m or larger. We processed the data in two separate steps. (1) Wave polarizations. The polarization was estimated using 1-min-long windows of the data time-series by computing the covariance matrix at each window. The polarization parameters can be extracted by solving the eigenvalue problem and then diagonalizing the matrix to determine the directions of the principal axes. These angles will indicate the directions of polarization S(i) = 1,2,3 sorted in descending order (Jurkevics 1988). TT signals are S waves (Bostock & Christensen 2012), and they originate at the plate interface (Brown et al.2009; La Rocca et al.2010), so they carry no contribution from the mantle (Bostock & Christensen 2012). The S(3) direction associated with the minimum eigenvalue is used to estimate the incidence angle with respect to the vertical, and the backazimuth of the wave measured from the north. The polarization attributes can be used to quantify the quality of the analysis. When TT signals have large amplitudes, the eigenvalues will behave as λ(1) ≈ λ(2) » λ(3) (Bostock & Christensen 2012). By choosing ray angles less than 20° from the vertical, horizontal polarizations will be selected, and converted phases avoided. The elliptical polarizations can be chosen by establishing the differences of the normalized eigenvalues (Booth & Crampin 1985; Bostock & Chistensen 2012) such that (λ(2)/λ(1)—λ(3)/λ(1)) ≥ 0.5 for each 1-min-long window. (2) In the second step of the analysis, a standard anisotropy method (Silver & Chan 1991) is applied to each 1-min-long window. A combination of delay times (δt) and fast directions (φ) is searched to minimize the second eigenvalue of the covariance matrix obtained after correcting for the splitting times. The minimum for the second eigenvalue will occur for the combination (φ, δt) corresponding to the maximum value for the cross-correlation, i.e., the slow and fast waves.
After processing the data, plots like Fig. 2a are obtained for each station. Fig. 2a depicts the anisotropy parameters (φ, δt) and the polarization values. In this example, the parameters are shown for SSN station TXIG, located in Oaxaca, for day 2013 March 18, using a 23-h-long record. It can be observed that backazimuths tend to concentrate around 130°, meaning that the energy is coming mainly from the southwest. Ray angles less than 20° from the vertical were chosen. Measurements whose difference between the normalized eigenvalues is greater than 0.5 are represented by the red dots that coincide with TT pulses. Backazimuths and ray angles can be used to control how tremor rays sample the crust. Fig. 2(b) shows a cartoon illustrating this procedure.
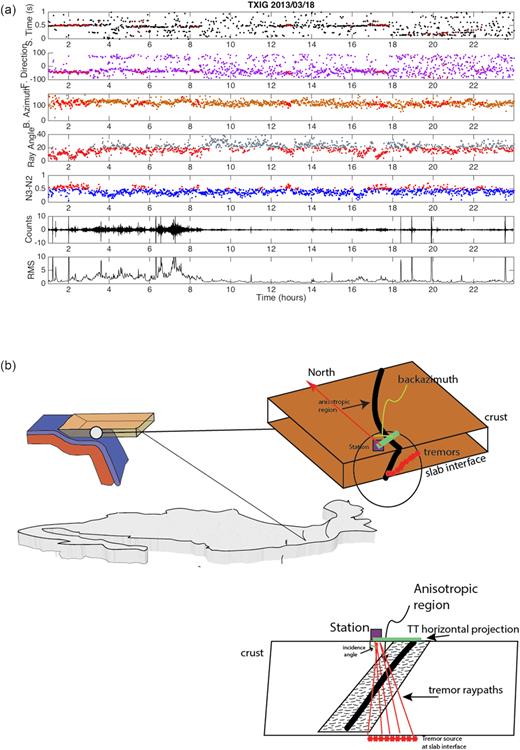
(a) The 23-h plot of anisotropic parameters and polarization attributes computed for central Oaxaca State station TXIG. The data were recorded on 2013 March 18. Each panel displays different information computed on 1-min-long windows: (a) splitting times, δt (black dots); (b) fast polarization azimuths, φ (purple dots); (c) backazimuths (brown dots); (d) ray angles (grey dots); (e) the differences between normalized eigenvalues (λ(2)/λ(1)—λ(3)/λ(1)) (blue dots); (f) the east–west component of seismogram; and (g) rms amplitude. The red dots for splitting times and fast polarization panels indicate the final selected measurements for this day after applying the polarization criterion (λ(2)/λ(1)—λ(3)/λ(1)) > 0.5 and ray angle < 20°. (b) Cartoon illustrating tremor sources (red stars) and ray paths (red lines) that sample an anisotropic structure. The polarization ellipsoid allows to determine the backazimuth that represents the direction from where tremor rays are coming with respect to the station (purple box) (top panel) and the incidence angle of the tremor ray that arrives to the station (bottom panel). These two parameters define a tremor sampling band (green bar) of the crust.
Fig. 3(a) shows the histogram for splitting times, and Fig. 3(b), the rose diagram for fast polarization directions for all measurements made at station TXIG. The plots are computed using only the observations which met the polarization criterion. Fast directions are measured and plotted from north (0°) towards the east (90°). The splitting time histogram was divided into 50 bins (Bostock & Christensen 2012). For the rose diagrams, the bin width is 7.2°, and for the splitting time histograms, the bin width is 0.02 s. According to the method proposed by Bostock & Christensen (2012), the anisotropy (Table 1) can be quantified by computing the circular mean, the circular median and the mode that is determined as the mean azimuth of the bin that contains the largest number of measurements. The anisotropic parameters can be simplified at each station to a single pair (φ, δt) by taking the arithmetic mean of all the splitting times that fall within the azimuthal bin that is identified with the fast direction mode (Bostock & Christensen 2012). This is analogous to estimate the mean direction in directional statistics since the angles are constrained in a small range. The splitting results of Table 1 represent the mean of the maximum bin containing the delay time measurements. The volume of the crust that TT signals are sampling can be estimated by taking the average ray angle and the average backazimuth. For example, at TXIG the ray-angle parameter has an average of 12° from the vertical. At that location, the slab interface is located at ∼50 km depth. In this case, the algorithm will only select signals coming from no more than 10 km away from the station measured in the horizontal direction i.e. almost vertical ray paths. Additionally, the direction from which TT signals are coming can be determined by inspecting the average backazimuth, in this case from N125° E. Fig. 2(b) is a cartoon that illustrates this analysis graphically.
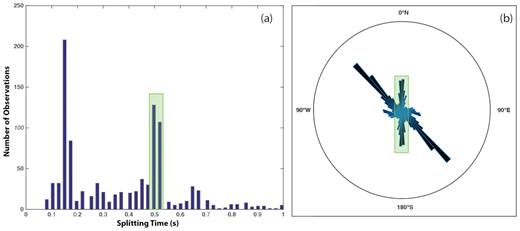
(a) Histogram for splitting times and (b) rose diagram for fast wave azimuths obtained for station TXIG using all available data. The means and medians are computed using the bin that contains the maximum number of observations. The symmetry observed in the rose diagram is due to the plotting range of ± 180°. The green shaded box remarks a second source of anisotropy detected at this station.
Splitting parameters at stations determined in this study.
| Fast direction (deg) | Splitting time (s) | ||||||||
|---|---|---|---|---|---|---|---|---|---|
| Station Name | Latitude (°N) | Longitude (°E) | Mean | Median | Standard deviation | Mean | Median | Standard deviation | Number of data |
| MA05 | 18.92 | −103.13 | 33 | 33 | 6.15 | 0.07 | 0.08 | 7.21 | 400 |
| MA07 | 18.89 | −102.79 | 140 | 141 | 1.32 | 0.21 | 0.22 | 5.74 | 101 |
| MA11 | 18.43 | −102.34 | 11 | 11 | 18.93 | 0.07 | 0.08 | 13.16 | 720 |
| MA19 | 18.91 | −103.56 | 126 | 126 | 3.92 | 0.1 | 0.1 | 9.44 | 51 |
| MA26 | 19.31 | −103.94 | 25 | 25 | 7.67 | 0.07 | 0.08 | 14.52 | 907 |
| MA37 | 19.90 | −105.32 | 112 | 112 | 2.1 | 0.11 | 0.1 | 11.01 | 3298 |
| MA38 | 19.96 | −104.98 | 32 | 32 | 6.14 | 0.1 | 0.1 | 7.8 | 44 |
| OXEC | 16.52 | −96.06 | 162 | 162 | 1.23 | 0.11 | 0.1 | 11.15 | 689 |
| OXNC | 17.40 | −97.22 | 155 | 155 | 1.32 | 0.34 | 0.35 | 4.73 | 1212 |
| OXSV | 16.63 | −96.91 | 104 | 104 | 1.89 | 0.21 | 0.2 | 5.75 | 5283 |
| TLIG | 17.56 | −98.57 | 39 | 39 | 4.89 | 0.21 | 0.2 | 4.89 | 62 |
| TXIG | 17.25 | −97.76 | 140 | 140 | 1.43 | 0.16 | 0.15 | 6.75 | 814 |
For station TXIG, splitting times tend to concentrate at two different values of ∼0.15 and ∼0.5 s (Fig. 3a) showing a bimodal anisotropic distribution. The main splitting time peak is located at 0.15 s, whereas the polarization azimuths tend to be oriented towards N140° E (Fig. 3b). The second peak at 0.5 s may be related to a possible second source of anisotropy observed at this station. The bimodal distribution is always present at different time periods of TT activity used to compute the anisotropic parameters at station TXIG, and variations were also observed in the backazimuths from around N80° E to N130° E. It was noted that tremor signals that have backazimuths greater than N100° E tend to be preferentially associated with splitting times of 0.5 s. It means that this second anisotropic source, which is highly rare for the continental crust and not seen in other stations analysed in this study, could be related to anisotropic minerals that exist slightly to the north respect to the average backazimuth. So, a few signals that are sampling the crustal structure at N100° E are producing the second peak in Fig. 3(a) and fast polarization directions oriented N–S in Fig. 3(b). Other measurements can be seen to cluster outside of the main average splitting time of 0.15 s. These minor peaks can be observed at ∼0.25, ∼0.65 and ∼0.85 s and could be related to ‘cycle skipping’ (Fig. 3a). The N–S peak observed in Fig. 3(b) is not a cycle skipping artefact because it is not 90° away from the main peak that is oriented at N140° E. However, the third peak trending nearly E–W is indeed an artefact of cycle skipping of the N–S peak because it is oriented 90° from north. This phenomenon may occur in sinusoidal data when splitting times are not correctly determined because of a trade-off that is a multiple of the wave's period of the dominant wave. According to Castellazzi et al. (2015), the trade-off can be expressed as |$d t{^{\prime}} = dt - T/2$|, where |$dt{^{\prime}}$| is the trade-off splitting time, |$dt$| is the correct splitting time and T is the period of the dominant wave. In an elastic medium that is anisotropic, the S wave is decomposed into a fast and a slow component. If the anisotropy were corrected properly by offsetting the seismograms by |$dt$|, then the trough and peaks of both waves would align yielding a linear particle motion diagram (Castellazzi et al.2015). If they were improperly corrected by the fake |$dt{^{\prime}}$|, the peaks would align with the troughs, and thus the amplitude of the slow wave would go up while the amplitude of fast wave would go down (Castellazzi et al.2015). Waveforms that are offset by cycle-skipping can be either correct or 90° from the correct value. In our study, even though there is evidence for multiple peaks in the delay time histograms, which shows that cycle skipping is occurring, only a few measurements have their fast azimuths 90°. Consequently, cycle skipping has a minimal effect on the fast directions average.
3 ANISOTROPY SOURCE AND DIRECTIONS
The crustal anisotropy results determined at each station are listed in Table 1 and shown in a map for the western end of the MSZ (Fig. 4a), and for Oaxaca state (Fig. 4b). These areas are located to the northwest and southeast, respectively, of the Guerrero region (Fig. 1) previously analysed by Huesca-Pérez et al. (2016). The anisotropy is represented by solid blue bars centred at the stations (red triangles). The bars are scaled proportional to the magnitude of the mean of the splitting time, and oriented with the mean direction of the fast wave, measured clockwise from north. Solid green lines represent the mean of the backazimuth, also centred at a station. The length of the green bar represents the mean of the ray angle parameter as determined from the polarization ellipsoid projected onto the Earth surface plane considering that TT signals are emitted at the subducted slab interface depth (Bostock & Cristensen 2012). As stated in the previous section, since we do not know the location of each tremor signal that the algorithm uses for the analysis it is not possible to compute the geometry of their ray paths using traditional ray path tracing methods to investigate the region of the crust that tremor rays are sampling. Instead we use the polarization criterion of Jurkeviks (1988) to estimate TT ray paths so we can know what part of the crust is sampled (Fig. 2b). The results at the western end of the MSZ (Fig. 4a) do not show a clear pattern in the anisotropic structure given that the fast polarization directions change from station to station. On the other hand, in Oaxaca state, fast polarization directions are generally oriented NW–SE and are oblique to the trench. The splitting times range between 0.07 and 0.34 s and they are consistent with other observations in the continental crust (Cassidy & Bostock 1996; Huang et al.2011; Yang et al.2011; Balfour et al2012; Huesca-Pérez & Ghosh 2015; Huesca-Pérez et al.2016; Huesca-Pérez et al.2017).
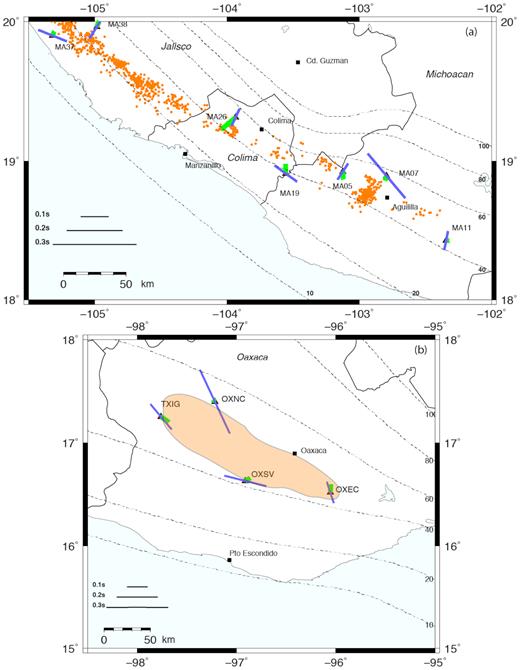
Crustal anisotropy measurements obtained in this study. (a) The western end of the MSZ. (b) Oaxaca state. These two regions are enclosed into the blue boxes in Fig. 1. Orange dots show the location of TT activity reported by Ide et al. (2012). The orange patch shows the area of TT activity in Oaxaca (Brudzinski et al.2010). The solid blue bars represent the direction of propagation of the fast wave centred at a station (red triangles). The lengths of the bars are proportional to the magnitude of the splitting times as shown by the legend. Green solid bars represent the length of the area from which TT signals are coming and are proportional to the mean of the ray-angle oriented respect to the mean of the backazimuth. Dashed lines indicate the top of the Rivera and Cocos plates (Pardo & Suárez 1995).
4 DISCUSSION
As stated earlier, three possible mechanisms are usually adequate to explain anisotropy of the continental crust. These are (1) mineral lattice alignment associated with highly foliated structures, and (2) shearing in regions of active faulting reflected in mylonitic rocks. In active faulting, there are a couple of situations that can create the anisotropy. One is that the fault zone is filled with shear fabric that possesses anisotropic materials, the second is that the fracture fields near the fault zone planes are either aligned with the fault zone or the fault zone stress regime, and (3) extensive dilatancy anisotropy, where the regional stress field induces the alignment of the fast polarization direction with the maximum horizontal compressive stress. In the following discussion, these mechanisms will be evaluated to determine the cause of crustal anisotropy in the MSZ.
4.1 Jalisco–Colima–Michoacán anisotropic province
Clear evidence of shear wave splitting is observed in TT signals recorded by stations at the western end of the MSZ. The averaged splitting times per station in Jalisco, Colima and Michoacán vary between 0.07 and 0.21 s and are slightly lower than those observed in Oaxaca. Fast polarization directions in western Mexico can be broadly divided into two groups (Fig. 5a). Stations MA05, MA11, MA26 and MA38 show fast directions parallel to the convergence direction of the oceanic Cocos and Rivera plates relative to the continental North American plate. The fast polarization directions at stations in the second group (MA07, MA19 and MA37) are trench-parallel.
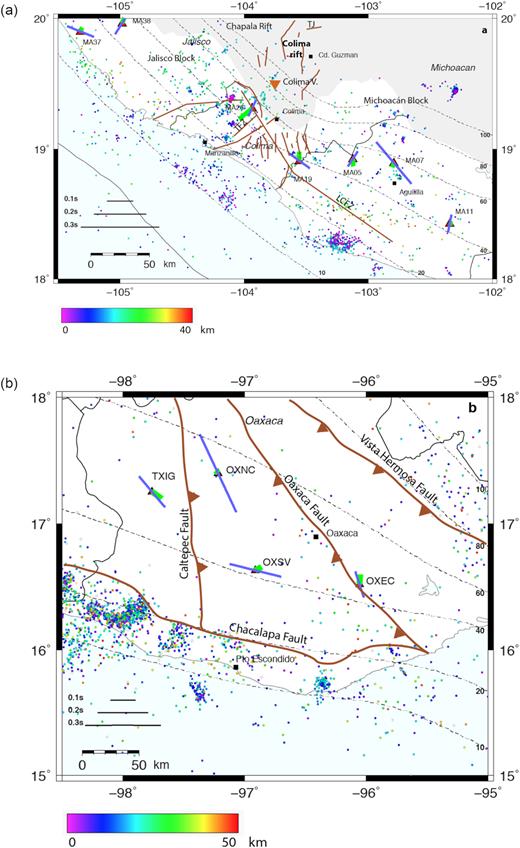
(a) Seismicity and mapped faults in the Jalisco–Colima–Michoacán region. Blue bold lines are fast wave directions centred at the stations (red triangles). Brown solid sinuous lines are active faults reported by Gutierrez et al. (2015) and are oriented mostly north–south defining the Colima rift. Named fault zones are taken from Pacheco et al. (2003), and they are Tamazula Fault Zone (TFZ) and La Cumbre Fault Zone (LCFZ). Coloured dots show seismic activity in the area reported by Gutierrez et al. (2015); the hypocentres are colour-coded by depth. Dashed lines are slab's iso-depth contours in kilometres taken from Pardo & Suarez (1995). (b) Seismicity and faults in Oaxaca. Blue bold lines are fast wave directions centred at the stations (red triangles). Brown, solid sinuous lines are inactive faults reported by Hernandez-Santana et al. (2009). Coloured dots show seismic activity in the area reported by SSN for the year 2016; hypocentres are colour-coded by depth. Dashed lines are slab's iso-depth contours taken from Pardo & Suárez (1995).
In this region, the anisotropy is controlled principally by stress field but also in some areas by geological structures. Valencia et al. (2013) report that the Jalisco block is composed mainly of granitoids, schist, marine sedimentary rocks and silicic ash flow tuffs. They classify the Jalisco block outcrop granitoids as: (1) Hornblend-bearing granitoid; (2) Biotite-bearing granitoid and (3) a weathered coarse-grained granitoid.
The orientation of the fast polarization directions shows variations over relatively small distances. For instance, stations MA19 and MA26 are both located in the Colima rift. The fast axis at MA26 is trench-perpendicular, whereas the fast axis at MA19 is oriented trench-parallel (Fig. 5a). Station MA26 is located at the intersection of three different fault systems (Fig. 5a). (1) The general trend for faults in the northern and central Colima grabens is north–south (Pacheco et al.2003). (2) The southern Colima rift, however, trends northeast–southwest, and is oriented subparallel to the seismically active Tamazula Fault Zone (TFZ, Garduño-Monroy et al.1998; Pacheco et al.2003). Garduño-Monroy et al. (1998) proposed that the TFZ defines the boundary between the southern Colima rift and the Jalisco block to the west. (3) Finally, the transition from the central Colima graben to the southern Colima rift is marked by the La Cumbre Fault Zone (LCFZ), which is a northwest–0southeast trending compressional feature overprinted by right-lateral transpressive faults (Pacheco et al.2003). No other geological, nor seismological, information is available concerning these faults. The 3-D orientation of the faults as well as the dominant sense of shear are not known. The fast axis measured at MA26 is approximately parallel to the trend of the TFZ (Fig. 5a) and tremor rays are coming mainly from south to north and sample the rocks along the trend of the TFZ fault (rays sample a ∼14 km section of fault on its horizontal projection, see green bar). Shearing along active faults has been proposed to explain fast axes oriented parallel to the fault strike (Balfour et al.2005; Boness & Zoback 2006; Bostock & Christensen 2012). So, since the TFZ is active (Pacheco et al.2003), it is possible that the TFZ local stress field is the principal mechanism controlling the orientation of the fast axis at MA26. Additionally, the maximum horizontal compressive stress determined in this study for the TFZ (Fig. 7, southern blue bar) based on earthquake focal mechanisms from Pacheco et al. (2003) is also roughly parallel with the orientation of the fast axis at MA26. This observation supports the possibility that anisotropy at MA26 is controlled by stress field (Crampin 1994).
On the other hand, station MA19 is located close to both, the N–S faults defining the central Colima rift and the NW–SE LCFZ (Fig. 5a). At MA19 station, the tremor ray paths propagate more vertically but its horizontal projection parallel and sample a section of ∼7 km of LCFZ (green bar). It can be observed that the fast axis at MA19 is oriented subparallel to the trend of the LCFZ. It is unknown, however, whether this fault zone is currently active. If the LCFZ were active, then it could control anisotropy at this station through fracture zone stresses (Balfour et al.2005; Boness & Zoback 2006; Bostock & Christensen 2012). Regional tectonic stress influencing crustal anisotropy at MA19 is considered unlikely because the orientation of the fast axis is oblique to the direction of the maximum horizontal compressive stress at the nearest measurement compiled by the Global Stress Project (Heidbach et al.2008, see Fig. 7). So, it is possible that anisotropy measured at this station is due to anisotropic minerals, like micas and quartz, that are reported to be located within the fault system (Valencia et al.2013) but a conclusive explanation for the anisotropy observed at MA19 needs more knowledge of the geological structure at this station.
The other stations where anisotropy was measured throughout this region were deployed away from the Colima rift. The location of active faults is poorly known outside of the rift. Crustal seismicity in the ML magnitude range between 2.0 and 5.3 has been recorded in the Jalisco block down to depths of 25 km, whereas in the Michoacán block the seismicity extends down to 40 km (Gutierrez et al.2015; colour-coded circles, Fig. 5a). Focal mechanisms are available only for a handful of these events (Yela-Portilla & Gómez-Gonzalez 2017). Unfortunately, the available studies cannot provide any constraints on the orientation of active faults and the relationship that they may have to the crustal anisotropy reported in the present work.
Four stations (MA05, MA11, MA26 and MA38) at the western end of the MSZ show fast axis directions roughly parallel to the maximum horizontal compressive stresses observed throughout the region (Heidbach et al.2008, Fig. 7). We thus propose that, regionally, the stress field is the most likely factor controlling anisotropy (Crampin 1994). Soto et al. (2009) measured anisotropy using data from the MARS array. Throughout the region, they found a heterogeneous anisotropy pattern showing variations in the orientation of the fast axes (their Fig. 4). This feature is broadly consistent with the results of this study. Specifically, for the southern Jalisco block fast polarization directions determined by Soto et al. (2009) align with various faults, so they concluded that this anisotropy is caused by stress-aligned fluid-filled microcracks in the uppermost crust (Soto et al.2009). For the other two stations (MA07 and MA37) where measurements were possible, the fast axes are roughly parallel to the coastline (Fig. 5a). For these two stations, the polarization ellipsoid indicates that tremor happens under both stations showing tremor ray paths travelling almost vertically from source to station (Fig. 5a, short green bar at both stations). For station MA37, Valencia et al. (2013) report schist formations suggesting that the anisotropy could be controlled by foliations. For a vertical ray path propagating perpendicular to the foliations is needed 3 km of mica schist rock column to produce 0.11 s of S-wave splitting (Christensen 1996). Station MA07 is located in the western part of the Guerrero terrane in the Michoacán block. This part of the Guerrero terrane has not been investigated enough and very little is known about its age or the composition of its lithology (Valencia et al.2013). Since fast direction is almost perpendicular to the regional maximum horizontal compressive stress we discard that the regional stress field could control anisotropy at this station. In Fig. 5(a), crustal seismic activity can be observed near station MA07. This could suggest that unmapped faults and/or geological structure may exist and could control fast direction.
4.2 Oaxaca anisotropic province
In this region, anisotropy is controlled by geological structure. Brudzinski et al. (2010) found that the epicentral distribution of TT in Oaxaca follows the 40 km depth contour of the interface between the continental North American plate and the oceanic Cocos plate (Fig. 4b). TT is distributed in a band ∼75 km wide and ∼125 km long (Brudzinski et al.2010). Quantifying the polarization of tremor signals at four stations was possible. Results show that splitting times vary between 0.11 and 0.34 s. Fast polarization directions in Oaxaca are predominantly oriented NNW–SSE, although one station (OXSV) shows a nearly E–W fast polarization direction (Fig. 5b). It will be shown that shear wave splitting fast directions are generally parallel to the strike of major geological faults or to the foliations of various geological structures (Fig. 6). Seismicity in the area occurs mostly as interplate events between the continental North American plate and the oceanic Cocos plate (Rodríguez-Pérez 2007; Jensen et al.2008; Chávez-Hernández 2014), and also as intraslab events within the Cocos plate (Pardo & Suarez 1995; Rodríguez-Pérez 2007; Jensen et al.2008; Chávez-Hernández 2014). Fig. 5(b) shows earthquakes reported of the SSN catalogue for the year 2016 (hypocentral depths are colour-coded). Unfortunately, although some evidence is available for crustal seismicity (Chávez-Hernández 2014), there is currently not enough information to establish the relationship between active faulting and anisotropy. As discussed below, however, the existence of foliations and lineations can explain the observed anisotropy.
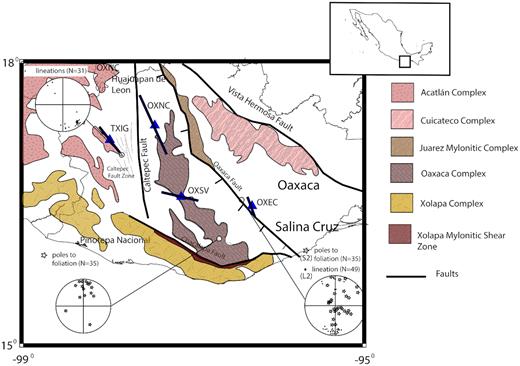
Geological map showing the relation between fast polarization direction (black bars) and geological structures. Stereograms present the poles to foliations of the important mylonitic complexes (stars). Geological information on the map is based on the work of Alaniz-Alvarez et al. (1996), Tolson (2007) and Elias-Herrera et al. (2007).
The Juarez Mylonitic Complex (JMC) is a low angle, west-dipping, NNW-trending, elongated structure extending 160 km with a width of 8–15 km (Ortega-Gutierrez et al.1990, Fig. 6). The Oaxaca fault is located on the west flank of the JMC and is related to the Jurassic opening of the Gulf of Mexico (Alaniz-Alvarez et al.1996, Fig. 6). The JMC was developed in three stages (Alaniz-Alvarez et al.1996). The first stage was related to a major thrusting event which developed S1 foliations; the second one was a transtensional system generating S2 foliation; and the last one was an extensional event resulting from the uplift of the mylonitic belt and its associated, semibrittle foliation. On a broad scale, the most notorious structures are the S2 foliations and their L2 lineations (Fig. 6). Station OXEC is located close to the Oaxaca fault, where S2 and L2 are the pervasive structures (Fig. 6). S2 and L2 are shown in a stereogram (Fig. 6). The poles to foliation S2 are subparallel to the L2 lineations, but, in general, the poles are more scattered than the lineations and have an N–S trend. This trend broadly correlates with the fast polarization direction of the S waves (Fig. 6). Orthogneiss quartz-feldspar, charnockite (silicates), metagabbro and marble (Sedlock et al.1993; Ortega-Gutierrez et al.1994) can be found throughout the area (Dávalos-Álvarez 2006). These are low-grade metamorphic rocks (Christensen 1996) that can induce 5 per cent anisotropy. Tremor ray paths almost parallel the trend of the Oaxaca fault. The ray paths come from north–northwest (Fig. 5b, green bar,) and sample a segment of ∼12 km of the trace of the fault. Therefore, it is hereby proposed that anisotropy at OXEC is controlled by mineral structure.
Fig. 6 shows the Caltepec fault, which is the tectonic contact between the Acatlán and Oaxaca Complexes (Elias-Herrera et al.2007). Station TXIG is located adjacent to the Acatlán Complex and close to the Caltepec fault (Fig. 6). The region between the Caltepec fault and station TXIG is called the Caltepec fault system (Elias-Herrera et al.2007). It is a subvertical, dextral, N–S trending structure with foliations towards the NE (Elias-Herrera et al.2007). This fault system includes about 200–300 m of foliated mylonite, and a 50–800 m thick wedge of a conglomerate with boulders of schist. The Caltepec Fault Zone is recognized as a significant mesocrustal transpressive structure (Elias-Herrera et al.2007). As shown in the stereogram in Fig. 6, the lineation direction trends NW–SE, and it consists of mica schist, amphibolite, quartzo-feldspathic schist, greenschist, quartzite and some lenses of marble. The fast polarization direction at TXIG is also oriented NW-SE. Tremor ray paths that arrive to the station TXIG (Fig. 5b, green bar) come from the southeast and reach the station with an incidence angle with no more than 20° and it is needed a ∼7 km of rock column. The ray paths come from no more than 10 km away from the station. Since station TXIG is located within the Caltepec Fault Zone the ray paths sample the foliations located within the fault system that is oriented NW–SE. It is thus proposed that anisotropy at this station is controlled by foliation.
Station OXSV is in the middle of the Oaxaca complex (Fig. 6) and there are no important faults close to the site. The Oaxaca Complex, however, is bounded by the Oaxaca, Chacalapa and Caltepec faults. As shown in Fig. 6, the projection to poles of the Oaxaca Complex trends to the north. Tremor ray paths come mainly from the NE with a rayangle being almost vertical. The fast polarization direction at OXSV, however, is oriented WNW–ESE, thus ruling out foliation as the cause of anisotropy. No stress measurements are available at this station. The nearest measurements were made to the south (Fig. 7), but in this case the maximum horizontal compressive stress is roughly perpendicular to the fast polarization direction. Therefore, it seems unlikely that anisotropy at this station is induced by the stress field. As previously explained, focal mechanisms of crustal earthquakes are not available, making impossible to evaluate the effect of active seismic faulting on anisotropy. Based on the current information, it is not possible to determine conclusively the cause of anisotropy at OXSV.

Regional map of southern Mexico showing fast wave directions obtained with TT signals along the Mexican subduction zone (solid pink bars). Black bars represent the maximum horizontal compressive stresses reported by Heidbach et al. (2008), and by Huesca-Pérez et al. (2016). The two green bars in the map are the maximum horizontal compressive stresses obtained by inversion in this study using the method of Michael (1987) and focal mechanisms from Pacheco et al. (1999, 2003). Dashed lines represent iso-depths to the subducted Rivera and Cocos plates (Pardo & Suárez 1995).
Unlike the three preceding stations, OXNC is located at the boundary of the metamorphic complexes (Fig. 6). At the same time, the station is close to the Caltepec fault that is located to the west. Poles to foliations in the Oaxaca complex have a general NS trend as the trend of the Caltepec fault. On the other hand, OXNC station is also close to the Oaxaca fault located to the east with its northern segment trending N–NW. Tremor ray paths arriving at this station come from deeper crustal layers arriving to the seismic sensor almost vertically. So, we think that mineral structure of anisotropic materials as foliations within greenshist located near the station can explain the 0.35 s of splitting observed at this station with a rock column of ∼9 km (Bostock & Christensen 2012). Maximum compressive stress measurements in Oaxaca are all located well south of OXNC (Fig. 7) and are oblique to the azimuth of the fast wave, so we do not think the regional stress field plays a major roll. We think that mineral structure is the principal cause of anisotropy measured at this station.
4.3 Overview of crustal anisotropy at the Mexican subduction zone
In addition to the regions studied herein, Huesca-Pérez et al. (2016) quantified crustal anisotropy in Guerrero state. TT occurs between Chilpancingo and Iguala (Fig. 7). This region corresponds with the Mixteca Terrane, which is made up of a metamorphic basement with an embedded ultramafic body (Campa & Coney 1983). Huesca-Pérez et al. (2016) found fast polarization directions broadly aligned NE–SW (Fig. 7). Splitting times vary between 0.07 and 0.36 s, and their magnitudes are similar to those observed in Oaxaca, and Jalisco–Michoacán in this study. Huesca-Pérez et al. (2016) further observed that the fast polarization directions are oblique to the maximum horizontal compressive stresses surrounding the tremor Sweet Spot (Fig. 7). They concluded that it is not possible to establish a relationship between the maximum compressive stress and the fast polarization directions. On the other hand, since seismic activity has not been recorded in the continental crust within the tremor area (Pacheco & Singh 2010), fast polarizations cannot be explained by local fault stress. Geological analysis of the Mixteco terrane, however, shows that Tertiary folds and reverse faults (Cerca et al.2004) were formed in a shortening episode during the formation of the North America–Caribbean plate boundary. Huesca-Pérez et al. (2016) noted that fast polarization directions tend to align approximately parallel to these folds-and-thrusts. The system strikes NNE–SSW and it is highly foliated in low-grade schist. Therefore, Huesca-Pérez et al. (2016) proposed that foliations explain the orientation of the fast polarization directions observed in this area.
We can summarize the anisotropy observations at the three regions along the MSZ as follows. (1) In the Jalisco–Michoacán province, fast axes are oriented either margin-normal or margin-parallel. Regionally, the stress field seems to control most of the fast direction measurements; this is our case for stations with margin-normal fast directions which are parallel to the maximum horizontal compressive stresses. On the other hand, the anisotropy in this region is also controlled by mineral or geological structures. For example, stations located within the Colima rift (MA26 and MA19) seem to be controlled by fault systems. It can be observed that the trend of the Tamazula fault parallel the fast polarization direction at MA26. As the TFZ is observed to be active (Gutierrez et al.2015), we think that the local stress field within the fault is the responsible for the orientation of the fast direction. Also, the fast direction determined at MA19 parallels the trend of a fault system: LCFZ. However, this system is not known if is active but the area possesses anisotropic minerals like micas and quartz that are highly anisotropic. Fast direction measured at MA07 (margin parallel) is perpendicular to the regional stress field, but it is reported crustal seismic activity that suggest that unmapped geological structures or faults could be controlling the anisotropy. (2) In Guerrero state, the maximum horizontal compressive stresses are oblique or normal to the fast directions, and consequently, the stress field cannot explain the anisotropic structure (Huesca-Pérez et al.2016). We also analysed geological structures in Guerrero such as Tertiary faults and foliations which tend to parallel fast polarization directions. These palaeofaults (e.g. Teloloapan fault) and foliations are abundant in greenschist facies which is highly anisotropic, low-grade metamorphic rocks and may thus cause the observed anisotropy. (3) In the Oaxaca province, fast directions tend to be oblique to the maximum horizontal compressive stresses reported in the Global Stress Project (Heidbach et al.2008). Therefore, the stress field is ruled out as the cause of anisotropy. The fast axes, however, tend to parallel inactive faults of the Oaxaca complex, which is made up of a crystalline basement. This basement is made up of different metamorphic rocks, such as quartz-feldspar orthogneiss, charnockite, metasediments (calc-silicates), metagabbro and marble (Dávalos-Álvarez 2006), which are medium grade anisotropic metamorphic rocks and may thus explain the observed anisotropy (Christensen 1996).
5 CONCLUSIONS
The continental crust anisotropic structure determined using TT along the MSZ shows average splitting times between 0.07 and 0.34 s, which are typical values for the continental crust worldwide. Average fast polarization directions are variable along the Mexican subduction margin. The orientation of the fast directions in the Rivera–North America subduction zone is variable, but some of them are margin-normal and tend to parallel the maximum horizontal compressive stresses, suggesting that regionally the stress field controls crustal anisotropy. The rest of the fast axes, however, are margin-parallel and may be controlled by structure or active faulting in the continental crust on a local level. Fast polarization directions in Oaxaca state, along the Cocos–North America subduction margin, tend to parallel Tertiary inactive faults, suggesting that anisotropy is controlled by geological structures and palaeo-shear structures such as the JMC. Guerrero state shows fast polarization directions oblique to the maximum horizontal compressive stresses, thus ruling out the stress field as the cause of anisotropy. The seismic anisotropy structure in Guerrero is likely controlled by anisotropic geological structures (Huesca–Pérez et al.2016). Throughout the MSZ, the crustal anisotropic signature is a complex system that will be better determined as new data becomes available.
ACKNOWLEDGEMENTS
All seismic tremor data from the MARS array in Jalisco, Colima and Michoacán can be freely downloaded from the IRIS DMC data repository under network code XF (Grand & Ni 2006). Oaxaca data were provided by SSN (2007), and OxNet data by Instituto de Geofísica, UNAM. We are grateful to the SSN staff for station maintenance, and for data acquisition and distribution. We want to thank Unidad La Paz—Cicese for their financial support (internal project 691115) and Conacyt (project 97). Some figures were made using the Generic Mapping Tools (GMT) package (Wessel & Smith 1998).
