


SUMMARY
Oceanic plates play an important role in transporting water from Earth’s surface into the mantle. The trench–outer rise region is one of the places where hydration of the oceanic plate occurs. We investigated oceanic plate hydration in the trench–outer rise region of the Japan Trench on the basis of the seismic velocity structure as estimated by a tomographic analysis of data from ocean bottom seismograph arrays. This analysis demonstrates a reduction in P-wave and S-wave velocity (Vp and Vs) within the uppermost oceanic mantle of the incoming Pacific plate in the direction towards the trench axis. This seismic velocity reduction, which was observed in at least the uppermost 15 km of the mantle, is consistent with hydration of the uppermost mantle due to infiltration of water through the oceanic crust along bending-related normal faults. Under the assumption that the velocity reduction is caused solely by serpentinization of the mantle, the Vp changes suggest that water content increases by about 1.1 to 2.9 wt per cent at depths as great as 15 km below the oceanic Moho. An increase in water-filled fractures can also account for this velocity reduction with a smaller amount of water. Aside from the general trend of velocity reduction towards the trench axis, the Vp structure of the incoming plate shows spatial heterogeneity related to mantle seismicity, in that earthquakes within the uppermost mantle generally coincide with areas of low Vp. This spatial seismic heterogeneity is consistent with localized hydration or formation of water-filled fractures along bending-related normal faults. Hence, a low-Vp anomaly within the uppermost oceanic mantle could be an indicator of possible sites of large outer-rise normal-faulting earthquakes in which the rupture extends into the mantle.
1 INTRODUCTION
Subducting oceanic plates transport water from the Earth’s surface into the mantle. Water delivered to the mantle by subduction and released by dehydration affects various geological and geophysical phenomena, such as arc magmatism (e.g. Iwamori 2007; Kimura & Nakajima 2014) and intraslab earthquakes (e.g. Kirby et al.1996; Hacker et al.2003). Hydration of oceanic plates occurs under various tectonic settings from their genesis at mid-ocean ridges to their subduction at oceanic trenches (e.g. Faccenda 2014). The trench–outer rise region is the final place where oceanic plate hydration occurs before subduction. Therefore, the amount and distribution of water in the oceanic plate in the trench–outer rise region is important information for understanding water transportation by oceanic plates and its effect on geological and geophysical phenomena in subduction zones.
In the trench–outer rise region, the incoming oceanic plate bends before being subducted at the trench, and earthquake focal mechanisms suggest that the stress regime in the plate is characterized by shallow extension and deep compression (e.g. Chen & Forsyth 1978; Seno & Gonzalez 1987). The shallow extensional stress regime explains bending-related normal faults that are widely observed in subduction zones, such as the Middle America Trench (e.g. Ranero et al.2003) and Japan Trench (Tsuru et al.2000). These normal faults may offer water a pathway from the seafloor into the oceanic mantle and enable oceanic plate hydration to extend to mantle depths (e.g. Peacock 2001; Ranero et al.2003; Ranero & Sallarès 2004; Key et al.2012).
Oceanic plate hydration has been investigated from the seismic velocity structure of the oceanic crust and uppermost mantle in the trench–outer rise region. Active-source seismic studies have documented reductions in seismic velocity of the oceanic crust and uppermost mantle with increasing proximity to the trench axis in the trench–outer rise region along the Middle America Trench (Ivandic et al.2008), Kuril Trench (Fujie et al.2013) and Japan Trench (Fujie et al.2018). Although seismic velocity reductions can be explained by physical opening of fractures in the oceanic plate or by chemical hydration of the oceanic plate, it is difficult to distinguish between these two mechanisms. Ivandic et al. (2008) used the hydration hypothesis to explain a reduction in P-wave velocity (Vp) in the crust and uppermost mantle along the Middle America Trench off the coast of Nicaragua by an increase in the water content of the uppermost mantle to 1.55–2.17 wt per cent, which corresponds to a 12–17 per cent increase in serpentine content according to the model of Carlson & Miller (2003).
The vertical extent of oceanic plate hydration is important information for calculating the amount of water transported into the mantle. Previous studies of the relationship between seismic activity and serpentine dehydration in the subducting slab (Peacock 2001) and of dispersive P-wave arrivals and high-frequency P-wave codas of earthquakes within the subducting slab (Garth & Rietbrock 2014) have proposed that hydration may extend several tens of kilometres into the mantle. However, the spatial resolution of active-source seismic studies is usually limited to depths a few kilometres below the oceanic Moho (Moho hereafter; e.g. Contreras-Reyes et al.2008; Ivandic et al.2008; Fujie et al.2013). A combined analysis of active and passive seismic data from offshore Nicaragua led Lefeldt et al. (2012) to conclude that the bottom of the anomalously low Vp mantle, about 10 km below the Moho, coincides with the stress neutral plane, as suggested by the change of focal mechanisms from shallow normal-faulting to deep reverse-faulting. Emry & Wiens (2015), investigating mantle serpentinization in the incoming plate in the Northwest Pacific from hypocentre depths of extensional intraplate earthquakes in the trench–outer rise region, proposed that hydration could extend 15 km below the Moho. Their estimated delivery of water into the mantle was generally greater than previous estimates, such as that of van Keken et al. (2011); however, focal mechanisms of intraplate earthquakes are indirect evidence of the depth of hydration.
The spatial distribution of the hydration water, whether uniform or heterogeneous, is another important factor. Wada et al. (2012) reported that an oceanic plate with localized hydration could release almost twice as much water as a uniformly hydrated slab. Normal faults in the trench–outer rise region would be a likely source of localized hydration (Faccenda et al.2009). Localized hydration may also affect seismicity within the subducting slab. Nakajima et al. (2011) showed that the source area of an M 7.1 intraslab earthquake at a depth of 66 km within the subducting Pacific plate coincided with an area of low velocity and proposed that intraslab earthquakes may represent reactivation of locally hydrated faults of plate-bending origin that extend into the mantle. This raises the possibility that source areas of large outer-rise normal-faulting earthquakes, such as the 1933 Showa-Sanriku earthquake (Mw 8.4) in the northern Japan Trench (e.g. Kanamori 1971), can be imaged as localized low-velocity zones in the oceanic mantle.
After the 2011 Mw 9.0 Tohoku-oki earthquake, intraplate normal-faulting earthquakes, including several M 7-class events, occurred in the trench–outer rise region seawards of the 2011 coseismic rupture area (e.g. Asano et al.2011; Fig. 1). Ocean bottom seismograph (OBS) observations from this area show that intraplate earthquakes occurred as deep as 40–50 km with predominantly normal-faulting focal mechanisms (Obana et al.2012, 2013, 2014). These data make it possible to model the seismic velocity structure of the incoming Pacific plate near the Japan Trench through seismic tomography. In this study, we modelled the seismic velocity structure of the trench–outer rise region in the central part of the Japan Trench and investigated mantle hydration and its relationship to outer-rise earthquakes.
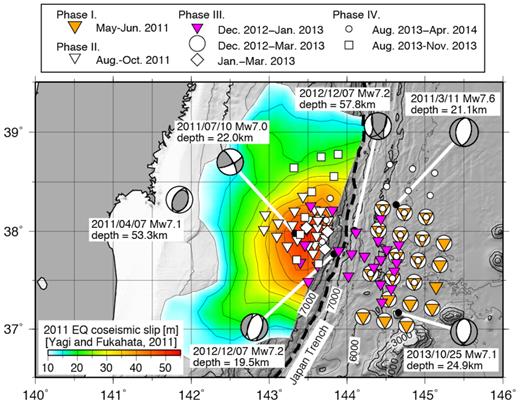
Map showing locations of OBSs used in this study, slip distribution of the 2011 Tohoku-oki earthquake (Yagi & Fukahata 2011; contour interval 5 m) and focal mechanisms of M 7-class earthquakes between the 2011 March Tohoku-oki earthquake and 2017 December from the Global CMT Project (Dziewonski et al.1981; Ekström et al.2012). Bathymetric contours in metres.
2 OBSERVATIONS AND DATA
We have conducted repeated OBS observations in the trench–outer rise region near the Japan Trench since the 2011 Tohoku-oki earthquake (Fig. 1). The first phase of these observations took place seawards of the trench axis from 2011 May to June, and the second phase was conducted landwards of the trench axis from 2011 August to October. During the third phase, from 2012 December to 2013 March, we deployed OBSs both landwards and seawards of the trench axis including the trench axis area, where the water depth reaches about 7200 m. During the fourth phase, from 2013 June to 2014 April, most of the OBSs were deployed seawards of the trench axis and several were deployed on the landward side. We successfully retrieved data from 120 stations in total. The separation between OBSs ranged from about 10 to 25 km. Hypocentre distributions and focal mechanisms during phases 1, 2 and part of phase 3 have been reported previously (Obana et al.2012, 2013, 2014). In this study, we used arrival-time data from all four phases to model the seismic velocity structure.
Most of the OBSs were equipped with a three-component 4.5 Hz short-period seismograph and a hydrophone; exceptions included three OBSs with broad-band (0.02–360 s) sensors and one OBS with a 1 Hz short-period sensor deployed landwards of the trench axis during phase 2 (Obana et al.2013). The OBS internal clocks were corrected for drift during the observations by linear interpolation of time differences from a GPS-based reference clock, as measured just before and soon after the deployments. Although four OBSs with broad-band sensors were deployed in phase 2, as reported by Obana et al. (2013), this study did not use the data from one OBS with an uncorrected clock. Signals were recorded continuously at a sampling frequency of 100, 128 or 200 Hz with a 16-bit or 24-bit analogue-to-digital converter.
Seismic events were detected in the OBS records on the basis of short-term and long-term amplitude ratios. Arrival times of P and Swaves were then picked manually. When the data were of sufficient quality, we also picked the polarity of the P-wave first motions and the maximum amplitude of the vertical seismograms. For phases 1 and 2, we used the picks reported in previous studies (Obana et al.2012, 2013). Phase arrival data for phases 3 and 4 were picked in this study. The four phases of observations yielded a total of about 16 000 events.
3 ANALYSIS
We estimated 3-D seismic velocity structures as well as hypocentre distributions and focal mechanisms on the basis of the OBS data. In a preliminary analysis, we estimated hypocentre locations based on 1-D velocity models by using the code hypomh (Hirata & Matsu’ura 1987), using separate 1-D Vp models for OBS locations landwards and seawards of the trench axis (Fig. 2). These velocity models were constructed with reference to previous studies in this area (Ito et al.2005; Hino et al.2009). We assumed a Vp of 3.5 km s−1 in the shallowest crustal layer, and we assumed a fixed Vp/Vs of 1.78 at all OBS locations.

Event distribution estimated by using 1-D velocity models. (a) Map showing hypocentre locations. Only events indicated by the coloured circles were used in the tomographic analysis; the symbol colour indicates depth. The thick dashed line indicates the trench axis. The open and solid inverted triangles indicate OBSs seawards and landwards of the trench axis, respectively. (b) Cross-section along the trench-normal profile in (a) showing events within the dotted rectangle in (a). The open and solid inverted triangles indicate OBS locations projected onto the profile (plotted at the top of the panel regardless of water depth). (c) 1-D velocity profiles used for the OBSs seawards (S) and landwards (L) of the trench axis.
The observed arrival times of P and Swaves were corrected by using estimated time delays due to the low-velocity sedimentary layer beneath the OBSs. These corrections were calculated from the difference between the arrival times of the P phase and the P-to-S converted phase (Swaves converted from Pwaves at the base of the sedimentary layer) on the basis of assumed values of Vp and Vp/Vs in the sediment (e.g. Iwasaki et al.1991). Vp in the sediment was assumed to be 2.0 km s−1 for all OBSs, and Vp/Vs was assumed to be 8.0 and 4.4 for OBSs seawards and landwards of the trench axis, respectively, based on previous studies (Obana et al.2012; Nakamura et al.2014). Estimated time delays were 0.15–0.29 s for Parrivals and 1.20–2.29 s for Sarrivals.
After determining the hypocentre locations, we selected the events for tomographic analysis. Selection was based on two criteria: both P and Sarrivals were picked manually from at least 10 stations, and the maximum gap in azimuthal coverage of the stations was less than 180° (i.e. the events were within the OBS network) or the nearest station with arrival-time data was within 25 km of the epicentre. In total, 8303 events, shown as coloured circles in Fig. 2, were selected for use in the tomographic analysis. The OBS distributions and the selected events are shown for each of the four observation phases in Fig. 3.
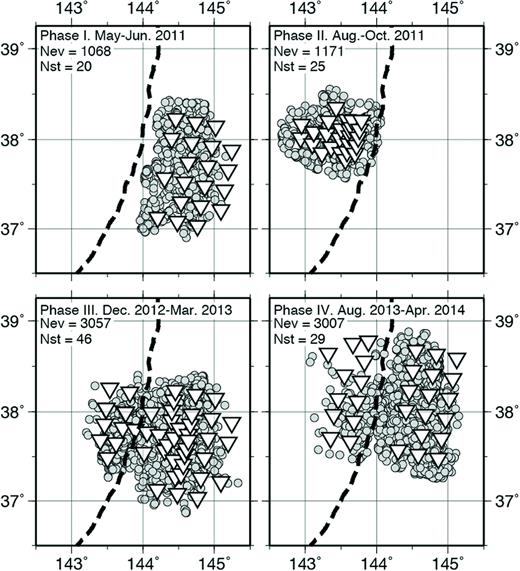
Event and OBS distributions in each observation period. The inverted triangles indicate OBS locations and grey circles indicate events in each observation period. Events correspond to the events shown in colour in Fig. 2. Numbers of events (Nev) and OBSs (Nst) are indicated in each panel.
We conducted the 3-D tomographic analysis by using the double-difference tomography method (Zhang & Thurber 2003), which uses both absolute and differential arrival-time data to estimate the seismic velocity structure and hypocentre locations simultaneously. Total numbers of absolute arrival times of P and Swaves were 165 510 and 183 997, respectively, and differential arrival times for P and Swaves were 496 798 and 496 845, respectively. We applied the same station corrections for arrival-time delays that we used in the initial hypocentre determinations.
The velocity model for the tomographic analysis was defined by grid nodes distributed in a 3-D model space. The grid intervals were 12.5 km in the horizontal and 2 to 25 km in the vertical directions (Fig. 4). The horizontal axes of the model were oriented approximately normal (axis X) and parallel (axis Y) to the trench axis, respectively. The initial velocity model (model A) was constructed by expanding the 2-D Vp model from a previous seismic survey study in this area (Ito et al.2005), which was parallel to axis X. Where the model space of our tomographic analysis extended eastwards beyond the 2-D model of Ito et al. (2005), we used the velocities from the eastern end of the 2-D model. As with the preliminary hypocentre determinations, we assumed a minimum Vp of 3.5 km s−1 and a uniform Vp/Vs of 1.78 in the initial model.
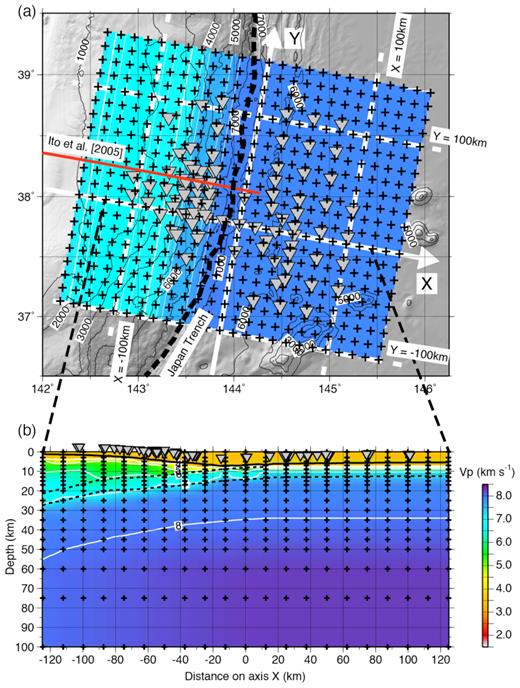
Model configuration and initial velocity model (model A) of the tomographic analysis. The crosses indicate grid nodes of the velocity model. (a) Map showing the initial P-wave velocity model at a depth of 25 km. The red line is the survey line of Ito et al. (2005) used as a reference for the initial velocity model. The inverted triangles are OBS locations. The thick black dashed line indicates the Japan Trench axis. Bathymetric contours in metres. Axes X and Y are normal to and parallel to the trench axis, respectively. The white dashed lines are 100 km from axis X or Y. (b) Cross-section of the initial P-wave velocity model along axis X. The dashed black lines indicate the top of the oceanic crust (Ito et al.2005) and the Moho, which is 7 km below the seafloor seawards of the trench and 6 km below the top of the oceanic crust landwards of the trench. The inverted triangles indicate projected locations of OBSs. The white contours mark whole-number values of Vp.
We tested two other initial models (models B and C in Supporting Information Fig. S1) to examine dependence of the tomographic models on initial models. Initial model B (Supporting Information Fig. S1b) was the same as the initial model A (Fig. 4 and Supporting Information Fig. S1a) except for Vp in the oceanic mantle. Vp in the oceanic mantle of the initial model B was assumed to be 8.2 km s−1, which was higher than the initial model A. The other initial model C (Supporting Information Fig. S1c) was based on the 1-D velocity model used in the preliminary hypocentre location analysis for the OBSs seawards of the trench axis (Fig. 2c). A uniform Vp/Vs of 1.78 was assumed in both initial models B and C as well as the initial model A.
To evaluate the spatial resolution, we conducted a checkerboard resolution test by applying ±5 per cent velocity perturbations to alternate sections of the model measuring 25 km in the horizontal and 6 to 20 km in the vertical direction. The synthetic arrival-time data included random noise with standard deviations of 0.15 s for Parrivals and 0.30 s for Sarrivals. These values were based on the RMS residuals of the tomographic analysis using the OBS observation data. We also estimated errors of the velocity model and hypocentre locations by using 100 bootstrap samples from absolute arrival time data.
Magnitudes and focal mechanisms were estimated on the basis of relocated hypocentres from the tomographic analysis. Magnitudes were calculated from maximum amplitudes of the vertical seismograms by using the equation for regional earthquakes of Watanabe (1971). Focal mechanisms were estimated from first motion polarities by using the HASH code of Hardebeck & Shearer (2002).
4 RESULTS
The Vp and Vs velocity models obtained from the tomographic analysis by using initial model A (Fig. 4 and Supporting Information Fig. S1a) are shown in Fig. 5. The RMS residual was reduced from 0.45 to 0.17 s, which included residuals for both absolute and differential arrivals. RMS residuals for absolute P and Sarrivals were 0.14 and 0.28 s, respectively. Results of the resolution test showed that the checkerboard pattern was recovered well at depths down to 30 or 10–20 km below the Moho (Fig. 6). In some places, the checkerboard pattern was recovered at depths of 40 km. However, the test also showed that recovery at depths shallower than 10 km, corresponding to the oceanic crust and the overriding plate, was poor. Within this well-resolved area, the seismic velocity models obtained by using initial models B and C (Supporting Information Figs S1b and c) were almost identical with the one obtained from initial model A (Supporting Information Figs S2 and S3). Hence, it appears that the dependence of the tomographic models on initial models was not significant. Velocity errors estimated by using the bootstrap samples did not exceed 0.15 km s−1 for Vp and 0.05 km s−1 for Vs within most of the well-resolved area (Supporting Information Fig. S4).
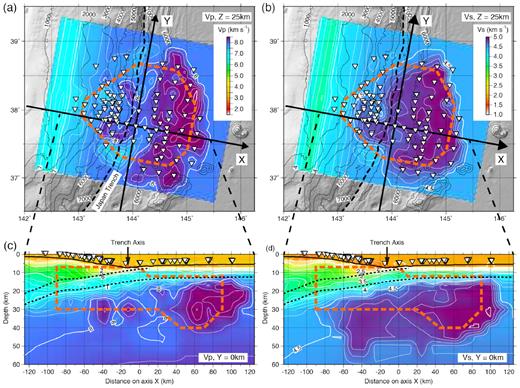
Velocity model from the tomographic analysis. Areas with good checkerboard pattern recovery are enclosed by thick orange dashed lines (same areas as shown by green dashed lines in Fig. 6). (a,b) Maps showing (a) P-wave velocity and (b) S-wave velocity at 25 km depth. The black dashed line indicates the Japan Trench axis. (c,d) Cross-sections of (c) P-wave velocity and (d) S-wave velocity along axis X.
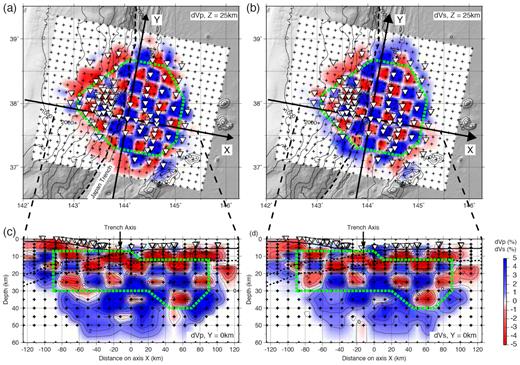
Results of the checkerboard resolution test. Areas with good checkerboard pattern recovery are enclosed by thick green dashed lines. (a,b) Map view of results for (a) Vp and (b) Vs at 25 km depth. The black dashed line indicates the Japan Trench axis. (c,d) Cross-sections of results for (c) Vp and (d) Vs along axis X.
We obtained a total of 8143 relocated hypocentres, for which location errors estimated by double-difference tomography were less than 500 m and location errors estimated by using the bootstrap samples were less than 10 km (Figs 7a,c, and Supporting Information Fig. S5). Location errors estimated from the bootstrap samples were less than 3 km for 80 per cent of the events and less than 5 km for 95 per cent of the events, although the accuracy of the error estimates by the conjugate gradient method LSQR used in the double-difference tomography is not guaranteed (Paige & Saunders 1982). Magnitudes of these events ranged from 0.6 to 5.4. As reported by previous studies (Obana et al.2012, 2013, 2014), most of the events were within the oceanic crust and the uppermost part of the oceanic mantle. Some of the earthquakes were deeper than 40 km (Fig. 7c).
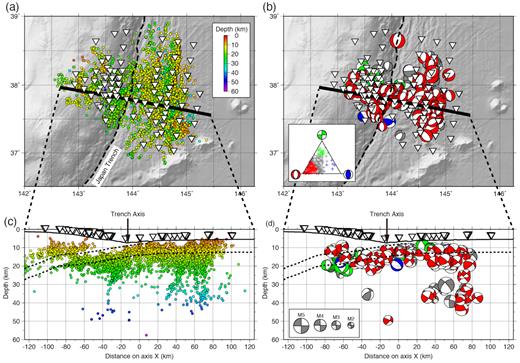
Maps and cross-sections showing hypocentre distribution and focal mechanisms. Symbols are the same as in Fig. 4. (a) Distribution of hypocentres (circles; colour signifies depth) obtained from the tomographic analysis. The thick black line is axis X. (b) Distribution of focal mechanisms (size signifies magnitude) estimated from first-motion polarities, colour coded based on the triangle diagram of Frohlich (1992) as shown in the inset. Red, blue, green and grey symbols indicate normal, reverse, strike-slip and intermediate focal mechanisms, respectively. (c) Cross-section of (a) projected onto axis X. (d) Cross-section of (b) projected onto axis X; note that focal mechanism symbols are lower-hemisphere projections with respect to axis Y.
We obtained 250 focal mechanisms with quality category A or B, as defined by the HASH code (Hardebeck & Shearer 2002), which correspond to uncertainties less than 35° in the fault plane orientation (Figs 7b and d). Most of the focal mechanisms were classified on the triangle diagram of Frohlich (1992) as normal-faulting or intermediate mechanisms close to normal-faulting (Fig. 7b inset). Normal-faulting focal mechanisms predominated to depths of 40–50 km, corresponding to a depth of 30–35 km below the Moho (Fig. 7d), throughout the period of OBS observations except during phase 2 (Fig. 8). The phase 2 observations, from 2011 August to October, were conducted landwards of the trench axis after the Mw 7.0 strike-slip earthquake of 2011 July 10 (location in Fig. 1), thus the strike-slip focal mechanisms during phase 2 represent aftershocks (Obana et al.2013).

5 DISCUSSION
5.1 Seismic velocity changes in the trench–outer rise
In the seismic velocity structure obtained from the OBS data, the seismic velocity in the oceanic mantle of the incoming plate decreases with proximity to the trench axis. Velocity contours seawards of the trench deepen towards the trench axis (e.g. the Vp = 8.0 km s−1 and Vs = 4.5 km s−1 contours in Fig. 5).
This trend of velocity reduction is also evident from the record sections shown in Fig. 9 in which the apparent velocities serve to approximate the average P-wave velocity in the uppermost mantle along lines of both hypocentres and stations parallel to the trench axis. Events were limited to those at depths of 14–20 km corresponding to the uppermost mantle below the Moho. The record section from approximately 35 km seawards of the trench axis shows an apparent velocity of about 8.1 km s−1 (Fig. 9a), and record sections farther from the trench axis show higher apparent velocities (Figs 9b and c).
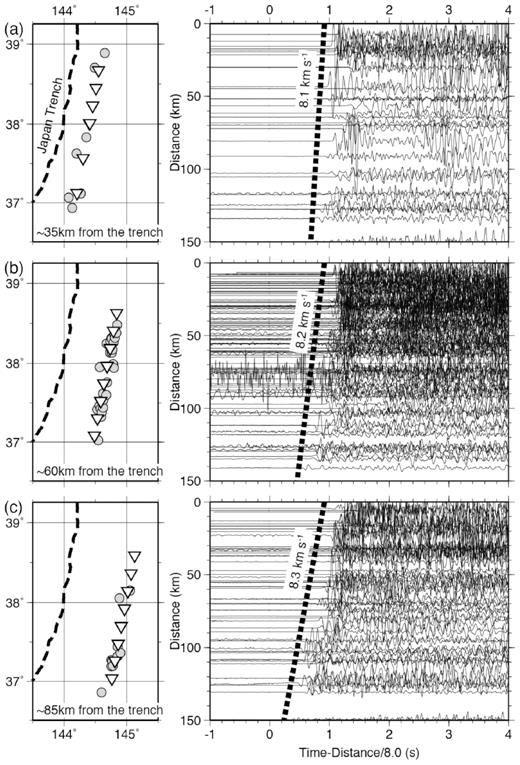
Record sections with distances of around (a) 35 km, (b) 60 km and (c) 85 km from the trench axis (dashed line). Events (open circles) observed at the stations (inverted triangles) shown in the left-hand panels have their vertical seismograms displayed in the right-hand panels. Only events with hypocentre depths of 14–20 km corresponding to the uppermost mantle are plotted. The horizontal axes of the record sections are reduced by a velocity of 8.0 km s−1.
The systematic velocity changes in the mantle with distance seawards of the trench axis can be seen at least as deep as 15 km below the Moho (Fig. 10). The Moho depth was defined on the basis of the structure model of Ito et al. (2005) as 6 km below the top of the subducting oceanic crust or 7 km below the seafloor. In the trench–outer rise region, both Vp and Vs below the Moho decrease with proximity to the trench axis (Figs 10a and b), and the decreases tend to be greater at shallower depths (Figs 10g and h). The three different initial models yielded almost identical seismic velocity changes (Supporting Information Fig. S6). Thus, the dependence of the tomographic models on initial models does not affect the discussion in this study. Considering the velocity model errors estimated from the bootstrap samples (Supporting Information Fig. S4) and the results of the checkerboard resolution test (Fig. 6), we consider the velocity reduction to be reliable.
![(a–c) Map views of (a) Vp, (b) Vs and (c) Vp/Vs at 10 km below the Moho. The solid and broken lines [white in (a, b) and black in (c)] correspond to across-trench profiles shown below. The areas with good checkerboard pattern recovery at a depth of 25 km are enclosed by thick orange dashed lines (same areas as shown by green dashed lines in Figs 6a and b). (d–f) Cross-sections of (d) Vp, (e) Vs and (f) Vp/Vs along the central profile in the map views. Lines [white in (d,e) and black in (f)] indicate depths of 5, 10 and 15 km below the Moho. The areas with good checkerboard pattern recovery are enclosed by thick orange dashed lines (same areas as shown by the green dashed lines in Figs 6c and d). (g–i) Profiles of (g) Vp, (h) Vs and (i) Vp/Vs along all five across-trench profiles shown in maps (a–c) at depths of 5, 10 and 15 km below the Moho (d–f). The double-headed arrows in (g) indicate the profile intervals used to calculate the reference and trench-axis Vp values in Table 1.](https://oup.silverchair-cdn.com/oup/backfile/Content_public/Journal/gji/217/3/10.1093_gji_ggz099/1/m_ggz099fig10.jpeg?Expires=1749982171&Signature=On5sqqyesFz7DaTHbBOseOkOs2GywXa~0T1pn2KZi5bcRcjboukM-zGRXUwrq~-PtFBn8GXGIuwI7DJHbgV11CE9fFqsON2LAqhFdAEntMcvdy813cLPji6x6k-wBfz7tg1FyUtDgPSO69SaC0dbSP-cJUf~Tmvvi7r4Qkl8GkDhDB3Nu0ybflSH-bN5qIL9gjvcAAIfpCVyca2-yboMuzj942agvKMIRvqXoKvVJr0dMDEKmgqAXuWCGVnnmPIf017F9FAeLFJxywzJu5jzqJXQ6gWoQpHKLwkcg0m75XETqny8rwsOABpU4ZLfUqMZL~t9U~iv1yzBPqG-MGhh6A__&Key-Pair-Id=APKAIE5G5CRDK6RD3PGA)
(a–c) Map views of (a) Vp, (b) Vs and (c) Vp/Vs at 10 km below the Moho. The solid and broken lines [white in (a, b) and black in (c)] correspond to across-trench profiles shown below. The areas with good checkerboard pattern recovery at a depth of 25 km are enclosed by thick orange dashed lines (same areas as shown by green dashed lines in Figs 6a and b). (d–f) Cross-sections of (d) Vp, (e) Vs and (f) Vp/Vs along the central profile in the map views. Lines [white in (d,e) and black in (f)] indicate depths of 5, 10 and 15 km below the Moho. The areas with good checkerboard pattern recovery are enclosed by thick orange dashed lines (same areas as shown by the green dashed lines in Figs 6c and d). (g–i) Profiles of (g) Vp, (h) Vs and (i) Vp/Vs along all five across-trench profiles shown in maps (a–c) at depths of 5, 10 and 15 km below the Moho (d–f). The double-headed arrows in (g) indicate the profile intervals used to calculate the reference and trench-axis Vp values in Table 1.
5.2 Seismic velocity change and hydration of the uppermost oceanic mantle
The velocity reduction in the uppermost mantle of the incoming Pacific plate with proximity to the trench axis can be explained by hydration of the uppermost mantle where normal faults allow water to infiltrate through the oceanic crust. As shown in Figs 10(g) and (h), both Vp and Vs are reduced within about 70 km of the trench axis. A seismic reflection survey across the northern Japan Trench at 39° N by Tsuru et al. (2000) showed that the offsets of normal faults forming horst-and-graben structures show a gradual increase within 70 km of the trench axis, although normal-faulting first appears about 110 km seawards of the trench axis. This coincidence suggests that velocity reduction and the development of normal faulting in the trench–outer rise region are closely related. As previous studies have proposed (e.g. Ranero et al.2003; Faccenda et al.2009), infiltration of water through normal faults can cause serpentinization in the uppermost mantle, resulting in reduced seismic velocity. Larger velocity reductions at shallower depths are consistent with this scenario, although the specific mantle hydration mechanisms are still a matter of discussion (Korenaga 2017).
The systematic velocity change that extends down to 15 km below the Moho indicates that mantle hydration could occur at the same depths. This inference is consistent with the estimate of oceanic mantle hydration by Emry & Wiens (2015), which was based on the depth distribution of moderate (Mw 5–7) intraplate extensional earthquakes as estimated from teleseismic data. However, our OBS data show that normal-faulting earthquakes occurred as deep as 30–35 km below the Moho (Fig. 7b). The velocity reduction with proximity to the trench axis can be seen around 20 km below the Moho at distances between 20 and 60 km on axis X (i.e. between 30 and 70 km from the trench axis; Figs 10d and e), where the resolution test partially recovered the checkerboard pattern (Figs 6c and d). Thus it is possible that mantle hydration extends deeper than 15 km below the Moho, although the spatial resolution of our analysis was not sufficient for further discussion.
The water content in the oceanic mantle can be calculated from the P-wave velocity changes by using the equation of Carlson & Miller (2003). We compared mantle Vp beneath the trench axis, defined by the average velocity between −20 and 0 km on axis X, with the reference velocity for unaltered mantle, defined by the average velocity between 60 and 80 km on axis X, seawards of the area with apparent velocity reduction (Fig. 10g). As summarized in Table 1, Vp at 5–15 km below the Moho is about 7.5–8.2 km s−1 beneath the trench axis, a decrease from the reference Vp of about 8.2–8.5 km s−1. A change in water content of 1.1 to 2.9 wt per cent in the uppermost oceanic mantle would account for these Vp changes if they were solely due to mantle serpentinization. This estimate would be an upper bound of the water content in the upper 15 km of the incoming oceanic mantle. The estimated water contents correspond to 10–20 per cent serpentinization of the mantle (Carlson & Miller 2003). Our estimate is consistent with results from other subduction zones; these include 2.5 wt per cent water in the upper 20 km of the oceanic mantle off northern Chile (Ranero & Sallarès 2004), 1.2 wt per cent water in the upper 10 km of the mantle at the Middle America Trench (Lefeldt et al.2012), and up to 20 per cent serpentinization below the Moho in the Kuril Trench (Fujie et al.2013). On the other hand, Korenaga (2017) has noted that an increase of water-filled fractures results in the same degree of seismic velocity reduction as serpentinization, with smaller amounts of water. Hence, it may be misleading to estimate the amount of water transported into the mantle solely from Vp changes in the trench–outer rise region.
Vp reduction and increase of inferred water content in the uppermost mantle.
| Depth below Moho (km) | Vp (reference, km s−1) | Vp (trench axis, km s−1) | Vp change (per cent) | H2O (wt per cent) |
|---|---|---|---|---|
| 5 | 8.26 | 7.50 | −9.20 | 2.85 |
| 10 | 8.48 | 7.97 | −6.01 | 1.86 |
| 15 | 8.49 | 8.18 | −3.65 | 1.13 |
| Depth below Moho (km) | Vp (reference, km s−1) | Vp (trench axis, km s−1) | Vp change (per cent) | H2O (wt per cent) |
|---|---|---|---|---|
| 5 | 8.26 | 7.50 | −9.20 | 2.85 |
| 10 | 8.48 | 7.97 | −6.01 | 1.86 |
| 15 | 8.49 | 8.18 | −3.65 | 1.13 |
Although both Vp and Vs decrease with proximity to the trench axis, the Vp/Vs profiles do not show the increase that would be expected as a result of increased serpentine content (e.g. Christensen 2004). However, an increase in water-filled fractures can explain the variations in Vp/Vs accompanying seismic velocity reductions in both Vp and Vs (Korenaga 2017). Vp/Vs is important to evaluate oceanic mantle hydration, but interpretations may also be complicated by seismic anisotropy. Tonegawa et al. (2018) have reported OBS data showing seismic anisotropy in the outer rise region of the northwest Pacific Ocean with the fast direction oriented parallel to the trench, which is likely related to the presence of bending-related normal faults. Anisotropy with trench-parallel fast directions in the incoming Pacific plate has likewise been reported in the Mariana subduction zone (Cai et al.2018).
Residuals of P-wave arrivals for station–event pairs in the uppermost oceanic mantle seawards of the trench axis show a clear sinusoidal distribution of backazimuths (Fig. 11a). These residuals are normalized by the traveltime from the hypocentre to the OBS on the basis of the estimated origin time to remove the effect of variations in path length. The sinusoidal distribution suggests the existence of seismic anisotropy in the uppermost oceanic mantle with the fast direction parallel to the Japan Trench. In the case of S-wave arrivals, the distribution of residuals is not clearly sinusoidal, but it may be that shear-wave splitting led to arrivals being picked at the arrival of the fast component of split shear waves. If the increase in seismic anisotropy with proximity to the trench axis is due to bending-related normal faults, then the discrepancy between an isotropic Vs and the Vs structure from the tomographic analysis (Figs 5b and 10b), which would reflect the fast-component Vs, could increase with proximity to the trench axis. Anisotropy in the trench–outer rise region is an important consideration for future studies.
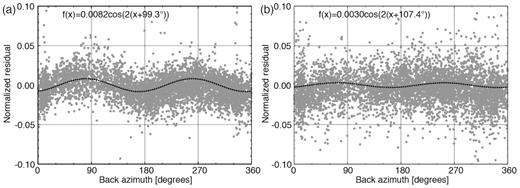
Traveltime residuals for (a) P-wave arrivals and (b) S-wave arrivals with backazimuths. Residuals are normalized by the traveltime (observed arrival time minus estimated origin time). Residuals are shown only for event–station pairs meeting the following criteria: (i) both the event and the station are seawards of the trench axis, (ii) the events are at depths between 14 and 20 km, corresponding to the uppermost mantle and (iii) the epicentral distance is between 30 and 50 km. The dotted lines are sinusoidal fittings.
5.3 Structure heterogeneity and seismicity in the oceanic mantle
Although the seismic velocity structure of the incoming Pacific plate shows a systematic velocity change with distance from the trench axis, it also includes spatial heterogeneities within the oceanic mantle. Seismicity within the mantle and M7-class large intraplate earthquakes both generally coincide with areas of lower Vp compared to surrounding regions (Fig. 12). The results of the resolution test (Fig. 12c) indicate that the spatial resolution of the tomographic analysis is sufficient to resolve areas of lower Vp. Focal mechanisms obtained from our OBS observations document a predominance of normal faulting in the uppermost mantle down to a depth of about 40 km (Fig. 7). The coincidence of lower Vp areas and mantle seismicity likely indicates localized mantle hydration or an increase in water-filled fractures due to bending-related normal faults. Thus, it may be possible that large outer-rise normal faults extending into the mantle can be imaged as areas of lower Vp in the uppermost mantle. Although we cannot specify the respective influence of these two mechanisms on the mantle heterogeneity observed in this study, some amount of water related to mantle serpentinization is likely transported by the subducting slab (Cai et al.2018). If areas of low Vp indicate localized hydration through bending-related normal faults, such areas could be reactivated as intraslab earthquake faults within the downgoing slab, as proposed by Nakajima et al. (2011). One exceptional earthquake cluster 60–80 km from the trench axis (white ellipsoid in Fig. 12) does not coincide with lower Vp mantle. We speculate that faults extending into the mantle near this cluster are immature to be evident as a low-Vp area, given that the area sits close to where the velocity change begins, about 70 km from the trench axis.
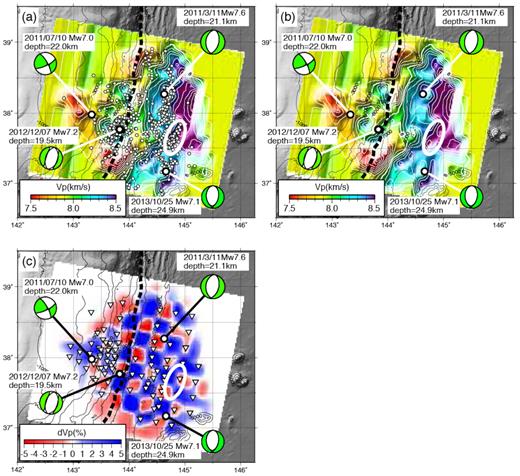
(a,b) P-wave velocity at 10 km below the Moho. Epicentres of earthquakes 5–15 km below the Moho are indicated by the open circles in (a) and removed for clarity in (b). Focal mechanisms of M7-class earthquakes between the 2011 March Tohoku-oki earthquake and 2017 December from the Global CMT Project (Dziewonski et al.1981; Ekström et al.2012) are indicated. The white ellipsoids indicate an earthquake cluster outside the area of low Vp (see the text). The velocity image is illuminated from 135° to highlight the spatial variations. (c) Map view showing the result of the checkerboard resolution test for Vp at a depth of 10 km below the Moho. The inverted triangles indicate OBS locations.
6 CONCLUSIONS
We modelled the seismic velocity structure of the uppermost oceanic mantle of the Pacific plate where it approaches subduction into the Japan Trench on the basis of OBS data obtained from repeated observations in 2011–2014. The OBS observations, made seawards of the rupture area of the 2011 Tohoku-oki earthquake, recorded intraplate normal-faulting seismicity in the trench–outer rise region. We derived the 3-D seismic velocity structure as well as the hypocentre distribution and focal mechanisms from the OBS data.
Both Vp and Vs in at least the upper 15 km of the oceanic mantle in the incoming Pacific plate decrease with proximity to the trench axis (Fig. 10). The velocity reduction, which is apparent within 70 km of the trench axis and is greater at shallower depths, could be related to mantle hydration by water infiltration through bending-related normal faults in the trench–outer rise region. The inferred water content in the uppermost 15 km of the mantle is increased by about 1.1–2.9 wt per cent under the assumption that the Vp changes are entirely due to mantle serpentinization. However, water-filled fractures can also explain the observed velocity reduction with smaller amounts of water (Korenaga 2017). Although the occurrence of normal-faulting earthquakes 30–35 km below the Moho suggests that mantle hydration extends to greater depths, the resolution of our seismic velocity structure is insufficient to confirm this. Even though the velocity reduction with proximity to the trench is evident in both Vp and Vs data, the Vs structure may be obscured as a result of anisotropy in the trench–outer rise region.
In addition to the general trend of decreasing seismic velocities in the uppermost mantle of the incoming Pacific plate with proximity to the trench axis, our velocity model has spatial heterogeneities that appear to be related to mantle seismicity. Earthquakes in the uppermost oceanic mantle generally coincide with areas of lower Vp; one exceptional cluster about 60–80 km seawards of the trench axis does not coincide with areas of lower Vp, possibly because the faults extending into the mantle there are immature (Fig. 12). We interpret the coincidence of low-velocity mantle and mantle seismicity as evidence of localized hydration or increase of water-filled fractures along bending-related normal faults. Hence, areas of low Vp in the uppermost oceanic mantle may be indicators of possible fault zones responsible for large outer-rise normal-faulting earthquakes, with ruptures extending into the mantle. These faults could be reactivated as seismogenic faults within the subducting slab, as proposed by Nakajima et al. (2011).
SUPPORTING INFORMATION
Figure S1. Cross-sections of the initial P-wave velocity models along axis X. Crosses indicate grid nodes of the velocity model. (a) Initial velocity model A, the same model shown in Fig. 4. (b) Initial velocity model B with Vp of 8.2 km s−1 below the oceanic Moho. (c) Initial velocity model C based on the 1-D Vp model used for the OBSs seawards of the trench axis in the preliminary analysis (labelled S in Fig. 2c).
Figure S2. Velocity model from the tomographic analysis based on initial P-wave velocity model B (Fig. S1b). The areas enclosed by thick orange dashed lines are the same as in Fig. 5. (a,b) Maps showing (a) P-wave velocity and (b) S-wave velocity at 25 km depth. The black dashed line indicates the Japan Trench axis. (c,d) Cross-sections of (c) P-wave velocity and (d) S-wave velocity along axis X.
Figure S3. Velocity model from the tomographic analysis based on initial P-wave velocity model C (Fig. S1c). The areas enclosed by thick orange dashed lines are the same as in Fig. 5. (a,b) Maps showing (a) P-wave velocity and (b) S-wave velocity at 25 km depth. The black dashed line indicates the Japan Trench axis. (c,d) Cross-sections of (c) P-wave velocity and (d) S-wave velocity along axis X.
Figure S4. Velocity model errors estimated by using the bootstrap samples. (a,b) Maps showing (a) P-wave velocity errors and (b) S-wave velocity errors at 25 km depth. The black dashed line indicates the Japan Trench axis. (c,d) Cross-sections of (c) P-wave velocity errors and (d) S-wave velocity errors along axis X. The areas enclosed by thick orange dashed lines are the same as in Fig. 5.
Figure S5. Error ellipsoids estimated by using 100 bootstrap samples. (a) Plan view and (b) cross-section projected onto axis X.
Figure S6. Comparison of across-trench profiles (Figs 10a–c) at depths of 5, 10 and 15 km below the Moho (Figs 10d–f) obtained from different initial models. (a–c) Profiles of (a) Vp, (b) Vs and (c) Vp/Vs obtained by using initial model A (Figs 4 and S1a). These are the same profiles shown in Figs 10(g)–(i). (d–f) Profiles of (d) Vp, (e) Vs and (f) Vp/Vs obtained by using initial model B (Fig. S1b). (g–i) Profiles of (g) Vp, (h) Vs and (i) Vp/Vs obtained by using initial model C (Fig. S1c).
Please note: Oxford University Press is not responsible for the content or functionality of any supporting materials supplied by the authors. Any queries (other than missing material) should be directed to the corresponding author for the paper.
ACKNOWLEDGEMENTS
This study was supported by JSPS KAKENHI Grants JP15H05718 and JP16H04045. The OBS deployment and recovery cruises were partly supported by the Japan Meteorological Agency and by Special Coordination Funds for the Promotion of Science and Technology (MEXT, Japan) intended for integrated research for the 2011 off the Pacific coast of Tohoku Earthquake. We are grateful to the captains, crews, onboard scientists and technicians of these cruises for their support. We thank Masanao Shinohara, Ryota Hino, Hajime Shiobara, Kenji Uehira, Kazuo Nakahigashi, Tomoaki Yamada, Hiroko Sugioka, Aki Ito, Yasuyuki Nakamura, Tetsuo No, Takeshi Sato, Hikaru Iwamaru, Mikiya Yamashita, Yuka Kaiho, Narumi Takahashi and Yoshiyuki Kaneda for their support for the OBS observations. The focal mechanisms of M 7-class earthquakes used in this study were obtained from the Global CMT Project (http://www.globalcmt.org). We thank two anonymous reviewers for their helpful comments.
