


Summary
Differences between seismic and geodetic strain rates can highlight regions of potential seismic hazard. In China, many of the most devastating historical and recent earthquakes have occurred around the margins of the Ordos Plateau. We construct an earthquake catalogue for the region that covers the 700 yr period from 1315 to 2015, and is thought to be complete for events with Ms > 6. We use Kostrov summations to determine a seismic strain rate tensor for each of the margins of the Ordos Plateau. We also use the latest campaign GPS data to calculate both a continuously varying geodetic strain rate field for the region and individual geodetic strain rate tensors for each of the plateau margins. We then compare our seismic and geodetic strain rate results to identify regions with seismic moment deficits and also calculate expected recurrence intervals from our geodetic moment rates. We find notable seismic strain rate deficits in northern Ningxia (to the west of the Ordos Plateau), in the Hetao and Linhe Grabens (to the north of the plateau), and in the Shanxi Grabens (to the northeast of the plateau). In the Weihe Graben (to the south of the plateau), although there is an overall seismic strain rate excess for the last 700 yr, there is some indication of relative quiescence for the last few centuries. Assuming no aseismic accommodation of deformation, these deficits indicate enhanced potential for large earthquakes in these regions in the future. Either temporal clustering of earthquakes or individual, large-magnitude events with long recurrence intervals could explain these patterns of moment release. Meanwhile, in southern Ningxia (to the southwest of the plateau) we find a seismic strain rate excess, indicating a likely lower level of seismic hazard in this region. In southern Ningxia and the Shanxi Grabens the pattern of strain suggested by the Kostrov summations is consistent with the geodetic strains. In northern Ningxia, the Hetao and Linhe Grabens, and the Weihe Graben—where there are fewer historical earthquakes and sparser GPS station coverage—the seismic and geodetic patterns of strain release are inconsistent.
1 INTRODUCTION
Earthquake hazard in China is severe, and many of the most damaging historical earthquakes in China have occurred around the margins of the Ordos Plateau, including around 19 earthquakes with Ms ≥ 7 (Zhang et al. 2003). The 1556 Huaxian earthquake, which occurred in the Weihe Graben to the south of the Ordos Plateau, is thought to be the deadliest earthquake in history, resulting in the deaths of an estimated 830 000 people (Hou et al. 1998; Yuan & Feng 2010; Feng et al. 2017; Zhou 2016). Other major historical events include: the 1303 Hongdong earthquake on the Huoshan Fault, which killed ≈200 000 people, and the 1739 Yinchuan earthquake on the East Helanshan Fault, which killed ≈50 000 people (Middleton et al. 2016a). In the 20th century, earthquake deaths in China have accounted for more than 50 per cent of the global total (Jordan et al. 2011). Three of the ten deadliest earthquakes since 1900 have occurred in China, and all three had epicentres near the Ordos Plateau: the 1920 Haiyuan, 1976 Tangshan, and 2008 Wenchuan events.
High population densities around the Ordos Plateau make the region particularly susceptible to earthquake disasters. The plateau spans parts of the provinces of Inner Mongolia, Ningxia, Gansu, Hebei, Beijing, Shanxi and Shaanxi, which have a combined population of over 220 million people; and the adjacent North China Plain is one of the most densely populated regions on the planet (see Fig. 1 a; note the logarithmic colour scale). The population density is particularly high at the margins of the Ordos Plateau, immediately adjacent to the main active faults because attractive locations for settlements (in terms of topography and water supply) have been directly controlled by the tectonics.

(a) Population density map for northern China based on 2015 census data and adjusted to match the 2015 revision of the United Nations World Population Prospects country totals (Columbia University 2015; Doxsey-Whitfield et al. 2015). Colour indicates the number of people per square kilometre on a logarithmic scale. (b) Map of seismic hazard from the Global Seismic Hazard Assessment Program (GSHAP; Zhang et al. 1999). Colours indicate the peak ground acceleration (in ms−2) with a 10 per cent exceedance probability in the next 50 yr. (c) SRTM topography in northern China (Farr et al. 2007). Red box shows location of Fig. 2. Inset globe shows the location of these three figures within Asia.
The first Chinese seismic hazard maps were produced in the 1950s on the principle that earthquakes of the same magnitude were likely to recur in locations where they had occurred previously (Zhang et al. 1999; Jordan et al. 2011). A second version was published in 1977 and was used to inform national building codes (Zhang et al. 1999; Jordan et al. 2011). The seismic hazard map shown in Fig. 1(b) was constructed as part of the Global Seismic Hazard Assessment Program (GSHAP) and is based on historical earthquake catalogues and previously defined ‘seismic zones’ (Zhang et al. 1999). The map clearly highlights regions of hazard at the margins of the Ordos Plateau, but many of the regions of highest hazard simply correspond to the locations of recent earthquakes, such as the 1920 Haiyuan event and the 1966 Xingtai earthquakes to the east of the plateau. The usefulness of this sort of hazard map, especially in continental regions that are known to have faults with low slip rates and long recurrence intervals, has therefore been questioned (Stein et al. 2012; Stein & Friedrich 2014). For example, Fig. 1(b) does not highlight the Longmenshan as a region of notable hazard, and yet this was the location of the subsequent 2008 Wenchuan earthquake.
An alternative approach to seismic hazard has therefore been to use geodetic measurements to map the current rate of strain accumulation. Assuming no aseismic deformation, regions which show a shortfall in seismic strain compared to geodetic strain are likely to be regions of high seismic risk in the near future, whilst regions with excess seismic strain compared to geodetic strain are likely to be regions of lower seismic risk. However, the length of the earthquake catalogue must be comparable to the recurrence interval of the largest earthquake for reliable seismic strain rates to be estimated. China has arguably the longest and most complete historical earthquake records of anywhere in the world, extending back well over 2000 yr (Lee et al. 1976, 1978; Wang 2004; Liu et al. 2011), making it one of the best possible places to attempt this analysis.
In this study, we use Kostrov’s relation to calculate seismic strain rate tensors for each of the deforming margins of the Ordos Plateau, aiming to assess and update the previous calculations from Wesnousky et al. (1984). We also calculate the magnitudes and azimuths of the principal seismic strain rates, which Wesnousky et al. (1984) did not do. We then compare our results to geodetic strain rates derived from the latest campaign GPS measurements (Zhao et al. 2015) in order to assess the future seismic hazard at the margins of the Ordos block. Finally, we consider our results in relation to Wang et al. (2011), who used an elastic block model with the GPS data from Zhang & Gan (2008) to determine slip rates and seismic moment deficits on major active faults throughout China. We prefer to consider a continuously varying geodetic strain rate field so that the choice of block boundaries does not unduly influence the moment rate for a given seismic zone, though we note that both methodologies assume elastic behaviour of the upper crust.
2 METHODS
2.1 Kostrov summations
Focal parameters for historical earthquakes around the Ordos Plateau.
| Year | Month | Day | Lat (°) | Long (°) | Mwa | M0b (Nm) | Eq. ref. | Strike (°) | Dip (°) | Rake (°) | FP ref. | Assigned fault | FP notes |
|---|---|---|---|---|---|---|---|---|---|---|---|---|---|
| 1337 | 9 | 8 | 40.4 | 115.7 | 6.5 | 6.24 × 10¹⁸ | Lee et al. (1976) | 55 | 75 | −77 | This study, Pavlides et al. (1999) | Yanqing Fault | Av. 5 striations |
| 1352 | 4 | 18 | 35.6 | 105.3 | 6.8 | 1.90 × 10¹⁹ | Lee et al. (1976) | 130 | 45 | 90 | Wesnousky et al. (1984) | In literature | |
| 1363 | 7 | 8 | 37.6 | 112.5 | 6.0 | 1.11 × 10¹⁸ | Lee et al. (1976) | 50 | 60 | −90 | This study | Jiaocheng Fault | Nearest fault |
| 1467 | 6 | 18 | 39.6 | 112.3 | 5.5 | 1.97 × 10¹⁷ | Liu et al. (2011) | 20 | 74 | 138 | This study | Nearest instrumental eq | |
| 1477 | 5 | 13 | 38.5 | 106.3 | 6.5 | 6.70 × 10¹⁸ | Lee et al. (1976) | 30 | 75 | −150 | Wesnousky et al. (1984) | In literature | |
| 1484 | 2 | 7 | 40.5 | 116.1 | 6.8 | 1.76 × 10¹⁹ | Liu et al. (2011) | 55 | 75 | −77 | This study, Pavlides et al. (1999) | Yanqing Fault | Av. 5 striations |
| 1487 | 8 | 19 | 34.4 | 108.9 | 6.3 | 3.13 × 10¹⁸ | Liu et al. (2011) | 270 | 60 | −90 | This study, Rao et al. (2015) | Lishan Piedmont Fault | Nearest fault |
| 1495 | 4 | 10 | 37.6 | 105.6 | 6.3 | 2.63 × 10¹⁸ | Lee et al. (1976) | 120 | 45 | 45 | This study, Liu-Zeng et al. (2015) | Zhongwei-Tongxin Fault | Nearest fault |
| 1501 | 1 | 29 | 34.8 | 110.1 | 7.0 | 3.30 × 10¹⁹ | Liu et al. (2011) | 230 | 60 | −90 | Wesnousky et al. (1984) | In literature | |
| 1502 | 12 | 4 | 39.0 | 112.6 | 5.3 | 9.89 × 10¹⁶ | Liu et al. (2011) | 45 | 62 | −90 | This study, Li et al. (2015a) | Yunzhongshan Fault | Nearest fault |
| 1514 | 10 | 30 | 38.7 | 113.0 | 5.3 | 9.89 × 10¹⁶ | Liu et al. (2011) | 129 | 85 | 18 | This study | Nearest instrumental eq | |
| 1545 | 2 | x | 40.0 | 114.0 | 5.3 | 9.89 × 10¹⁶ | Liu et al. (2011) | 250 | 65 | −135 | This study, Li et al. (2015a) | Liulengshan Fault | Nearest fault |
| 1556 | 1 | 23 | 34.5 | 109.7 | 7.9 | 8.32 × 10²⁰c | Liu et al. (2011) | 270 | 60 | −90 | Wesnousky et al. (1984) | Huashan/Weinan Tableland Fault | Zhou (2016) |
| 1561 | 7 | 25 | 37.4 | 106.0 | 7.2 | 6.90 × 10¹⁹ | Lee et al. (1976) | 145 | 30 | 90 | Wesnousky et al. (1984) | In literature | |
| 1568 | 5 | 15 | 34.4 | 109.0 | 6.8 | 1.80 × 10¹⁹ | Liu et al. (2011) | 270 | 60 | −90 | Wesnousky et al. (1984) | In literature | |
| 1573 | 1 | 10 | 34.4 | 104.0 | 6.8 | 1.48 × 10¹⁹ | Lee et al. (1976) | 196 | 57 | 151 | This study, Zheng et al. (2007) | Lintan-Dangchang Fault | Nearest instrumental eq |
| 1580 | 9 | 15 | 39.5 | 112.3 | 5.8 | 5.56 × 10¹⁷ | Liu et al. (2011) | 20 | 74 | 138 | This study | Nearest instrumental eq | |
| 1581 | 5 | 18 | 39.8 | 114.5 | 6.0 | 1.11 × 10¹⁸ | Lee et al. (1976) | 250 | 60 | −110 | This study, Liu et al. (2007) | Yuguang Graben Fault | Nearest fault |
| 1583 | 5 | 18 | 39.7 | 113.8 | 5.5 | 1.97 × 10¹⁷ | Lee et al. (1976) | 225 | 65 | −116 | This study, Li et al. (2015a) | Hengshan Fault | Nearest fault |
| 1604 | 10 | 25 | 34.2 | 105.0 | 6.0 | 1.11 × 10¹⁸ | Lee et al. (1976) | 334 | 46 | 38 | This study | Nearest instrumental eq | |
| 1614 | 10 | 23 | 37.2 | 112.1 | 6.0 | 1.11 × 10¹⁸ | Liu et al. (2011) | 230 | 60 | −65 | Li et al. (2015a) | Jiexiu-Taigu | In literature |
| 1618 | 5 | 20 | 37.0 | 111.9 | 6.0 | 1.11 × 10¹⁸ | Liu et al. (2011) | 15 | 90 | 180 | This study | Huoshan Fault | Nearest fault |
| 1618 | 11 | 16 | 39.8 | 114.5 | 6.0 | 1.11 × 10¹⁸ | Lee et al. (1976) | 250 | 60 | −110 | Liu et al. (2007) | Yuguang Graben Fault | In literature |
| 1622 | 10 | 25 | 36.5 | 106.3 | 7.7 | 3.42 × 10²⁰ | Lee et al. (1976) | 180 | 45 | 90 | Wesnousky et al. (1984) | In literature | |
| 1624 | 7 | 4 | 35.4 | 105.9 | 6.0 | 1.11 × 10¹⁸ | Lee et al. (1976) | 160 | 45 | 45 | This study | Liupanshan Fault | Nearest fault |
| 1626 | 6 | 28 | 39.4 | 114.2 | 7.2 | 8.10 × 10¹⁹ | Lee et al. (1976) | 220 | 60 | −120 | Wesnousky et al. (1984) | Lingqiu Graben Fault | In literature |
| 1627 | 2 | 16 | 37.5 | 105.5 | 6.0 | 1.11 × 10¹⁸ | Lee et al. (1976) | 120 | 45 | 45 | This study | Zhongwei-Tongxin Fault | Nearest fault |
| 1628 | 10 | 7 | 40.6 | 114.2 | 6.5 | 6.24 × 10¹⁸ | Liu et al. (2011) | 75 | 45 | −97 | This study, Li et al. (2015a) | Yanggao-Tianzhen Graben Fault | Nearest fault |
| 1634 | 1 | x | 34.0 | 105.2 | 6.0 | 1.11 × 10¹⁸ | Lee et al. (1976) | 334 | 46 | 38 | This study | Nearest instrumental eq | |
| 1642 | 6 | 30 | 35.0 | 110.9 | 6.5 | 7.30 × 10¹⁸ | Liu et al. (2011) | 230 | 60 | −90 | Wesnousky et al. (1984) | In literature | |
| 1654 | 7 | 21 | 34.3 | 105.5 | 7.7 | 4.27 × 10²⁰ | Lee et al. (1976) | 105 | 90 | 0 | Wesnousky et al. (1984) | In literature | |
| 1658 | 2 | 3 | 39.4 | 115.7 | 6.0 | 1.11 × 10¹⁸ | Liu et al. (2011) | 45 | 90 | 180 | This study | Nearest fault | |
| 1664 | x | x | 38.7 | 112.7 | 5.5 | 1.97 × 10¹⁷ | Lee et al. (1976) | 200 | 62 | −160 | This study, Li et al. (2015a) | Yunzhongshan Fault | Nearest fault |
| 1665 | 4 | 16 | 39.9 | 116.6 | 6.5 | 6.24 × 10¹⁸ | Liu et al. (2011) | 205 | 50 | 160 | Liu et al. (2007) | In literature | |
| 1673 | 10 | 18 | 40.5 | 113.5 | 6.0 | 1.11 × 10¹⁸ | Liu et al. (2011) | 235 | 45 | −93 | Li et al. (2015a) | Yanggao-Tianzhen Graben Fault | In literature |
| 1673 | 10 | 18 | 40.5 | 114.1 | 5.5 | 1.97 × 10¹⁷ | Lee et al. (1976) | 75 | 45 | −97 | This study, Li et al. (2015a) | Yanggao-Tianzhen Graben Fault | Nearest fault |
| 1683 | 11 | 22 | 38.7 | 112.7 | 7.4 | 1.42 × 10²⁰ | Lee et al. (1976) | 200 | 60 | −160 | Wesnousky et al. (1984) | Yunzhongshan Fault | In literature |
| 1695 | 5 | 18 | 36.0 | 111.5 | 7.2 | 8.10 × 10¹⁹ | Liu et al. (2011) | 90 | 60 | 30 | Wesnousky et al. (1984) | In literature | |
| 1704 | 9 | 28 | 34.9 | 106.8 | 6.0 | 1.11 × 10¹⁸ | Lee et al. (1976) | 140 | 45 | −90 | This study | Nearest fault | |
| 1709 | 10 | 14 | 37.4 | 105.3 | 7.5 | 1.78 × 10²⁰ | Lee et al. (1976) | 295 | 30 | 30 | Wesnousky et al. (1984) | In literature | |
| 1718 | 6 | 19 | 35.0 | 105.2 | 7.3 | 8.90 × 10¹⁹ | Lee et al. (1976) | 105 | 90 | 0 | Wesnousky et al. (1984) | In literature | |
| 1720 | 7 | 12 | 40.4 | 115.5 | 6.8 | 1.48 × 10¹⁹ | Lee et al. (1976) | 67 | 69 | −81 | This study, Pavlides et al. (1999) | Huailai Fault | Av. 3 striations |
| 1730 | 9 | 30 | 40.0 | 116.2 | 6.5 | 6.24 × 10¹⁸ | Liu et al. (2011) | 30 | 45 | −90 | This study | Nearest fault | |
| 1739 | 1 | 3 | 38.9 | 106.5 | 7.6 | 2.72 × 10²⁰d | Lee et al. (1976) | 40d | 40d | −90d | Wesnousky et al. (1984) | East Helanshan Fault | Middleton et al. (2016a) |
| 1765 | 9 | 2 | 34.8 | 105.0 | 7.0 | 4.00 × 10¹⁹ | Lee et al. (1976) | 105 | 90 | 0 | Wesnousky et al. (1984) | In literature | |
| 1815 | 10 | 23 | 34.8 | 111.2 | 7.1 | 4.20 × 10¹⁹ | Liu et al. (2011) | 230 | 60 | −90 | Wesnousky et al. (1984) | In literature | |
| 1852 | 5 | 26 | 37.5 | 105.2 | 6.0 | 1.11 × 10¹⁸ | Lee et al. (1976) | 290 | 30 | 90 | This study | Nearest fault | |
| 1881 | 7 | 20 | 33.6 | 104.6 | 6.5 | 6.24 × 10¹⁸ | Lee et al. (1976) | 120 | 90 | 0 | This study | Nearest fault | |
| 1885 | 1 | 14 | 34.5 | 105.7 | 6.0 | 1.11 × 10¹⁸ | Lee et al. (1976) | 90 | 90 | 0 | This study | Nearest fault | |
| 1888 | 11 | 2 | 37.1 | 104.2 | 6.3 | 2.63 × 10¹⁸ | Lee et al. (1976) | 285 | 30 | 90 | This study | Nearest fault | |
| 1898 | 9 | 22 | 39.1 | 113.0 | 5.5 | 1.97 × 10¹⁷ | Lee et al. (1976) | 230 | 60 | −135 | This study, Li et al. (2015a) | Wutaishan Fault | Nearest fault |
| 1911 | 1 | 25 | 39.8 | 114.5 | 5.9 | 7.85 × 10¹⁷ | Liu et al. (2011) | 250 | 60 | −110 | This study, Liu et al. (2007) | Yuguang Graben Fault | Nearest fault |
| 1920 | 12 | 16 | 36.5 | 105.7 | 8.0 | 1.20 × 10²¹ | Lee et al. (1978) | 115 | 90 | 0 | Wesnousky et al. (1984) | In literature | |
| 1920 | 12 | 25 | 35.6 | 106.3 | 7.0 | 3.51 × 10¹⁹ | Lee et al. (1978) | 160 | 45 | 45 | This study | Liupanshan Fault | Nearest fault |
| 1920 | 12 | 28 | 35.5 | 105.5 | 6.3 | 2.63 × 10¹⁸ | Lee et al. (1978) | 160 | 45 | 45 | This study | Liupanshan Fault | Nearest fault |
| 1921 | 4 | 12 | 35.8 | 106.2 | 6.5 | 6.24 × 10¹⁸ | Lee et al. (1978) | 160 | 45 | 45 | This study | Liupanshan Fault | Nearest fault |
| 1929 | 1 | 14 | 40.7 | 111.3 | 6.0 | 1.11 × 10¹⁸ | Liu et al. (2011) | 70 | 60 | −90 | This study | Daqingshan Fault | Nearest fault |
| 1934 | 1 | 21 | 41.0 | 108.8 | 6.3 | 3.13 × 10¹⁸ | Liu et al. (2011) | 120 | 60 | −90 | This study | Seertengshan Fault | Nearest fault |
| 1936 | 8 | 1 | 34.2 | 105.7 | 6.0 | 1.11 × 10¹⁸ | Lee et al. (1978) | 334 | 46 | 38 | This study | Nearest instrumental eq | |
| 1952 | 10 | 8 | 39.0 | 112.7 | 5.5 | 1.97 × 10¹⁷ | Liu et al. (2011) | 45 | 62 | −90 | This study, Li et al. (2015a) | Yunzhongshan Fault | Nearest fault |
| 1962 | 12 | 7 | 38.1 | 106.3 | 5.5 | 1.97 × 10¹⁷ | Qin et al. (2002) | 108 | 36 | 144 | CSBe | In literature | |
| 1965 | 1 | 13 | 35.0 | 111.6 | 5.5 | 1.97 × 10¹⁷ | Qin et al. (2002) | 201 | 65 | −158 | CSB | In literature | |
| 1967 | 7 | 28 | 40.5 | 115.6 | 5.4 | 1.40 × 10¹⁷ | Liu et al. (2011) | 67 | 69 | −81 | This study, Pavlides et al. (1999) | Huailai Fault | Av. 3 striations |
| 1967 | 12 | 18 | 36.5 | 111.2 | 5.4 | 1.40 × 10¹⁷ | Qin et al. (2002) | 355 | 80 | −161 | CSB | In literature | |
| 1970 | 12 | 3 | 35.9 | 105.6 | 5.1 | 4.95 × 10¹⁶ | Qin et al. (2002) | 9 | 74 | 132 | CSB | In literature | |
| 1971 | 6 | 28 | 37.9 | 106.3 | 5.1 | 4.95 × 10¹⁶ | Qin et al. (2002) | 213 | 63 | 46 | CSB | In literature | |
| 1976 | 4 | 6 | 40.2 | 112.1 | 6.2 | 2.21 × 10¹⁸ | Liu et al. (2011) | 209 | 75 | 164 | CSB | In literature | |
| 1976 | 9 | 23 | 39.9 | 106.4 | 6.2 | 2.21 × 10¹⁸ | Qin et al. (2002) | 79 | 68 | 28 | CSB | In literature | |
| 1979 | 6 | 19 | 36.83 | 111.50 | 5.0 | 3.51 × 10¹⁶ | GCMTf | 278 | 30 | −63 | GCMTf | In literature | |
| 1979 | 8 | 24 | 40.83 | 108.24 | 5.7 | 3.94 × 10¹⁷ | GCMT | 111 | 44 | −65 | GCMT | In literature | |
| 1981 | 8 | 13 | 40.50 | 113.40 | 5.5 | 1.97 × 10¹⁷ | Qin et al. (2002) | 183 | 80 | −178 | CSB | In literature | |
| 1987 | 1 | 7 | 34.23 | 103.86 | 5.4 | 1.40 × 10¹⁷ | GCMT | 170 | 65 | 28 | GCMT | In literature | |
| 1987 | 8 | 10 | 37.57 | 105.63 | 5.3 | 9.89 × 10¹⁶ | GCMT | 336 | 25 | −75 | GCMT | In literature | |
| 1988 | 1 | 3 | 38.13 | 106.86 | 5.2 | 7.00 × 10¹⁶ | GCMT | 110 | 57 | 5 | GCMT | In literature | |
| 1989 | 10 | 18 | 39.63 | 113.84 | 5.4 | 1.40 × 10¹⁷ | GCMT | 92 | 44 | −39 | GCMT | Hengshan Fault | In literature |
| 1989 | 10 | 18 | 39.77 | 113.49 | 5.6 | 2.79 × 10¹⁷ | GCMT | 200 | 75 | −175 | GCMT | Liulengshan Fault | In literature |
| 1989 | 10 | 18 | 39.83 | 113.61 | 5.4 | 1.40 × 10¹⁷ | GCMT | 204 | 76 | −176 | GCMT | Liulengshan Fault | In literature |
| 1989 | 10 | 19 | 39.94 | 113.84 | 6.1 | 1.57 × 10¹⁸ | Li et al. (2015a) | 200 | 44 | 136 | Li et al. (2015a) | Dawang-Tuanbao Fault | In literature |
| 1989 | 10 | 19 | 39.92 | 113.91 | 5.9 | 7.85 × 10¹⁷ | Xu et al. (2000) | 210 | 76 | −167 | Xu et al. (2000) | In literature | |
| 1991 | 3 | 25 | 40.10 | 113.34 | 5.4 | 1.40 × 10¹⁷ | GCMT | 106 | 82 | 7 | GCMT | Datong Basin Fault | In literature |
| 1996 | 5 | 3 | 40.72 | 109.69 | 6.0 | 1.11 × 10¹⁸ | GCMT | 308 | 75 | −12 | GCMT | In literature | |
| 1998 | 1 | 10 | 41.34 | 114.34 | 5.7 | 3.94 × 10¹⁷ | GCMT | 207 | 54 | 135 | GCMT | In literature | |
| 1999 | 11 | 1 | 39.85 | 113.74 | 5.2 | 7.00 × 10¹⁶ | GCMT | 122 | 72 | −7 | GCMT | Liulengshan Fault | In literature |
| 2000 | 6 | 6 | 37.02 | 103.91 | 5.5 | 1.97 × 10¹⁷ | GCMT | 96 | 68 | −6 | GCMT | In literature | |
| 2003 | 11 | 13 | 34.61 | 104.10 | 5.1 | 4.95 × 10¹⁶ | GCMT | 347 | 42 | 53 | GCMT | In literature | |
| 2013 | 7 | 21 | 34.60 | 104.31 | 6.0 | 1.11 × 10¹⁸ | GCMT | 196 | 57 | 151 | GCMT | In literature | |
| 2013 | 7 | 22 | 34.65 | 104.35 | 5.4 | 1.40 × 10¹⁷ | GCMT | 153 | 37 | 103 | GCMT | In literature | |
| 2015 | 4 | 15 | 39.74 | 106.39 | 5.5 | 1.97 × 10¹⁷ | GCMT | 356 | 81 | −177 | GCMT | In literature |
aMagnitudes for historical earthquakes are estimated from intensities on the New Chinese Intensity Scale using Ms = 0.58 × I0 + 1.5. Ms is considered equal to Mw for Ms ≤ 8 (Kanamori 1983).
bM0 calculated from Mw using M0 = 10|$\frac{3}{2}$| (Mw+6.03).
cSeismic moment and focal parameters for 1556 earthquake re-estimated from Zhou (2016).
dSeismic moment and focal parameters for 1739 earthquake re-estimated from Middleton et al. (2016a).
eChina Seismological Bureau Catalogue (Qin et al. 2002).
fGlobal Centroid Moment Tensor Catalogue.
Focal parameters for 49 of these 88 earthquakes were available in the literature (Wesnousky et al. 1984; Xu et al. 2000; Qin et al. 2002; Liu et al. 2007; Li et al. 2015a) or the GCMT catalogue (see Data and Resources Section). For the remaining historical events, we estimated focal parameters from adjacent faults or nearby instrumental earthquakes (see Table 1). For four of the events, we were able to use fault striation measurements from the nearest adjacent fault (Pavlides et al. 1999) to estimate a focal mechanism, assuming that the sense of slip during the earthquake was the same as the Quaternary motion on the nearby fault. In 28 cases, where striations were not present but the earthquake could still reasonably be assigned to the nearest adjacent fault, we used geological strike and dip measurements from the literature, or our own mapped fault traces, and an estimate of the rake based on the known type of faulting (90° for reverse faults; 0° for left-lateral faults; −90° for normal faults; 180° for right-lateral faults; 45° for a combination of reverse and left-lateral faulting etcetera). Again, we assumed that the sense of slip during the earthquake was the same as the Quaternary motion on the nearby fault. In seven instances, we were not confident in assigning the earthquake to the adjacent mapped fault. In these cases, we used the nearest instrumental earthquake as an indicator of the likely focal mechanism. Four of these events were from the southwestern corner of the region and had magnitudes that were similar to the instrumental earthquakes that we compared them to. The other three were from the northern Shanxi Grabens, where the nearby instrumental earthquakes tended to have smaller magnitudes than the historical events (Li et al. 2015a). However, our own recent work in the northern Shanxi Grabens indicated that even short catalogues of much smaller earthquakes were reliable indicators of the pattern, if not the magnitude, of strain release (Middleton et al. 2017).
Focal mechanisms for most of the larger historical events in our catalogue are from Wesnousky et al. (1984), who also used Quaternary fault data, including a number of field studies, to allocate focal parameters. Fault strikes from mapped fault traces are reasonably reliable, but dips and rakes tend to be less well constrained. Hence, Wesnousky et al. (1984) estimated that their focal parameters may be wrong by up to ±15°. A similar level of uncertainty is likely to apply to the focal parameters estimated in this study. However, during our recent work in the northern Shanxi Grabens, we found that uncertainties in dips and rakes of ±15° led to the magnitudes of the principal strain rates varying by up to around 30 per cent, while the azimuths of the principal strain rates only varied by ±8° (Middleton et al. 2017). What this indicates is that uncertainties in our estimated focal parameters have a much smaller influence on our final results than the uncertainties associated with the earthquake magnitudes.
We also updated some of the focal mechanisms in the Wesnousky et al. (1984) catalogue. For example, Wesnousky et al. (1984) assumed that both of their earthquakes in northern Ningxia, the 1477 and 1739 events, had the same mechanism, and used observations of offsets at the Great Wall to determine the fault parameters. We updated the 1739 mechanism on the basis of our own recent study of this event (Middleton et al. 2016a). Similarly, Wesnousky et al. (1984) attributed a predominantly strike-slip mechanism on a southward-dipping fault to the 1556 event and then used the same mechanism for the 1501, 1568, 1642 and 1815 events in the Weihe Graben. However, more recent studies have found fault striations that indicate almost pure normal motion during the 1556 earthquake on a northward-dipping fault (Zhou 2016), so we have updated all of these mechanisms.
Following the divisions used by Wesnousky et al. (1984) we split our calculation into five regions, which we call (from top to bottom and left to right): North Ningxia, South Ningxia, Hetao, Weihe and Shanxi (see Fig. 2). We used these relatively large horizontal extents for our calculations so as to include enough earthquakes for us to be able to apply Kostrov’s relation, and because it is not necessarily the case that all of the accumulating strain is localised on the mapped faults. We used a shear modulus (μ) of 3.3 GPa and a seismogenic thickness (Ts) of 20 km for all calculations. We chose Ts = 20 km as this was the value used by Wesnousky et al. (1984) and because numerous recent studies suggest that earthquake hypocentres in the Ordos region do not typically exceed ≈20 km (Xu et al. 2000; Wang et al. 2013; Cai et al. 2014; Cheng et al. 2014; Li et al. 2015a). (For example, in the catalogue used by Cheng et al. (2014) 91.6 per cent of the earthquakes and 99.9 per cent of the moment release occurred above 20 km.) We used earthquake depths rather than any alternative measures of crustal thickness as our proxy for Ts because it is only the seismogenic portion of the crust that is relevant for Kostrov summations. Then, having obtained the seismic strain rate tensor in each region, we calculated the principal strain rates in order to find the magnitude and azimuth of each of the maximum principal strain rates (see Appendix A). Finally, we determined the value of the parameter ϕ, where |$\tan \left(\phi \right) = \frac{\dot{\epsilon }_{2}}{\dot{\epsilon }_{1}}$|, which allows us to quantify the expected pattern of faulting in each region (see Appendix B for details).
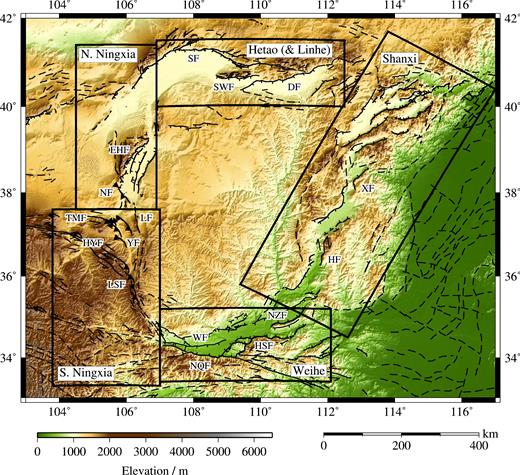
Active faults at the margins of the Ordos Plateau. Black boxes and labels indicate the five regions discussed in this paper. Faults were mapped from satellite imagery (source: http://earth.google.com) and based upon earlier fault maps from Tapponnier & Molnar (1977), Deng et al. (1984), Zhang et al. (1986), The Research Group on Active Fault System around Ordos Massif (1988), Zhang et al. (1990), Xu & Ma (1992), Deng & Liao (1996), Darby & Ritts (2002), Yu (2004), Darby et al. (2005) and Deng et al. (2007). Faults that are inferred or show no evidence of Quaternary activity are marked by dashed lines. Faults are labelled as follows: DF Daqingshan Fault; DFF Danfeng Fault; EHF East Helanshan Fault; HF Huoshan Fault; HSF Huashan Fault; HYF Haiyuan Fault; LF Luoshan Fault; LNF Luonan Fault; LSF Liupanshan Fault; NF Niushoushan Fault; NQF North Qinlingshan Fault; NZF North Zhongtiaoshan Fault; SF Seertengshan Fault; SWF South Wulashan Fault; TMF Tianjinshan-Miboshan Fault; WF Weihe Fault; XF Xizhoushan Fault; YF Yantongshan Fault.
We also note here that Ts is inversely proportional in a linear sense to the magnitudes of the seismic strain rates; a smaller seismogenic thickness would result in larger seismic strain rates (and hence smaller seismic moment deficits). However, likely variations in Ts of around ±5 km are not significant enough to affect our overall conclusions.
2.2 Strain rate field from GPS
Numerous GPS studies conducted in the last two decades have provided us with knowledge of the crustal motion in northeast China (Shen et al. 2000; Wang et al. 2001; He et al. 2003; Zhang et al. 2004; Gan et al. 2007; Li et al. 2012; Zhao et al. 2015, 2017). The Crustal Motion Observation Network of China was established in 1998 by the State Seismological Bureau of China (now the China Earthquake Administration) and provides a consistent GPS velocity field over much of China (Liu et al. 2007). The network originally comprised 27 continuous GPS stations and 1056 temporary survey stations, which were occupied in 1999, 2001 and 2004. More recently, the network has been upgraded with 233 new continuous GPS stations and an extra 1000 temporary survey stations, which were visited during field campaigns in 2009, 2011 and 2013 (Li et al. 2012; Zhao et al. 2015). Zhao et al. (2017) drew swath profiles through the GPS data from Zhao et al. (2015) in order to try and estimate slip rates on major active faults around the Ordos Plateau.
We calculated a continuously varying strain rate field from the latest campaign GPS measurements (Zhao et al. 2015), comprising these three occupations, according to the method of Shen et al. (1996) and Floyd et al. (2010). The motivation for considering a continuous strain rate field was that a number (though not all) theories of continental deformation postulate that the whole lithosphere in a deforming region responds to gradients in gravitational potential energy and stresses that are applied at its edges (Bird & Piper 1980; England & McKenzie 1982; Flesch et al. 2001; Calais et al. 2006).
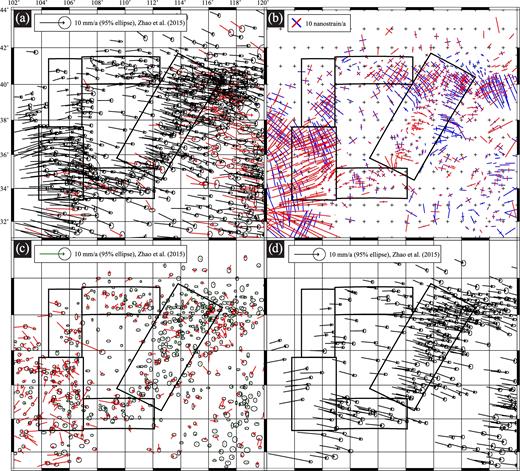
(a) GPS data from Zhao et al. (2015) relative to stable Eurasia. Red vectors indicate stations where northerly or easterly error is ≥ 0.5 mm a−1. Black boxes indicate regions in which Kostrov summations were performed. 790 stations lie within the region shown, of which 660 have errors < 0.5 mm a−1. (b) Strain rate field calculated from GPS at each GPS station, using α = 80 km and rmax = 200 km. Crosses indicate orientation and magnitude of maximum and minimum horizontal strain rate; blue indicates extension and red indicates contraction. (c) Residual vectors obtained when velocities from inversion in (b) are subtracted from the original data in (a). Red vectors indicate stations with residuals ≥ 1 mm a−1. 348 stations have residuals < 1 mm a−1. (d) Remaining 348 vectors from (a) that are used in final strain rate calculation.
We then compared the velocities that we obtained from our inversion to the original GPS vectors and calculated a residual at each site (see Fig. 3c). We removed sites with residual velocities greater than 1 mm a−1 (i.e. sites that did not fit a locally smooth field) to leave 348 sites in the region of interest (44 per cent of the original data; 53 per cent of the 660 reliable stations). In other words, we assumed locally homogeneous but regionally varying velocity gradients. For comparison, 500 sites had residuals less than 2 mm a−1 (63 per cent of the original data; 76 per cent of the 660 reliable stations). We then re-calculated the strain rate field on a regular 0.5° grid. If any calculation point did not include at least six GPS stations within a radius of rmax, then no calculation was performed at this site. (See Appendix C for mathematical details of these calculations.)
Finally, in order to compare the GPS results with our Kostrov summations, we also solved for a single set of velocity gradients (and hence a single strain rate tensor) in each Kostrov box. For each of these calculations we selected GPS sites that fell within the relevant Kostrov box from the 660 GPS vectors with errors less than 0.5 mm a−1. These calculations were not weighted by the Gaussian smoothing parameter α, so each GPS site contributed equally to the inversion. Then, having obtained a single geodetic strain rate tensor for each region, we calculated the principal strain rates and the values of the parameter ϕ in the same way as before (see Appendices A and B).
3 RESULTS
3.1 Kostrov summations
Fig. 4(a) shows the results of the Kostrov summations for the Wesnousky et al. (1984) catalogue; Fig. 4(b) shows the results of the Kostrov summations for the earthquake catalogue compiled in this study. The full results of the Kostrov summations are recorded in Table 2.
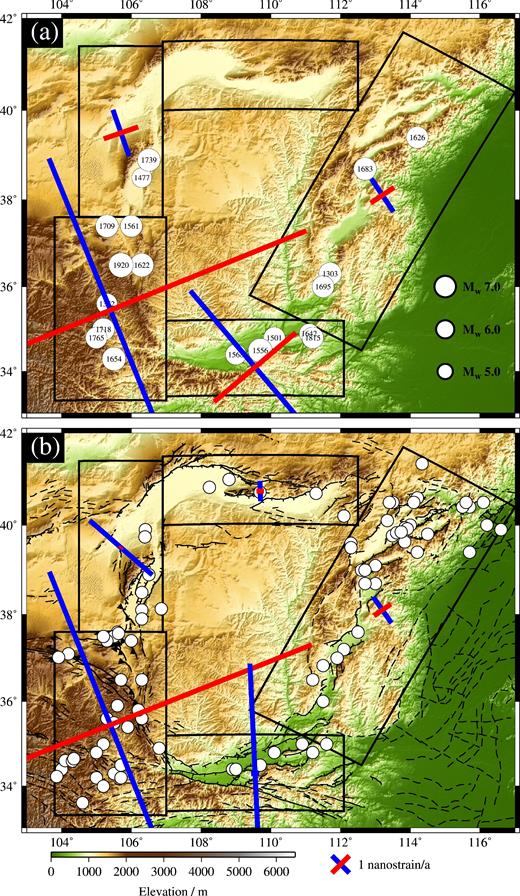
(a) SRTM topography (90 m resolution) of the Ordos Plateau (Farr et al. 2007). Black rectangles indicate Kostrov regions at the margins of the plateau. Historical earthquakes from Wesnousky et al. (1984) are shown as white circles, scaled according to their magnitude and including the year in which they occurred. Crosses indicate orientation and magnitude of maximum and minimum horizontal strain rate from a Kostrov summation in each region using the Wesnousky et al. (1984) earthquake catalogue; blue indicates extension and red indicates contraction. (b) Same as (a), but showing inferred focal mechanisms for our catalogue of historical earthquakes around the margins of the Ordos Plateau (see Table 1). Same earthquake magnitude scale as (a). B marks 1996 Baotou earthquake. Strain rate crosses as in (a), but calculated for our earthquake catalogue. See Table 2 for further details. Note that the scale is exaggerated 10 × for the Kostrov strain rate cross in the Linhe and Hetao Grabens. Faults from Fig. 2 are also shown.
Summary of results from Kostrov summations and GPS around the Ordos Plateau.
| Earthquakes | Time | No. eqs | Area | Σ M0 | M0 rate | |$\dot{\epsilon }_{1}$| | |$\dot{\epsilon }_{2}^{a}$| | |$\dot{\epsilon }_{1}$| az. | |$\dot{\epsilon }_{1}$|/|$\dot{\epsilon }_{2}$| | ϕb | Faultingc |
|---|---|---|---|---|---|---|---|---|---|---|---|
| used | (years) | (km2) | (Nm) | (Nm a−1) | (a−1) | (a−1) | (°) | radians | |||
| Earthquake catalogue from Wesnousky et al. (1984) | |||||||||||
| North Ningxia | 700 | 2 | 86,992 | 1.66 × 10²⁰ | 2.37 × 10¹⁷ | 2.00 × 10⁻⁹ | −1.49 × 10⁻⁹ | 161 | −1.34 | 2.50 | SS + normal |
| South Ningxia | 700 | 8 | 138,561 | 2.36 × 10²¹ | 3.38 × 10¹⁸ | 1.34 × 10⁻⁸ | −1.73 × 10⁻⁸ | 158 | −0.77 | 2.23 | SS + reverse |
| Hetao | 700 | 0 | 78,661 | N/A | N/A | N/A | N/A | N/A | N/A | N/A | N/A |
| Weihe | 700 | 5 | 93,765 | 7.61 × 10²⁰ | 1.09 × 10¹⁸ | 8.19 × 10⁻⁹ | −4.39 × 10⁻⁹ | 140 | −1.87 | 2.65 | SS + normal |
| Shanxi | 700 | 4 | 239,349 | 4.22 × 10²⁰ | 6.03 × 10¹⁷ | 1.62 × 10⁻⁹ | −1.16 × 10⁻⁹ | 146 | −1.40 | 2.52 | SS + normal |
| Earthquake catalogue from this study | |||||||||||
| North Ningxia | 700 | 8 | 86,992 | 2.84 × 10²⁰ | 4.06 × 10¹⁷ | 3.40 × 10⁻⁹ | −8.12 × 10⁻¹¹ | 131 | −41.87 | 3.12 | Normal + SS |
| South Ningxia | 700 | 30 | 138,561 | 2.44 × 10²¹ | 3.49 × 10¹⁸ | 1.35 × 10⁻⁸ | −1.78 × 10⁻⁸ | 158 | −0.76 | 2.22 | SS + reverse |
| Hetao | 700 | 5 | 78,661 | 7.95 × 10¹⁸ | 1.14 × 10¹⁶ | 8.30 × 10⁻¹¹ | −3.02 × 10⁻¹¹ | 178 | −2.75 | 2.79 | Normal + SS |
| Weihe | 700 | 7 | 93765 | 9.36 × 10²⁰ | 1.34 × 10¹⁸ | 9.03 × 10⁻⁹ | 3.20 × 10⁻¹⁰ | 177 | 28.22 | 3.18 | Normal + normal |
| Shanxi | 700 | 40 | 239,349 | 3.76 × 10²⁰ | 5.37 × 10¹⁷ | 1.30 × 10⁻⁹ | −8.32 × 10⁻¹⁰ | 145 | −1.56 | 2.57 | SS + normal |
| GPS-derived strain rates in Kostrov regions | |||||||||||
| North Ningxia | 4 | 24d | 86,992 | 6.71 × 10²⁰e | 9.59 × 10¹⁷ | 6.30 × 10⁻⁹ | −8.35 × 10⁻⁹ | 130 | −0.75 | 2.22 | SS + reverse |
| South Ningxia | 4 | 76d | 138,561 | 2.05 × 10²¹e | 2.93 × 10¹⁸ | 4.85 × 10⁻⁹ | −1.60 × 10⁻⁸ | 158 | −0.30 | 1.87 | Reverse + SS |
| Hetao | 4 | 43d | 78,661 | 3.47 × 10²⁰e | 4.95 × 10¹⁷ | 2.31 × 10⁻⁹ | −4.77 × 10⁻⁹ | 121 | −0.48 | 2.02 | Reverse + SS |
| Weihe | 4 | 33d | 93,765 | 3.31 × 10²⁰e | 4.73 × 10¹⁷ | 3.43 × 10⁻⁹ | −3.82 × 10⁻⁹ | 2 | −0.90 | 2.30 | SS + reverse |
| Shanxi | 4 | 169d | 239,349 | 3.72 × 10²⁰e | 5.31 × 10¹⁷ | 1.68 × 10⁻⁹ | −1.08 × 10⁻⁹ | 136 | −1.56 | 2.57 | SS + normal |
aNegative principal strain rate indicates shortening.
b|$\text{tan}\left(\phi \right) = \frac{\dot{\epsilon }_{2}}{\dot{\epsilon }_{1}}$|
cExpected pattern of faulting depends on exact value of ϕ—see Appendix B.
dIndicates number of GPS stations in Kostrov region used to solve for best-fitting velocity gradients.
eExtrapolated over 700 yr for comparison with the Kostrov summations.
Our Kostrov summations do not differ significantly from the results of Wesnousky et al. (1984). This is to be expected given that the total seismic moment released by the earthquakes in the Wesnousky et al. (1984) catalogue (Ms ≥ 6.5) constitutes between 58 and 97 per cent (depending on the region) of the seismic moment released by the earthquakes in our catalogue (see Table 2). The magnitudes of the maximum and minimum principal strain rates depend heavily on the parameters assigned to the largest earthquake in each region—particularly the 1739 Yinchuan, the 1920 Haiyuan, the 1556 Huaxian, and the 1303 Hongdong events. (The 1303 earthquake was not included in our catalogue as it occurred just over 700 yr ago, but it was used by Wesnousky et al. (1984)).
Furthermore, the largest uncertainty in the Kostrov summations stems from errors on the magnitude estimates for the historical earthquakes. A moment magnitude with a typical error of ±0.3 (Liu et al. 2011) equates to a seismic moment that varies by a factor of 2.8 either way. In other words, the total moment release (Σ M0), the moment release rate (M0 rate), the maximum principal strain rate (|$\dot{\epsilon }_{1}$|) and the minimum principal strain rate (|$\dot{\epsilon }_{2}$|) in Table 2 are all uncertain by up to a factor of ≈3 either way (that is, if the errors are systematic rather than random). In contrast, Wesnousky et al. (1984) suggested typical uncertainties in strike, dip and rake of ±15°, which roughly equate to uncertainties in the azimuths of the maximum and minimum principal strain rates of ±15°. The orientation of the principal strain rates is much better constrained than their magnitude. We also note that our decision to use the same horizontal extents as Wesnousky et al. (1984) means that our strain rates refer to whole regions, parts of which may be deforming very slowly, rather than specific grabens.
The general pattern of strain release is as follows (see Appendix B for the theory associated with interpreting the strain rate results). In northern Ningxia, the deformation appears to be dominated by extension at a strain rate of 3.4 nanostrain a−1 and an azimuth of 131°. This extension could readily be accommodated on the NNE-SSW normal faults in northern Ningxia, particularly on the East Helanshan Fault (see Fig. 2). Meanwhile, Wesnousky et al. (1984) obtained a much larger component of north–south right-lateral strike-slip motion (see Fig. 4a), with the extension occurring at a strain rate of 2.0 nanostrain a−1 and an azimuth of 161°. This difference is also reflected in the ϕ value, which indicates dominant strike-slip faulting with secondary normal faulting for the Wesnousky et al. (1984) summation and dominant normal faulting with secondary strike-slip faulting for our summation. However, 96 per cent of the total moment release is due to the 1739 Yinchuan earthquake, so the result depends very heavily on the parameters used for this event—and we updated the estimate from Wesnousky et al. (1984) on the basis of our own careful field study (Middleton et al. 2016a). We really need a longer catalogue with more large-magnitude events to provide a more accurate summation.
In southern Ningxia, the maximum and minimum principal strain rates are roughly equal in magnitude and opposite in sign, indicating predominantly strike-slip faulting with a small component of contraction. The strain could therefore be taken up on WNW-ESE left-lateral strike-slip faults or NNE-SSW right-lateral strike-slip faults. From the pattern of active faulting, it appears that both types of fault are present: the Haiyuan, Yantongshan and Tianjinshan-Miboshan Faults are all predominantly left-lateral whilst the Luoshan and Niushoushan Faults, which lie approximately at right-angles, are right-lateral (see Fig. 2). In addition, northeast-southwest contraction at a strain rate of 18 nanostrain a−1 and an azimuth of 68° (which corresponds to ≈5 mm a−1 of shortening) is taken up on NNW-SSE striking reverse faults, such as the Liupanshan Fault. The Wesnousky et al. (1984) summation is very similar to our result. Both calculations give ϕ values that suggest dominantly strike-slip faulting with secondary reverse faulting.
North of the Ordos, in the Linhe and Hetao Grabens, the dominant motion is north–south extension at a strain rate of 0.083 nanostrain a−1 and an azimuth of 178°. This motion could be taken up on the Seertengshan, South Wulashan and Daqingshan Faults (see Fig. 2). In addition, there is a small amount of strike-slip motion to be accommodated. This could be achieved by northwest-southeast left-lateral strike-slip faulting on, for example, an extension of the Seertengshan Fault—as occurred in the 1996 Baotou earthquake. Wesnousky et al. (1984) did not have any earthquakes from this region in their catalogue, so we are not able to compare our result with their work. Nonetheless, we note that our seismic strain rate in the northern Ordos is two orders of magnitude smaller than at other margins of the plateau. This difference is much larger than the factor of ≈3 that could arise from errors on the magnitude estimates. Either the strain rate really is much lower in the northern Ordos, or we are missing rare, large-magnitude events from our 700 yr catalogue. For example, the M 7.5 849 earthquake, which would add an additional 2.0 × 10²⁰ Nm to the total moment release—increasing it by more than a factor of 10, has not been included in this summation. Furthermore, palaeoseismological work on the Daqingshan Fault indicates typical recurrence intervals for large earthquakes of more than 2000 yr, so it is plausible that our time window has failed to capture the most important events (Ran et al. 2002, 2003a,b).
In the Weihe Graben, extension occurs at a strain rate of 9 nanostrain a−1 (equivalent to ≈1.8 mm a−1) and an azimuth of 177°, which is consistent with normal-faulting on, for example, the Weihe, North Qinlingshan, Huashan and North Zhongtiaoshan Faults (see Fig. 2). This extension appears to be almost completely biaxial (i.e. matched by vertical thinning rather than any east–west strain). Again, though, 89 per cent of the total moment release is due to the 1556 Huaxian earthquake, so the result depends very heavily on the parameters used for this event. We used recent observations from Zhou (2016) to constrain the focal mechanism for this earthquake, but Wesnousky et al. (1984) used different parameters and obtained a much larger component of strike-slip motion. Again, this difference is reflected in different principal strain rate azimuths (177° compared to 140°) and different ϕ values (3.18 compared to 2.65) for the two summations (see Table 2).
Finally, in the Shanxi Grabens, the predominant motion is strike-slip: either right-lateral strike-slip on faults striking NNE-SSW or left-lateral strike-slip on faults striking WNW-ESE. Given the orientation of faults in the Shanxi Grabens, right-lateral motion is more likely. The Xizhoushan and Huoshan Faults are major right-lateral structures in the Shanxi Grabens, but motion can also be accommodated by oblique slip on the intervening en echelon normal faults (see Fig. 2). There is also good agreement between our summation and the result from Wesnousky et al. (1984); both calculations give ϕ values that suggest dominantly strike-slip faulting with secondary normal faulting.
3.2 Strain rate field from GPS
Fig. 5(a) shows the results of the strain rate calculation for α = 80 km and rmax = 200 km. The results appear to show relatively high strain rates in the interior of the Ordos Plateau. However, these results are due to ‘leakage’ from the deforming margins of the plateau. Figs 5(b)–(d) show that when rmax is reduced, the calculation points in the interior of the plateau do not have enough GPS stations nearby to allow calculation of the velocity gradients and the strain rate. Fig. 6 shows an interpolated map of the second invariant of the geodetic strain rate tensor at each calculation node for α = 80 km and rmax = 200 km. We interpret our GPS-derived strain rate results with the help of the theory outlined in Appendix B. We ignore the interior of the plateau, due to the lack of GPS stations, and instead focus on the pattern of strain release at the margins of the plateau. In most cases, our calculated strain rates are consistent with the velocity differences estimated by Zhao et al. (2017).
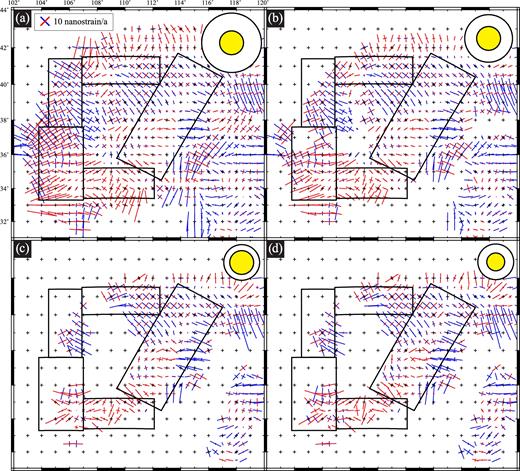
(a) Strain rate field calculated on a regular 0.5° grid from the 348 stations with residuals < 1 mm a−1 (see Fig. 3d). Black boxes indicate Kostrov regions. Crosses indicate orientation and magnitude of maximum and minimum horizontal strain rate; blue indicates extension and red indicates contraction. Yellow circle indicates value of α (radius of circle is 80 km) and white circle indicates value of rmax (radius of circle is 200 km). (b) Same as (a) with α = 80 km and rmax = 160 km. (c) α = 80 km and rmax = 120 km. (d) α = 60 km and rmax = 120 km.
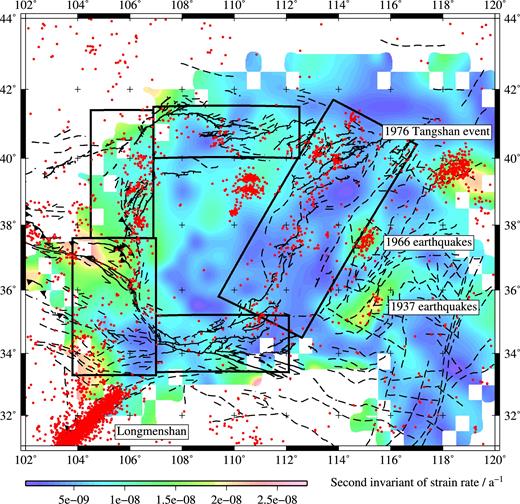
Second invariant |$(\dot{E} = \left(\dot{\epsilon }_{ij}\dot{\epsilon }_{ij}\right)^{\frac{1}{2}})$| of the strain rate field calculated on a regular 0.5° grid with α = 80 km and rmax = 200 km. Black boxes indicate Kostrov regions. Earthquakes of Mw > 2.0 from the International Seismological Centre (ISC) catalogue are shown as red dots (see Data and Resources Section). Faults from Fig. 2 are also shown.
To the north and west of the northern Ningxia region, on the western side of the Ordos Plateau, there is insufficient GPS data for the strain rate to be reliably resolved (see e.g. Fig. 5c). However, in the southern part of the volume, in the Yinchuan Graben, the predominant strain is consistent with either north–south, right-lateral motion or east–west left-lateral motion (see Fig. 5). Given that most faults in the vicinity are oriented north–south, we assume that the predominant strain is north–south right-lateral motion. In a previous paper about the western Ordos we estimated that, in the Yinchuan Graben, this north–south, right-lateral motion occurs at 3.3 ± 0.5 mm a−1, by fitting an arctangent function through the same GPS data (Middleton et al. 2016b). This is consistent with, though slightly larger than, the estimate of 2.1 ± 1.0 mm a−1 from Zhao et al. (2017), who drew their profile at a different azimuth. In the continuous field, the extensional strain rate is typically very slightly larger than the contractional strain rate indicating a small component of normal motion, although the single strain rate tensor suggests the opposite (see Fig. 7). The azimuth of the maximum principal (extensional) strain rate rotates from ≈120° to ≈160° on moving from north to south, but otherwise the pattern of strain is relatively uniform.
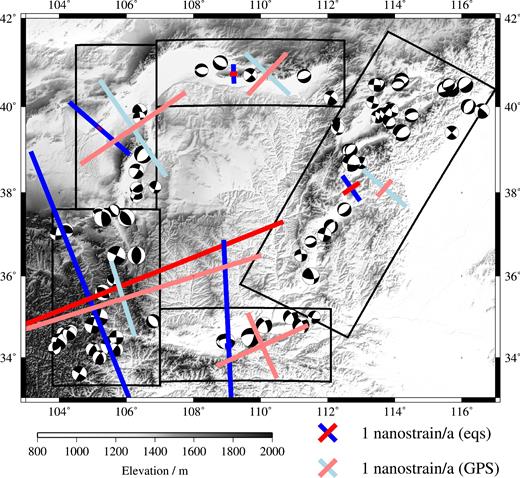
Comparison between Kostrov summations and GPS-derived strain rates. Black boxes indicate Kostrov regions. Brighter coloured crosses indicate orientation and magnitude of maximum and minimum horizontal strain rate from Kostrov summations; paler coloured crosses indicate orientation and magnitude of maximum and minimum horizontal strain rate, calculated from the GPS data within each Kostrov region. Blue indicates extension and red indicates contraction. Note that the scale is exaggerated 10 × for the Kostrov strain rate cross in the Hetao Graben. Inferred focal mechanisms for our catalogue of historical earthquakes around the margins of the Ordos Plateau (see Table 1) are shown in black. The observed mechanisms are consistent with the pattern of faulting expected from the geodetic strain rates in South Ningxia and Shanxi, but not in North Ningxia, Hetao or Weihe (see Table 2).
In the southern Ningxia region the predominant strain is approximately east–west contraction, accompanied by approximately north–south extension (see Fig. 5), implying a combination of reverse and strike-slip faulting. The azimuth of the contraction rotates through the region so as to remain roughly perpendicular to the edge of the Tibetan Plateau. The single strain rate tensor for the whole volume indicates that contraction occurs at 16 nanostrain a−1 and an azimuth of 68°, equivalent to a velocity difference across the region of ≈5 mm a−1 (see Fig. 7). This is slightly larger than the estimate from Zhao et al. (2017) of 3.0 ± 1.1 mm a−1, but in agreement with the estimate of 6.0 ± 2.0 mm a−1 (at an azimuth of 75°) from Zhang et al. (2004).
To the north of the Ordos there is a lack of GPS sites in the Linhe Graben (on the western side of the Kostrov volume) and so the strain rate cannot be reliably resolved there (see e.g. Fig. 5c). In the eastern part of the volume, in the Hetao Graben, the predominant GPS-derived strain is east–west left-lateral motion and the typical azimuth of the maximum principal (extensional) strain rate is 135° (see Fig. 5). The single strain rate tensor for the whole volume indicates that northeast–southwest contraction dominates over strike-slip faulting with shortening occurring at 4.8 nanostrain a−1 and an azimuth of 31° (see Fig. 7). This is equivalent to a shortening velocity of ≈0.9 mm a−1, which is also in agreement with the range of 0.4 ± 1.0 mm a−1 from Zhao et al. (2017). However, the apparent predominance of shortening is somewhat surprising given the clear, geomorphological evidence that the adjacent Daqingshan Fault is a normal fault (Ran et al. 2002, 2003a). It is possible that this discrepancy is due to transient post-seismic signals in the GPS from the M 6.0 1996 Baotou earthquake.
In the Weihe Graben, the GPS-derived strain rate field appears to indicate predominantly contraction in a variety of orientations (see Fig. 5). However, the single strain rate tensor shows north–south extension and east–west contraction, implying predominantly strike-slip faulting on northeast-southwest or northwest-southeast planes (see Fig. 7). It is plausible that such motion could be accommodated on the left-lateral Luonan and Danfeng Faults to the southeast of the Weihe Graben (see Fig. 2). However, Zhao et al. (2017) were not able to determine the deformation occurring in the Weihe Graben from their profile through the GPS data. Meanwhile, our catalogue of focal mechanisms and numerous geomorphological studies indicate that it is normal-faulting that predominates within the graben (Hou et al. 1998; Rao et al. 2015; Li et al. 2015b; Du et al. 2017), suggesting an inconsistency between the geology and the geodetic strain rate tensor (see Fig. 7).
In the Shanxi Grabens, on the eastern side of the Ordos, the pattern of strain varies across the region (see Fig. 5). In the northern Shanxi Grabens, the dominant strain is northwest-southeast extension, with varying amounts of northeast-southwest contraction, whilst in the central and southern Shanxi Grabens the rates of strain are notably smaller (see Fig. 6). The single strain rate tensor for the whole volume indicates that extension occurs at 1.7 nanostrain a−1, equivalent to a velocity difference across the region of ≈0.6 mm a−1 (see Fig. 7). This is consistent with the rates quoted by Zhao et al. (2017), although it obscures local variations in extension rate on moving through the different grabens.
In the North China Plain, there are three distinct patches of higher strain rate (see Fig. 6). These appear to correspond to specific seismic events: a pair of earthquakes in 1937 (M 7.6 and 6.8), the 1966 Xingtai series of earthquakes (including events up to M 7.2) and the Mw 7.8 1976 Tangshan earthquake. It is therefore possible that these high strain rates could be due to continuing aftershock sequences or ongoing post-seismic motion. For example, Stein et al. (2009) indicate that aftershock sequences on the continents, particularly on slowly moving faults, can last for decades or sometimes even centuries after the main shock. However, the high strain rates around the 1937 earthquakes are poorly constrained given the GPS coverage (see Fig. 5d).
4 DISCUSSION
4.1 Seismic moment deficits
Moment deficits and geodetic recurrence times.
| Region | Seismic M0 rate | Geodetic M0 rate | Moment deficita | Mw equivalent | per cent seismic | Recurrence time | Recurrence time |
|---|---|---|---|---|---|---|---|
| (Nm a−1) | (Nm a−1) | (Nm) | (per cent) | (Mw ≥ 7.0)b (years) | (Mw ≥ 6.0)b (years) | ||
| North Ningxia | 4.06 × 10¹⁷ | 9.59 × 10¹⁷ | 3.87 × 10²⁰ | 7.7 | 42 | 224 | 22 |
| South Ningxia | 3.49 × 10¹⁸ | 2.93 × 10¹⁸ | −3.95 × 10²⁰c | −7.7c | 119 | 73 | 7 |
| Hetao | 1.14 × 10¹⁶ | 4.95 × 10¹⁷ | 3.39 × 10²⁰ | 7.7 | 2d | 433 | 43 |
| Weihe | 1.34 × 10¹⁸ | 4.73 × 10¹⁷ | −6.07 × 10²⁰c | −7.8c | 283 | 453 | 45 |
| Shanxi | 5.37 × 10¹⁷ | 5.31 × 10¹⁷ | −4.35 × 10¹⁸c | −6.4c | 101 | 404 | 40 |
aGeodetic Σ M0 minus seismic Σ M0.
bAssuming Mmax = 1 × 10²¹ Nm (≈ Mw 8).
cExcess seismic moment.
d59 per cent when including the 849 Daqingshan earthquake.
Fig. 7 shows our individual geodetic and seismic strain rate tensors for each region side by side. Fig. 8 shows a timeline of the earthquakes occurring in each region alongside plots of the moving average of the logarithm of the seismic moment rate. Dotted green lines show the logarithm of the geodetic moment rate, extrapolated back over the last 700 yr. Although the GPS-derived strain rate fields had much better spatial resolution, the Kostrov summations provide us with much better temporal resolution. Fig. 8 allows us to identify periods of time (within each region) when there is a mismatch between the seismic moment rate and the present-day geodetic moment rate (see Section 4.3 for further discussion).
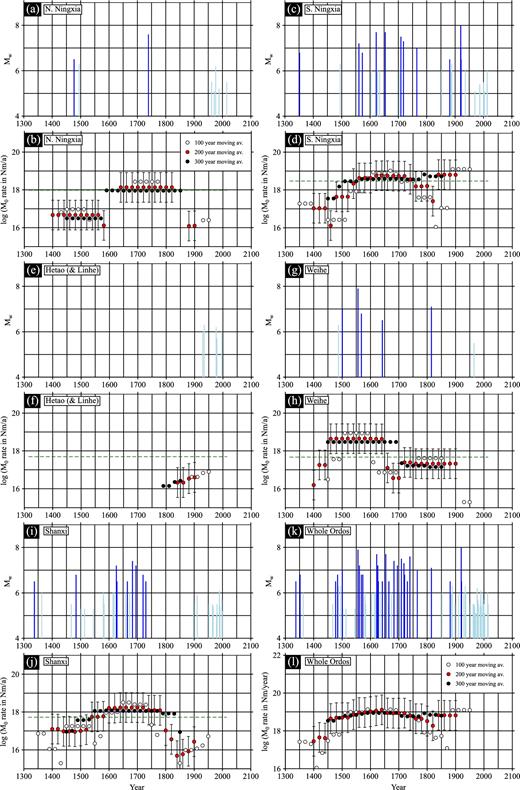
(a) Plot of magnitude (Mw) against time for historical earthquakes with Mw > 5 in northern Ningxia over the last 700 yr. Earthquakes with Mw ≥ 6.0 are shown in darker blue. (b) Moving averages of the log of the seismic moment rate (in Nm a−1) for the last 700 yr, calculated every 20 yr. White dots show 100 yr moving average; red dots show 200 yr moving average; black dots show 300 yr moving average. Error bars, based on the assumption that values of Mw are known to the nearest ± 0.3 magnitude units, are shown for the 200 yr moving average. Dashed green line shows the log of the geodetic M0 rate, extrapolated over the period from 1315 to 2015. (c) and (d) Equivalent plots for southern Ningxia. (e,f) Equivalent plots for the Hetao and Linhe Grabens. (g,h) Equivalent plots for the Weihe Graben. (i,j) Equivalent plots for the Shanxi Grabens. (k,l) Equivalent plots for all margins of the Ordos Plateau. Note different scale in (l).
4.2 Earthquake recurrence times from geodetic strain rates
4.3 Future seismic hazard
In northern Ningxia, our seismic strain rate tensor indicates almost pure extension, whereas the geodetic strain rate tensor indicates largely north–south right-lateral motion (see Fig. 7). However, the geodetic strain rate tensor is more similar, in pattern though not in magnitude, to the result from Wesnousky et al. (1984), so the difference could be attributed to the focal parameters used for the 1739 earthquake or, potentially, a lack of strike-slip events in our earthquake catalogue. 42 per cent of the geodetic moment is accounted for seismically, leaving a suggested moment deficit of 3.87 × 10²⁰ Nm, equivalent to a single Mw 7.7 earthquake (see Table 3). This is in contrast to Wang et al. (2011), who found a seismic moment excess for this region. However, this discrepancy is likely to be because Wang et al. (2011) significantly overestimated the magnitude of the 1739 earthquake (Middleton et al. 2016a). In addition, we calculate an average geodetic recurrence interval for Mw ≥ 7.0 events of 224 yr (and for Mw ≥ 7.7 events of over 1000 yr), so it is likely that even our 700 yr time period is too short to capture a reliable picture of the seismic moment release. Nonetheless, Figs 8(a) and (b) indicate that, although the results in northern Ningxia are completely dominated by the 1739 event, there is a shortfall in the seismic moment release over the last ≈200 yr. This may indicate an increased seismic hazard, but we note that we could still be a few centuries away from the end of the current earthquake cycle.
In southern Ningxia, the magnitude and azimuth of the seismic and geodetic principal strain rates appear to be reasonably consistent (see Fig. 7). That said, the ϕ values show us that the seismic result indicates strike-slip faulting dominating over reverse faulting, whereas the geodetic result indicates reverse faulting dominating over strike-slip faulting. The seismic moment rate exceeds the geodetic moment rate leading to a moment excess of 3.95 × 10²⁰ Nm, which suggests that southern Ningxia is not likely to be a region of high seismic hazard in the near future. This can also be seen in Fig. 8(d). Wang et al. (2011) did not perform a calculation for the same region, but they found seismic moment excesses on their neighbouring seismic belts.
In the Linhe and Hetao Grabens, there is a large discrepancy between the seismic and geodetic strain rate tensors; the seismic strain rate tensor is nearly two orders of magnitude smaller and rotated by ≈45° (see Fig. 7). Only 2 per cent of the geodetic moment is accounted for seismically, leaving a suggested moment deficit of 3.39 × 10²⁰ Nm, equivalent to a single Mw 7.7 earthquake (see Table 3). The lack of seismic activity can also be clearly seen in Figs 8(e) and (f). Similarly, Wang et al. (2011) identified a seismic moment deficit for the same region, although their deficit was only 2 × 10¹⁸ Nm for the last 100 yr. Extrapolated over 700 yr, this is still an order of magnitude smaller than our deficit. This difference arises because Wang et al. (2011) estimate a seismic moment release of 2.1 × 10¹⁹ Nm for the last 100 yr, whereas we find a much smaller seismic moment release of 7.95 × 10¹⁸ Nm for the whole 700 yr period. However, as discussed in Section 3.1, some of the moment deficit could be accounted for by the M 7.5 849 Daqingshan earthquake. We calculate that the recurrence interval for Mw ≥ 7.0 events is 433 yr, and for Mw ≥ 7.5 events is ≈1400 yr, which is not dissimilar to the ≈2000 yr indicated by palaeoseismology. This leads us to conclude that our earthquake catalogue is missing infrequent but large-magnitude events on this boundary of the plateau, suggesting relatively high levels of seismic hazard over the next few hundred years.
In the Weihe Graben, the seismic moment rate exceeds the geodetic moment rate leading to an apparent moment excess of 6.07 × 10²⁰ Nm, which would suggest that the Weihe Graben is not likely to be a region of high seismic hazard in the near future. However, as noted above, the catalogue in this region is entirely dominated by the 1556 event, and Fig. 8(h) in fact shows that the seismic moment rate has dropped below the geodetic moment rate since around 1650 (though this is within the typical error on the magnitudes of the historical earthquakes). Much like northern Ningxia and the Linhe and Hetao Grabens, it appears that the majority of strain release occurs in infrequent, large-magnitude events–only in the Weihe Graben we are earlier in the seismic cycle.
Finally, Fig. 7 shows good agreement between the seismic and geodetic strain rate tensors in the Shanxi Grabens, though both of these tensors average across the region and obscure the variations within the Kostrov volume (see Section 3.2). The ϕ values show us that both the seismic and geodetic results indicate strike-slip faulting dominating over normal faulting. 101 per cent of the geodetic moment is accounted for seismically, resulting in a small moment excess of 4.35 × 10¹⁸ Nm (see Table 3). Wang et al. (2011) suggested a moment excess for Shanxi, but they combined the Shanxi Grabens with the Weihe Graben in their calculation. However, Fig. 8(j) clearly indicates that there is a lack of recent earthquakes in the Shanxi Grabens. Until around 1750, there is very good agreement between the seismic and geodetic moment rates, and then by 1800 there is a notable seismic strain rate deficit that goes well beyond the error bars due to the uncertainties on the magnitude estimates. Again, this is likely to indicate relatively high levels of seismic hazard in the future. Our estimated geodetic recurrence interval for Mw ≥ 7.0 earthquakes is more than 400 yr, so it is perfectly plausible that an event of this size could happen in the next few centuries. In a previous paper, we found a very similar result when we focussed on just the northern Shanxi Grabens (Middleton et al. 2017).
Lastly, we note that all of our seismic moment deficits should be treated with caution; in many cases our earthquake catalogue spans a time period that is similar to, or sometimes even shorter than, the likely recurrence interval for the largest earthquakes that occur. It is also possible that our moment deficits could be accommodated by fault creep, as is known to be occurring, for example, on the Haiyuan Fault (Jolivet et al. 2012). However, we are not aware of any field evidence to suggest that such aseismic motion is occurring on any of the major faults that bound the Ordos. Furthermore, Xu & Deng (1996), Li et al. (2009), Liu et al. (2011) and Liu & Wang (2012) have suggested, on the basis of palaeoseismology and earthquake records, that earthquakes in northern China might cluster in time and space, with moment release switching between different fault networks over time. Fig. 8(k) appears to attest to such temporal clustering; similarly, Figs 8(h) and (j), for the Weihe and Shanxi Grabens, show rates of seismic moment release that oscillate either side of the projected geodetic moment rate for the last 700 yr. The precise cause of this switching behaviour is unclear, but it could contribute to the present-day moment deficits that we observe. It may also indicate that moment deficits will be accommodated by clusters of smaller earthquakes rather than single large events.
5 CONCLUSIONS
In this study we have performed Kostrov summations for the earthquakes occurring at the margins of the Ordos Plateau over the last 700 yr and compared our results to strain rates derived from the latest campaign GPS measurements. We found notable seismic strain rate deficits in northern Ningxia (especially over the last ≈200 yr), and in the Hetao and Linhe Grabens (over all of the last 700 yr). In the Weihe and Shanxi Grabens, although we found seismic strain rate excesses over the whole of the last 700 yr, we also noted recent deficits over the last ≈365 yr and ≈265 yr, respectively. These deficits indicate enhanced potential for large earthquakes in these regions in the future. In southern Ningxia we found a seismic strain rate excess and no present-day mismatch between seismic and geodetic strain release, indicating a likely lower level of seismic hazard in this region.
6 DATA AND RESOURCES
The GCMT project database was searched using: www.globalcmt.org/CMTsearch.html (last accessed on 8th August 2013).
The International Seismological Centre (ISC) database was searched using: http://www.isc.ac.uk/iscbulletin/search/bulletin/ (last accessed on 15th March 2016).
Most of the figures in this paper were made using the Generic Mapping Tools (Wessel et al. 2013). All other data used in this paper came from published sources listed in the references.
Acknowledgements
This research has been supported by the Natural Environment Research Council (NERC) through a studentship awarded to TAM, the Centre for Observation and Modelling of Earthquakes, Volcanoes and Tectonics (COMET, GA/13/M/031), the Looking inside the Continents from Space (LiCS) large grant (NE/K011006/1), and the NERC/ESRC Earthquakes without Frontiers (EwF) consortium (EwF_NE/J02001X/1_1). We are grateful to: Philip England, John Elliott and Yu Zhou for a number of very useful conversations; and Peizhen Zhang and our colleagues at the China Earthquake Administration (CEA) for their ongoing support. We also wish to thank Philippe Vernant and an anonymous reviewer for their helpful comments on the manuscript.
REFERENCES
APPENDIX A: KOSTROV SUMMATIONS
APPENDIX B: EXPECTED PATTERN OF FAULTING FROM STRAIN RATES
Fig. B1 illustrates qualitatively how to interpret our strain rate fields. For a more quantitative analysis we followed a similar approach to Houseman & England (1986) and Gordon & Houseman (2015). Considering the horizontal components of the diagonalized strain rate tensor (|$\dot{\epsilon }_{1}$| and |$\dot{\epsilon }_{2}$|), we assumed that |$\dot{\epsilon }_{1}$| is the greater (more positive) principal strain rate. We then defined the angle ϕ according to:
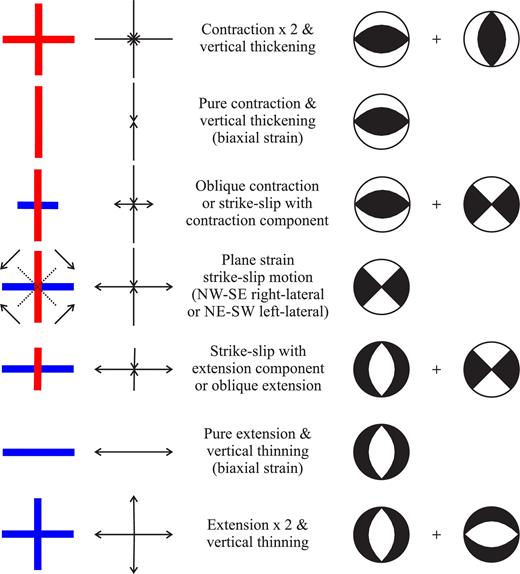
Examples of strain rate crosses to show how they illustrate different patterns of strain. Red bars indicate contractional principal strain rates; blue bars indicate extensional principal strain rates (only horizontal components are shown). Focal mechanisms indicate patterns of faulting that could accommodate the given strain rates. Note that for the strike-slip mechanisms there is an ambiguity between right-lateral motion on northwest-southeast fault planes and left-lateral motion on northeast-southwest fault planes; for the dip-slip mechanisms either nodal plane could be the fault plane.
We considered ϕ in the range |$\frac{\pi }{4}$| to |$\frac{5\pi }{4}$| (see Figs B2 and B3). If |$\dot{\epsilon }_{1}$| and |$\dot{\epsilon }_{2}$| are of the same sign, then the strain is taken up on two sets of dip-slip faults. When |$\frac{\pi }{4}<\phi <\frac{\pi }{2}$| we know that |$\frac{\dot{\epsilon }_{2}}{\dot{\epsilon }_{1}}>1$|, which can only be true if both |$\dot{\epsilon }_{1}$| and |$\dot{\epsilon }_{2}$| are negative. We therefore have contraction occurring in two orthogonal horizontal directions and we expect reverse faults in two orientations. When |$\pi <\phi <\frac{5\pi }{4}$| we know that |$0<\frac{\dot{\epsilon }_{2}}{\dot{\epsilon }_{1}}<1$|, which can only be true if both |$\dot{\epsilon }_{1}$| and |$\dot{\epsilon }_{2}$| are positive. We therefore have extension occurring in two orthogonal horizontal directions and we expect normal faults in two orientations.
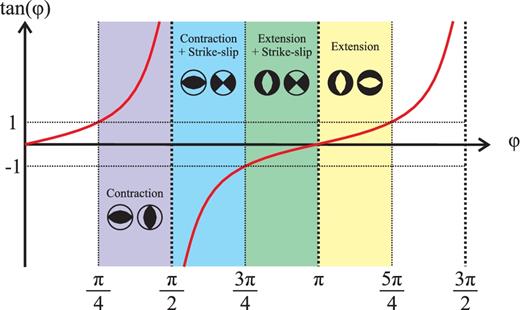
Plot of tan(ϕ) against ϕ, where |$\text{tan}\left(\phi \right) = \frac{\dot{\epsilon }_{2}}{\dot{\epsilon }_{1}}$| (red curve). Coloured zones and focal mechanisms indicate the expected styles of faulting in each ϕ range.
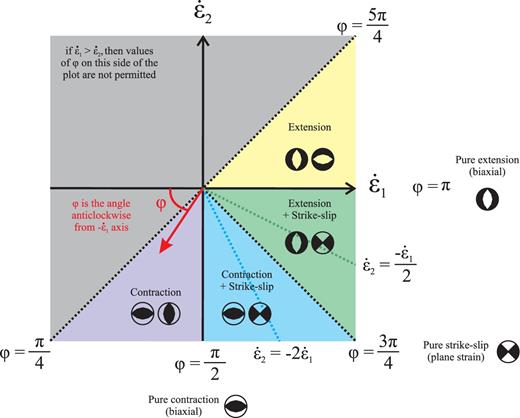
Phasor diagram in |$\dot{\epsilon }_{2}$| against |$\dot{\epsilon }_{1}$| space. Again, coloured zones and focal mechanisms indicate the expected styles of faulting in each ϕ range.
If |$\dot{\epsilon }_{1}$| and |$\dot{\epsilon }_{2}$| are of opposite signs, then the strain is taken up by a combination of dip-slip and strike-slip faulting. When |$\frac{\pi }{2}<\phi <\frac{3\pi }{4}$| we know that |$\frac{\dot{\epsilon }_{2}}{\dot{\epsilon }_{1}}<-1$|, which can only be true if |$\dot{\epsilon }_{1}$| is positive and |$\dot{\epsilon }_{2}$| is negative. Furthermore, |$|\dot{\epsilon }_{2}|>|\dot{\epsilon }_{1}|$|. We therefore expect a combination of contraction and strike-slip faulting. The relative importance of dip-slip versus strike-slip faulting can be determined from the exact value of ϕ. Reverse faulting dominates when |$\dot{\epsilon }_{2}<-2\dot{\epsilon }_{1}$|, that is ϕ < (π − tan−1(2)); and strike-slip faulting dominates when |$\dot{\epsilon }_{2}>-2\dot{\epsilon }_{1}$|, that is ϕ > (π − tan−1(2))). When |$\dot{\epsilon }_{2} = -2\dot{\epsilon }_{1}$|, that is ϕ = (π − tan−1(2)), the strain is accommodated by 50 per cent reverse faulting and 50 per cent strike-slip faulting.
Similarly, when |$\frac{3\pi }{4}<\phi <\pi$| we know that |$-1<\frac{\dot{\epsilon }_{2}}{\dot{\epsilon }_{1}}<0$|, which can only be true if |$\dot{\epsilon }_{1}$| is positive and |$\dot{\epsilon }_{2}$| is negative. Furthermore, |$|\dot{\epsilon }_{1}|>|\dot{\epsilon }_{2}|$|. We therefore expect a combination of extension and strike-slip faulting. Normal faulting dominates when |$\dot{\epsilon }_{2}>\frac{-\dot{\epsilon }_{1}}{2}$|, that is |$\phi >(\pi -\text{tan}^{-1}(\frac{1}{2}))$|; and strike-slip faulting dominates when |$\dot{\epsilon }_{2}<\frac{-\dot{\epsilon }_{1}}{2}$|, that is |$\phi <(\pi -\text{tan}^{-1}(\frac{1}{2}))$|. When |$\dot{\epsilon }_{2} = \frac{-\dot{\epsilon }_{1}}{2}$|, that is |$\phi = (\pi -\text{tan}^{-1}(\frac{1}{2}))$|, the strain is accommodated by 50 per cent normal faulting and 50 per cent strike-slip faulting.
APPENDIX C: STRAIN RATE FIELD FROM GPS
We calculated a smoothly varying strain rate field from the GPS data according to the method of Shen et al. (1996) and Floyd et al. (2010). We assumed uniform gradients in the components of horizontal velocity. The method below describes how to calculate the strain rate tensor at an individual point within the region of interest. The same method can be applied whether the calculation points used are the GPS sites themselves or the nodes of a regular grid.
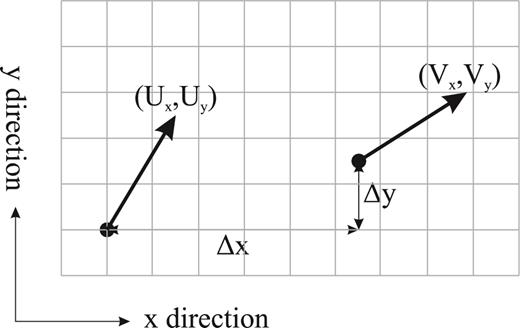
Ux and Uy are the x (easterly) and y (northerly) components of velocity at the calculation point under consideration. Vx and Vy are the x and y components of velocity at the GPS measurement site. Δx and Δy are the x and y distances from the calculation point to the GPS measurement site, assuming a spherical Earth.
