


Summary
Previous research revealed a dynamically triggered earthquake front propagating along Southwest Japan, in correlation with the arrival of surface waves from the 2011 M9.0 Tohoku-oki earthquake. However, some characteristics of the dynamically initiated seismic activation have not been investigated in detail. We analyse first the dynamic triggering process, using NIED waveform data. Our results suggest that at several triggering sites in SW Japan, including volcanic areas in Kyushu, the arrival of larger amplitude Love waves may correlate better with the occurrence of first locally triggered events compared to the Rayleigh wave arrivals. We also observe that triggering takes place during relatively long-period surface waves. We search for other cases of dynamic triggering in SW Japan by remote large earthquakes and show that the distinctive phase arrivals of both Love and Rayleigh waves from the 2008 M7.9 Wenchuan earthquake triggered local events in Kyushu. These observations suggest that sharing motion on well-lubricated local faults may have started failure in these areas. Based on the analysis of an extended earthquake catalogue, we find that the stacked seismicity for the dynamically triggered regions in SW Japan after the 2011 Tohoku-oki earthquake has a significant, albeit weak increase after the megathrust event, followed by a relatively slow decay towards the background level for the next several days. The relatively slow decay may reflect the temporal pattern of stacked, swarm-like clustered seismicity, which has been mainly activated at volcanic/geothermal areas in Kyushu. The decay of seismicity within a single, activated earthquake cluster may have, however, different characteristics. The analysis of the aftershocks initiated dynamically at the Yufuin-Beppu geothermal area (Kyushu), by the 2016 M7.3 Kumamoto earthquake, shows a fast decay that may reflect quick stress recovery near higher-temperature volcanic or geothermal regions.
1 INTRODUCTION
The dynamic triggering of seismicity at remote locations by the passage of surface waves from large earthquakes is a well-documented phenomenon, with many such cases reported and analysed worldwide (e.g. Hill et al. 1993; Brodsky et al. 2000; see Hill & Prejean 2015, for a recent review). Somewhat surprisingly, remote activation of earthquakes in Japan is relatively scarce (Harrington & Brodsky 2006), despite high-levels of seismicity associated with active faulting and volcanism. There are, however, two notable cases of widespread remote dynamic triggering in Japan, after the occurrence of the 2011 M9.0 Tohoku-oki earthquake (e.g. Miyazawa 2011; Yukutake et al. 2011) and the 2016 M7.3 Kumamoto earthquake (e.g. Enescu et al. 2016; Miyazawa 2016). In both cases, seismicity activation has been observed predominantly at volcanoes, although there were cases of triggered events associated with active faults.
The physical mechanisms responsible for the remote activation of seismicity are still poorly understood. Two main classes of models (Hill & Prejean 2015) have been proposed to explain the triggering by dynamic stresses: (1) direct triggering by frictional failure and (2) triggering through excitation of crustal fluids. As documented in previous studies (e.g. Aiken & Peng 2014), fluids are active agents in volcanic and geothermal areas, which may explain the more vigorous and widespread triggering in such regions.
Miyazawa (2011) reported an earthquake triggering front, propagating at about the same speed as the Rayleigh waves (of 10–20 s period), from the 2011 Tohoku-oki earthquake; the furthest seismic activation has been observed in southern Kyushu, at the Ibusuki volcanic area, at about 1350 km epicentral distance. Yukutake et al. (2011, 2013) studied in detail the triggering around Hakone volcano by the passage of the surface waves from the Tohoku-oki earthquake, using a local seismic network, and revealed details of the triggering process. As discussed by Yukutake et al. (2013), the initiation of seismicity activation is likely dynamic, however the static stress changes may have also played a significant role (Yukutake et al., 2011, 2013; Enescu et al. 2012). Similarly, Kato et al. (2013) analysed the triggering by both static and dynamic stress changes in Hida region and Shimojo et al. (2014) showed that the seismicity increases in Northern Nagano region, immediately after the Tohoku-oki earthquake, was likely initiated dynamically. As shown in all these studies, aseismic transients (fluids or slow-slip) may have contributed significantly to the triggering process. Indeed, the triggered sequences at or close to geothermal and volcanic areas show migration and other swarm-like characteristics, which are the signature of possible aseismic transients (e.g. Kumazawa & Ogata 2013; Kosuga 2014; Shimojo et al. 2014).
Another widespread remote triggering in Japan followed the 2016 M7.3 Kumamoto earthquake, when small events have been triggered as far as Hokkaido (at an epicentral distance of about 1650 km), by the passage of the main shock surface waves; the strong directivity effect and an increased trigger-ability after the 2011 Tohoku-oki earthquake where hypothesized as probable causes of widespread activation (Enescu et al. 2016). It is remarkable that the M7.3 main shock triggered dynamically a relatively large event (of M5.9) in the Yufuin-Beppu geothermal region, Kyushu (e.g. Miyazawa 2016; Uchide et al. 2016); the Tohoku-oki earthquake triggered seismicity in this region as well (Miyazawa 2011).
Here we revisit the remote triggering in SW Japan by the 2011 M9.0 Tohoku-oki earthquake, focusing on two issues of importance for seismic hazard that have not been addressed previously. First, we investigate the correlation between the occurrence of early post-Tohoku-oki events and the passage of both Rayleigh and Love waves from the main shock. To get a better physical insight of the triggering mechanisms we search for previous triggering in Kyushu, by other large remote earthquakes occurred worldwide after 2005. Second, based on an improved earthquake dataset, we analyse the pre- and post-Tohoku-oki seismicity pattern in all triggered regions, and discuss the temporal extent and decay characteristics of stacked and individual earthquake sequences activated in SW Japan. Since one of the geothermal areas in Kyushu, activated after the 2011 megathrust earthquake, has been also dynamically triggered following the 2016 M7.3 Kumamoto earthquake, we compare the decay of ‘normal’ aftershocks, triggered by the static stress changes due to the Kumamoto main shock rupture, with that of dynamically initiated seismicity at the geothermal area.
2 DATA AND METHOD
We use the earthquake catalogue data of the Japan Meteorological Agency (JMA) as well as the Hi-net (high-sensitivity) and F-net (broadband) waveform data provided by the National Research Institute of Earth Science and Disaster Resilience (NIED).
To detect locally triggered events, we use a two-way Butterworth bandpass filter in the frequency range of 10–30 Hz. As we have experimented before (e.g. Shimojo et al. 2014), such a filtering ensures good detection of remotely triggered events, while avoiding at least in part the high-frequency noise. In most cases, the remote detections were confirmed and the earthquakes were localized by identifying the P- and S-wave arrival times of the triggered events. To correlate the observed remote triggering with the passage of surface waves from the main shocks, we have used Hi-net and F-net data in the frequency range of 0.01–0.2 Hz (5–100 s). In this respect, the Hi-net data were processed using the approach of Maeda et al. (2011), who showed that the Hi-net waveforms can be successfully used to retrieve long-period ground motions after applying an appropriately designed recursive filter.
For the analysis of the earthquake catalogue data, we determine the magnitude of completeness (Mc) by using the entire magnitude range (EMR) method (Woessner & Wiemer 2005). Determination of b-values (of the frequency–magnitude distribution) or of the Modified-Omori law parameters are performed for M ≥ Mc. The b-value is estimated using a Maximum Likelihood approach (MLM) (Aki 1965). The parameters of the Modified Omori law, n(t) = K/(t + c)p—where n(t) is the frequency of aftershocks per unit tine, at the time t from the main shock and p, c and K are constants—are determined by maximizing the logarithm of the likelihood function (Ogata 1983). Standard errors of parameters are obtained from the inverse of the Hessian matrix of the likelihood function (Ogata 1983).
3 DYNAMIC TRIGGERING CHARACTERISTICS IN SW JAPAN
3.1 Immediate activation of seismicity after the Mw 9.0 Tohoku-oki earthquake
We have first created a catalogue of earthquakes occurring in SW Japan in the first ∼30 min after the 2011 M9.0 Tohoku-oki earthquake, which is used throughout this study. All the earthquakes detected on the high-frequency seismograms and located afterwards are listed in Table 1. The earthquake were located by using the HYPOMH program (Hirata & Matsu’ura 1987) and the same 1-D velocity model used by the JMA. Fig. 1 presents the spatial distribution of the detected and localized earthquakes. Note that most of these events are not recorded in the JMA catalogue since in the aftermath of the 2011 Tohoku-oki earthquake the large amplitude surface waves obscured many small earthquakes and, in addition, JMA was overwhelmed with the detection and location of thousands of events occurring off-shore Tohoku region. Miyazawa (2011) discussed already the migration of an earthquake front in SW Japan and the triggered areas that he identified are similar with ours. This section discusses some characteristics of Love and Rayleigh waves at the triggering sites, which have not been previously addressed.
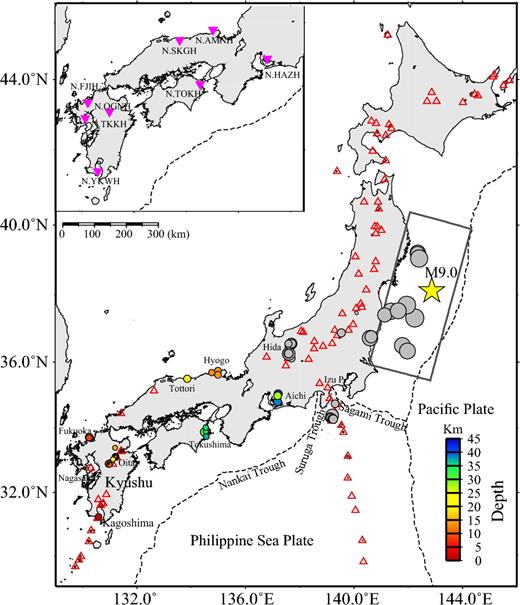
Map showing the distribution of seismic activity in Japan for the first 30 min after the Mw 9.0 Tohoku-oki earthquake (2011/03/11 14:46:18.12 JST). The main shock is shown by yellow star, JMA-catalogued events are shown by grey circles, while coloured circles represent manually detected epicentres, coloured as a function of depth. Volcanos are plotted as red triangles. Inset shows the NIED Hi-net stations (inverted purple triangles) used in Fig. 2. The areas of seismicity activation that are discussed in this study are Aichi, Hyogo, Tottori, Tokushima, Oita, Fukuoka, Nagasaki and Kagoshima, named after the prefectures where they belong. The area labelled ‘Oita’ contains the Yufuin-Beppu and Aso volcanic subareas (which are mentioned in the text). The Aichi and Tokushima regions correspond to a subduction environment, dominated by reverse faulting, while all the other inland areas are located in a strike-slip environment. The Oita and Kagoshima regions are well-known for their volcanic/geothermal activity.
Catalogue of early triggered events in SW Japan, after the 2011 M9.0 Tohoku-oki earthquake.
| Number | Hour | Minute | Second | Latitude | Longitude | Depth (km) | Magnitude | Area |
|---|---|---|---|---|---|---|---|---|
| 1 | 14 | 51 | 51.09 | 34.804 | 137.173 | 38.49 | 3.0 | Aichi |
| 2 | 14 | 53 | 26.73 | 35.040 | 137.194 | 40.97 | 3.1 | Aichi |
| 3 | 14 | 55 | 5.17 | 34.981 | 137.182 | 27.67 | 2.9 | Aichi |
| 4 | 14 | 51 | 0.64 | 35.741 | 134.981 | 13.99 | 2.6 | Hyogo |
| 5 | 14 | 52 | 26.51 | 35.683 | 134.751 | 13.54 | 2.3 | Hyogo |
| 6 | 14 | 55 | 29.45 | 35.736 | 134.982 | 13.52 | 2.5 | Hyogo |
| 7 | 14 | 51 | 38.21 | 33.873 | 134.474 | 31.43 | 3.1 | Tokushima |
| 8 | 14 | 54 | 55.40 | 33.890 | 134.532 | 33.78 | 1.8 | Tokushima |
| 9 | 14 | 55 | 11.41 | 34.011 | 134.531 | 35.16 | 2.0 | Tokushima |
| 10 | 14 | 55 | 30.30 | 33.734 | 134.547 | 36.86 | 2.2 | Tokushima |
| 11 | 14 | 52 | 36.39 | 33.123 | 131.233 | 8.20 | 2.7 | Kyushu |
| 12 | 14 | 53 | 28.90 | 31.234 | 130.573 | 1.62 | 2.4 | Kyushu |
| 13 | 14 | 54 | 26.89 | 33.113 | 131.203 | 7.10 | 2.6 | Kyushu |
| 14 | 14 | 56 | 33.17 | 33.107 | 131.208 | 9.76 | 1.7 | Kyushu |
| 15 | 14 | 57 | 20.27 | 33.702 | 130.226 | 8.57 | 2.4 | Kyushu |
| 16 | 14 | 58 | 6.63 | 33.106 | 131.185 | 4.50 | 1.3 | Kyushu |
| 17 | 14 | 59 | 11.21 | 32.756 | 130.068 | 0.38 | 1.2 | Kyushu |
| 18 | 14 | 59 | 51.69 | 33.298 | 131.435 | 1.51 | 1.1 | Kyushu |
| 19 | 15 | 1 | 24.82 | 33.269 | 131.402 | 3.79 | 0.9 | Kyushu |
| 20 | 15 | 3 | 27.19 | 32.949 | 130.993 | 1.32 | 0.8 | Kyushu |
| 21 | 15 | 5 | 5.23 | 33.302 | 131.429 | 1.60 | 0.8 | Kyushu |
| 22 | 15 | 5 | 32.63 | 33.298 | 131.441 | 1.49 | 0.8 | Kyushu |
| 23 | 15 | 13 | 42.08 | 32.891 | 130.950 | 8.71 | 1.9 | Kyushu |
| 24 | 15 | 13 | 42.95 | 32.924 | 131.004 | 16.61 | 1.8 | Kyushu |
| 25 | 15 | 14 | 18.14 | 32.979 | 131.052 | 22.18 | 1.4 | Kyushu |
| 26 | 15 | 14 | 20.75 | 33.297 | 131.434 | 1.48 | 1.2 | Kyushu |
| 27 | 15 | 14 | 31.10 | 32.893 | 130.949 | 9.67 | 2.5 | Kyushu |
| 28 | 15 | 14 | 32.82 | 32.926 | 131.006 | 22.24 | 2.3 | Kyushu |
| 30 | 15 | 15 | 11.96 | 32.892 | 130.951 | 9.25 | 2.5 | Kyushu |
| 31 | 15 | 16 | 28.06 | 33.293 | 131.492 | 0.95 | 0.9 | Kyushu |
| 32 | 15 | 17 | 3.55 | 32.865 | 130.970 | 10.86 | 2.0 | Kyushu |
| 33 | 15 | 17 | 6.63 | 33.034 | 131.111 | 20.95 | 1.8 | Kyushu |
| 34 | 15 | 17 | 27.08 | 32.898 | 130.947 | 9.29 | 0.6 | Kyushu |
| 35 | 15 | 17 | 44.51 | 32.886 | 130.938 | 6.79 | 0.5 | Kyushu |
| 36 | 15 | 19 | 12.22 | 33.385 | 131.188 | 15.20 | 1.9 | Kyushu |
| 37 | 14 | 55 | 32.34 | 35.496 | 133.843 | 24.45 | 2.7 | Tottori |
The table is listing the origin time (hour, minute second) for the earthquakes detected at the areas in SW Japan shown in Fig. 1, on 2011 March 11, after the occurrence time of the Tohoku-oki megathrust (2011 March 11; 14:46:18), as well as their location (latitude, longitude and depth), magnitude and geographic area.
We have not included in our investigation the vigorous activation of seismicity at Hida Mountain (Kato et al. 2013) and around Izu Peninsula (Toda et al. 2011; Enescu et al. 2012), including Hakone volcano area (Yukutake et al., 2011, 2013): these cases have been analysed in detail before and both static and dynamic stress changes from the 2011 Tohoku-oki earthquake have been shown to play a triggering role.
The areas of activation shown in Fig. 1 are in Aichi and Tokushima, at depths around 30–45 km, the area in Hyogo and Tottori, at depths of around 15–25 km and finally the relatively shallow (0–15 km depth) triggering at several locations in Kyushu Islands (in Nagasaki, Fukuoka, Oita and Kagoshima prefectures). The triggered earthquakes in Aichi and Tokushima occur at the subduction of Philippine Sea Plate under the Japanese Islands, very close to the subduction interface (e.g. Hirose et al. 2008). The shallower triggered events in Hyogo, Tottori and Fukuoka are associated with a strike-slip environment (e.g. Terakawa & Matsu’ura 2010; Toda & Enescu 2011). Finally, the events in Nagasaki, Oita and Kagoshima occur in volcanic/geo-thermal areas, in a preponderantly extensional tectonic regime. All these areas are located at relatively large distances from the Tohoku-oki earthquake (Fig. 1), thus making the initiation of seismicity activation by static stress changes from the megathrust event unlikely (Miyazawa 2011; Toda et al. 2011). We have verified our assumption by calculating Coulomb static stress changes using the model of Suzuki et al. (2011) as source (i.e. the Tohoku-oki rupture model) and nodal planes of F-net (NIED) CMT focal mechanisms (1997–present; earthquakes of M ≥ 3.0), selected in all the areas discussed above, as receivers (considered representative for the local faulting structures). We used an apparent coefficient of friction of 0.4, but variations within 0.2–0.8 range produced equivalent results. The estimated stresses are all on the order of 0.01 MPa or less; note that a value of ∼0.01 MPa is considered as an effective stress triggering threshold of seismic events (e.g. Stein 1999). The largest dynamic stresses in all investigated areas were at least one order of magnitude larger (e.g. Miyazawa 2011). In Kyushu, where most significant remote activation has been observed (as explained later in the paper), the static stresses were below 1 kPa. We therefore conclude that the role of static stress transfer from the M9.0 Tohoku-oki megathrust to trigger seismicity in the areas discussed in this paper is not significant.
We look at the characteristics of immediate triggering by showing in Fig. 2 the high-frequency (10–30 Hz) vertical component velocity seismograms together with the low-pass filtered (5–100 s) displacements on the vertical, radial and transverse components at Hi-net stations, for four of the triggered regions (Fig. 1). It is clear from Fig. 2 that the first events triggered in each region (see also Table 1) correlate well with the passage of both the Love and Rayleigh wave trains from the main shock. We also observe that the Love wave displacement amplitudes (as seen on transverse components) are significantly larger than the amplitudes of Rayleigh waves (as seen on vertical and radial components). Moreover, the triggering in Hyogo, Oita and Kagoshima regions (Figs 2b–d) occurs at the peak of Love wave arrival or close to it (same could be seen for the Tokushima region (not shown)).

Remote earthquake triggering in SW Japan correlated with the arrival of surface waves from Mw 9.0 Tohoku-oki main shock. High-frequency (10–30 Hz) vertical velocity seismograms from NIED Hi-net stations are shown at the top of each plot, followed by low-frequency (0.01–0.1 Hz) vertical, radial and transverse displacement components seismograms, respectively. Time (s) is considered relative to the Tohoku-oki main shock; (a) triggering in Aichi area, shown at HAZH station; (b) same as in (a), but for Hyogo area at AMNH station; (c) for Oita area (more precisely, close to Kuju and Aso volcanoes), at the OGNH station; and (d) for Kagoshima area, shown at YKWH station; the grey arrows show the time-interval used for plotting the velocity spectra in Fig. 3(a). The numbers indicate manually detected events (listed in Table 1).
For example, the triggering in Kagoshima (Fig. 2d) occurs during the passage of Love waves with displacement amplitudes as high as 12.4 cm, while the Rayleigh waves are significantly smaller (∼5.4 cm, as seen on the vertical component displacement seismogram). Note that both the low- and high-frequency waveforms are shifted at the occurrence time and location of the first triggered event in each region, by considering average Love, Rayleigh and P-wave phase velocities of 4.1, 3.9 and 6.5 km s–1, respectively. We have checked and found that variations around these values do not influence the results significantly (since the triggered events occurred close to the corresponding Hi-net station).
While dynamic triggering by Love waves (shearing motion) at active faults is not a surprising result, volcanic regions in Kyushu are expected to more likely respond to excitation by compressional, Rayleigh-wave type motion, if fluids are involved. Unfortunately, the estimation of dynamic stresses considering not only the amplitude of shaking (e.g. the displacement amplitudes at the triggering sites), but also the source–receiver geometry (e.g. Gonzalez-Huizar & Velasco 2011), is very challenging since the earthquakes triggered dynamically by the 2011 Tohoku-oki earthquake are small and thus their focal mechanism cannot be determined. In addition, the focal mechanisms of the triggered events by the megathrust earthquake are many times ‘atypical’ (e.g. Toda et al. 2011) and using focal mechanisms of past events as a proxy to calculate dynamic stress changes may provide biased results. Nevertheless, we will show in Section 3.2 that Love waves from another large remote earthquake triggered small events in Kyushu, in two distinct volcanic/geothermal areas, allowing us to suggest a model for the remote triggering.
We note that at least for some cases (Figs 2c and d) the dynamic triggering is observed during the passage of surface waves with relatively long periods (20–50 s), as exemplified in Fig. 3(a) for the Ibusuki area, at YKWH station. These relatively long periods are confirmed using also broadband F-net data. Surface waves of 10–25 s period are usually reported as most efficient at dynamically triggering earthquakes (e.g. Brodsky & Prejean 2005; Enescu et al. 2016; see also discussion at Sections 3.2 and 3.3).
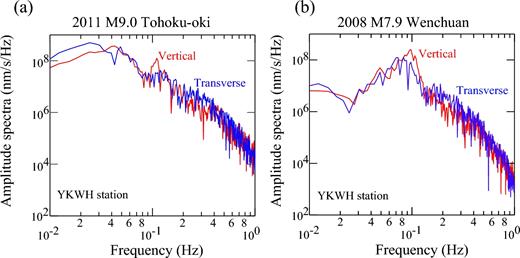
Velocity spectra of surface waves at station YKWH. For a time-interval of 200 s from the arrival of surface wave trains at the station, we plot the amplitude spectra (nm s–1 Hz) versus frequency, using the filtered velocity seismograms (0.01–1 Hz) for the vertical (red) and transversal (blue) components. (a) For the 200-s surface wave train (see Fig. 2d) of the 2011 Tohoku-oki earthquake; (b) for the 200-s surface wave train (see Fig. 4c) after the 2008 Wenchuan earthquake.
3.2 Evidence of dynamic triggering in Kyushu by both Love and Rayleigh waves from the 2008 Mw 7.9 Wenchuan earthquake
The results presented in the previous section show the possibility that the large-amplitude Love waves are at least in part causing the initiation of triggering after the 2011 M9.0 Tohoku-oki earthquake. We will further explore in this section the triggering mechanism by looking at potential activation due to other remote, large events.
Harrington & Brodsky (2006) performed a systematic analysis of remote triggering of seismicity in Japan; they found that only following the 2004 M9.0 Sumatra earthquake there is statistically significant evidence of remote triggering, which occurred in the Kyushu Islands, at the Ibusuki volcanic field (southern Kyushu; same area as the one labelled ‘Kagoshima’ in our study). We have used the ANSS world-wide composite catalogue to search for events of M ≥ 7.5 after 2005 and classified them by the amplitude of shaking observed at Hi-net stations in Kyushu, close to volcanic sites. Larger surface wave amplitudes, which correspond to dynamic stresses above a few kPa (Section 3.3), were observed after the 2008 M7.9 Wenchuan, 2012 M8.6 Sumatra, 2005 M8.6 Nias, 2007 M8.1 Solomon Islands, and 2007 M8.4 Sumatra earthquakes. Small events that are difficult to separate from the background noise were observed at Ibusuki following the 2012 Sumatra earthquake. The more clear and relevant triggering for our discussion is observed during the passage of surface waves from the 2008 M7.9 Wenchuan earthquake. All the other remote earthquakes mentioned above are non-triggering events (for the areas of interest in our study).
Fig. 4 shows distinct triggering of local earthquakes by the 2008 Wenchuan earthquake, with recognizable P- and S-wave arrivals (S–P times of less than 2 s at the stations used in the figure; there were too few available P- and S-phases, however, for locating these events). Two of the events are triggered close to Aso volcano, during the passage of Love and Rayleigh waves, respectively. Similar triggering is observed in the southern part of Kyushu, at the Ibusuki volcanic field. The triggering occurs during the passage of surface waves with periods of ∼10–20 s (Fig. 3b), similar with other well documented cases (e.g. Hill & Prejean 2015; Enescu et al. 2016).
![Remote triggering in Kyushu by the 2008/5/12 15:28:01 (JST) Mw 7.9 Wenchuan earthquake. (a) NIED Hi-net stations (black inverted triangles) used in (b), (c) and (d), as well as volcanoes in Kyushu (grey triangles); Dashed rectangles (1) and (2) represent the area labelled ‘Oita’, which corresponds to two distinct volcanic subareas, close one to each other, (1) Yufuin-Beppu and (2) Aso, respectively; area (3) shows the 2016 Kumamoto rupture area; Inset shows a regional map with the location of the 2008 Wenchuan earthquake. (b) High-frequency (10–30 Hz) vertical velocity seismogram at HKSH station (close to Aso volcano) is shown at the top of the plot, followed by the low-frequency (0.01–0.2 Hz) vertical, radial and transverse displacement seismograms, respectively, relative to the origin time of the Wenchuan earthquake. The two identified earthquakes correspond to the arrival of surface wave trains; (c) Same as in (b), but at YKWH station (in southern Kyushu); the grey arrows show the time-interval used for plotting the velocity spectra in Fig. 3(b); (d)–(g) Plots showing the P- and S-wave arrivals on vertical (U) and horizontal (E–W) velocity seismograms, respectively, for the local events that are likely triggered by the passage of Love [(d), (f)] and Rayleigh [(e), (g)] waves from the Wenchuan earthquake.](https://oup.silverchair-cdn.com/oup/backfile/Content_public/Journal/gji/212/2/10.1093_gji_ggx456/2/m_ggx456fig4.jpeg?Expires=1750308440&Signature=Rjey7~zYHagSrrELESgc~zNy8vwU~Aisjh-C8ROt3f666~Iztg~ROP689~uIvKg9Jh6d52OuqADOBS6tHw~3wLItvV-u~4tuGGI3Uto8lHi~7f2gvYNkjpsQYJ3USjDv-F2m1dPTbLHYf1~TOUuCY25FJrrT3gl1QnpPVhJnNMxlq0eLFKuNiDEZJ1ype3lafnB5YI1E1CVGz2Z5r54XJFMULaSuObl0Y07g6vKStEHoV4CW7GPryDzsjzkreVwEqGm1a2WyRC71VvXNUQUyVOR2FGjyB7ihGcyRItnGeX~5BUkKKYhAaYfquzsbejEfdImSe8UZ-anIFLhUURfJ1g__&Key-Pair-Id=APKAIE5G5CRDK6RD3PGA)
Remote triggering in Kyushu by the 2008/5/12 15:28:01 (JST) Mw 7.9 Wenchuan earthquake. (a) NIED Hi-net stations (black inverted triangles) used in (b), (c) and (d), as well as volcanoes in Kyushu (grey triangles); Dashed rectangles (1) and (2) represent the area labelled ‘Oita’, which corresponds to two distinct volcanic subareas, close one to each other, (1) Yufuin-Beppu and (2) Aso, respectively; area (3) shows the 2016 Kumamoto rupture area; Inset shows a regional map with the location of the 2008 Wenchuan earthquake. (b) High-frequency (10–30 Hz) vertical velocity seismogram at HKSH station (close to Aso volcano) is shown at the top of the plot, followed by the low-frequency (0.01–0.2 Hz) vertical, radial and transverse displacement seismograms, respectively, relative to the origin time of the Wenchuan earthquake. The two identified earthquakes correspond to the arrival of surface wave trains; (c) Same as in (b), but at YKWH station (in southern Kyushu); the grey arrows show the time-interval used for plotting the velocity spectra in Fig. 3(b); (d)–(g) Plots showing the P- and S-wave arrivals on vertical (U) and horizontal (E–W) velocity seismograms, respectively, for the local events that are likely triggered by the passage of Love [(d), (f)] and Rayleigh [(e), (g)] waves from the Wenchuan earthquake.
These results suggest a possible dynamic triggering scenario in Kyushu by the surface waves of large remote earthquakes. The arrival of Love waves initiates triggering on fault segments well-lubricated by the presence of fluids at or close to volcanic areas; these areas, already brought at or close to failure, are further activated by the passage of Rayleigh waves that possibly cause fluid excitation, responsible for additional cracking. Note that a similar scenario of triggering has been also proposed in another tectonic environment, in the Nankai Trough, based on observations of both Love and Rayleigh wave triggering of tectonic tremor following the 2011 M9.0 Tohoku-oki earthquake (Chao et al. 2013).
3.3 A summary of dynamic triggering mechanisms
Based on the results of Section 3.1, we regard the seismicity activation in SW Japan, at the sites shown in Fig. 1, to be initiated by the strong shaking due to the passage of both Love and Rayleigh waves from the Tohoku-oki megathrust earthquake.
Following the approach underlined in previous studies (e.g. Peng et al. 2009) and assuming plane wave propagation for teleseismic waves, the peak dynamic stress σd is proportional to Gu’/Vph (Jaeger & Cook 1979), where G is the shear modulus, u’ is the peak particle velocity, and Vph is the phase velocity. We use a nominal G value of 30 GPa, Vph = 4.1 km s–1 for the Love waves, and Vph = 3.5 km s–1 for the Rayleigh waves. The estimated dynamic stress change values at the furthest triggered site, in Kagoshima (station YKWH, on the transverse component), are of about 131 kPa (0.13 MPa), which is at least 10 times larger than the minimum values of stress that have been shown capable of triggering seismicity (Peng et al. 2009 and references therein). Thus, we infer that the strong shaking by the passage of Love waves might have initiated the triggering process.
The possibility that the Love waves initiated the triggering in Kyushu, specifically near Aso volcano and at the Ibusuki volcanic field, is confirmed in Section 3.2 by the analysis of remote seismicity triggering from the 2008 M7.9 Wenchuan earthquake. The events near Aso are triggered at dynamic stresses of about 63 and 99 kPa, as calculated from velocity seismograms recorded at HKSH station, on transverse and vertical components, respectively. Similar values of dynamic stress (51 and 101 kPa, respectively) are estimated at station YKWH, in Ibusuki. The passage of Rayleigh waves (of comparable or even larger amplitudes) triggered as well local events (Section 3.2 and Fig. 4). Note that the other investigated teleseismic events, namely the 2012 M8.6 Sumatra, 2005 M8.6 Nias, 2007 M8.1 Solomon Islands and 2007 M8.4 Sumatra earthquakes were associated with maximum dynamic stresses in Kyushu of 18, 9, 5 and 4 kPa, respectively, significantly smaller than those corresponding to the passage of surface waves from the 2011 M9.0 Tohoku-oki and 2008 M7.9 Wenchuan earthquakes. The dynamic stress values estimated in this study are consistent with those reported by Chao & Obara (2016), who searched for triggered tectonic tremor in Japan, following the 2012 M8.6 Sumatra earthquake and other large teleseismic events.
4 TIME-DECAY CHARACTERISTICS OF TRIGGERED SEISMICITY AT VOLCANIC AND NON-VOLCANIC REGIONS
4.1 Short-term activation of seismicity in SW Japan, after the 2011 M9.0 Tohoku-oki earthquake
We search for subtle short-term activations of seismicity at areas where dynamic triggering due to the passage of surface waves has been previously confirmed (see Section 3.1 and Fig. 1). First, we combine our manually detected earthquake dataset (Table 1) with the JMA earthquake catalogue. If a JMA-catalogue earthquake occurs within less than 5 km and less than 2 s from a manually detected earthquake, the two events are assumed identical (and only the manually detected event is selected). Then, we select earthquakes within circles of a radius of 30 km, at depths from 0 to 50 km, centred at the epicentres of the events that have been detected in the first 30 min, in SW Japan, after the occurrence of the M9.0 Tohoku-oki earthquake. Variation of the selection radius in the range 20–40 km produces similar results. The results of this selection, for a time window of 120 d, centred on the 2011 Tohoku-oki earthquake, are shown in the map view of Fig. 5.
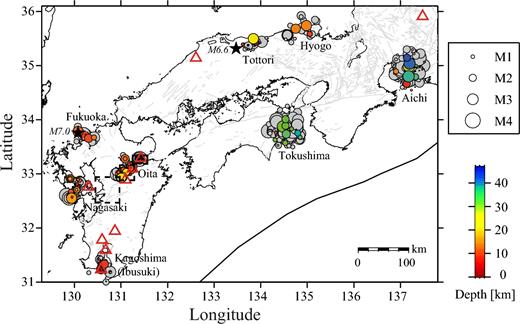
Seismicity map of SW Japan for the areas with observed dynamic triggering. Grey circles represent earthquakes from the JMA catalogue, selected for a radius of 30 km around the first manually detected events after the Tohoku-oki main shock, for each of the triggered regions, for a time interval of 60 d before and after the 2011 March 11 Tohoku-oki earthquake. The coloured circles show the seismic activity (JMA catalogue and manual detections) during the first week after the main shock, as explained in the main text. Black stars show the epicentres of the 2000 M6.6 Tottori earthquake and the 2005 M7.0 Fukuoka earthquake, respectively. Dashed rectangles, in Kyushu, mark the same areas as in Figs 4 and 8. Red triangles represent volcanos.
To detect the temporal extent of seismic activation, we plot in Fig. 6 the cumulative number of events (with epicentres shown in Fig. 5) versus time. The plot can be interpreted as stacking of seismicity in the dynamically triggered regions. Note that stacking is often used to enhance the ‘useful’ but weak signal from the ‘background’, for example when discussing properties of foreshocks and aftershocks (e.g. Enescu et al. 2009).
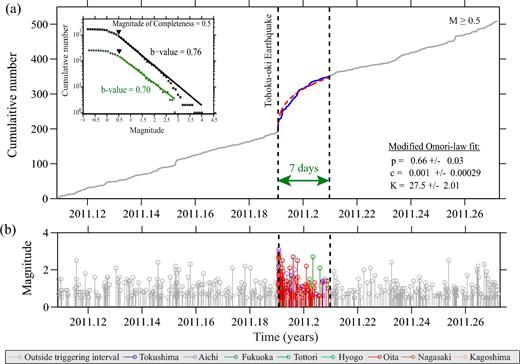
Temporal evolution of seismicity before, during and after the triggering periods. (a) Cumulative number of triggered events versus time, in the selected areas (Fig. 5). The curve during the 7-d period after Tohoku-oki main shock is plotted in blue; grey is used for the other time periods. The red dotted curve represents the modified Omori-law fit, with parameters: p = 0.66 ± 0.03, c = 0.001 ± 0.00029, K = 27.5 ± 2.01 (see text for details). The left inset shows the frequency-magnitude distribution of events during the whole observation period (shown in black; b-value = 0.76 ± 0.02, a-value = 3.34), respectively the 7 d interval (shown in green; b-value = 0.70 ± 0.05, a-value = 2.48), calculated for M ≥ Mc = 0.5, as determined by the EMR method. (b) Magnitude versus time distribution for the same time-period as in (a); colours show events occurred for the 7-d triggering period, in various triggered areas (see legend), while grey is used for other time periods.
The cumulative number of earthquakes (with magnitudes larger than the overall completeness magnitude, M ≥ Mc = 0.5—see inset of Fig. 6, upper plot and related explanations in figure's caption) shows a clear, albeit relatively weak activation that coincides with the timing of the 2011 Tohoku-oki earthquake (Fig. 6). The seismicity rate in the first (67 events/d) and second (28 events/d) days after the Tohoku-oki event increased 11.2 and 4.7 times, respectively, compared with the rate of the events in the day before the occurrence of the megathrust (6 events/d). The background rate estimated from the seismicity (M ≥ 0.5) occurred in the studied areas from the beginning of the year until the occurrence of the megathrust event leads to a similar event-rate of 5 events/d. The seismicity rate (6 events/d) after one week from the megathrust event returned to pre-Tohoku-oki earthquake levels. The 7-d relative seismicity increase after the Tohoku-oki earthquake in the triggered areas has a clear decay with time; this decay can be fitted by a Modified Omori law, as shown in Fig. 6. One can notice the relatively low p-value (∼0.66) obtained for the fitting. The result should be interpreted with caution since the level of catalogue incompleteness might be problematic at short times after the Tohoku-oki megathrust and ‘contamination’ with background seismicity may bias the parameter towards smaller values (Utsu et al. 1995). Nevertheless, equivalent results have been obtained for higher magnitude thresholds, M = 0.7, 1.0. Based on the estimated Omori-law parameters (Fig. 6), the return period of seismicity rates to the background level (6 events/d) lasts about 10 d. The results suggest that despite an overall slow decay (i.e. low p-value) of seismicity rates, the weak seismicity activation in the studied areas returns to the background level in 7–10 d.
To better understand the nature of seismicity activation in SW Japan, after the 2011 Tohoku-oki earthquake, we plot in Fig. 7 the cumulative number and magnitude of earthquakes versus time for some of the triggered areas (Fig. 1). Regions at or close to volcanoes in Kyushu are most clearly activated (i.e. ‘Oita’, ‘Nagasaki’ and ‘Kagoshima’ regions). For other non-volcanic areas, the seismicity might be activated only during the passage of main shock surface waves (e.g. the ‘Hyogo’ area). Note also the relatively high seismicity background in the three volcanic areas mentioned above. While the immediate post-Tohoku seismicity rate increase is clear in most regions, an Omori-type decay is difficult to identify; this observation contrasts with the results of Fig. 6, where stacking enhances the ‘signal’ during the activation period against the background level.
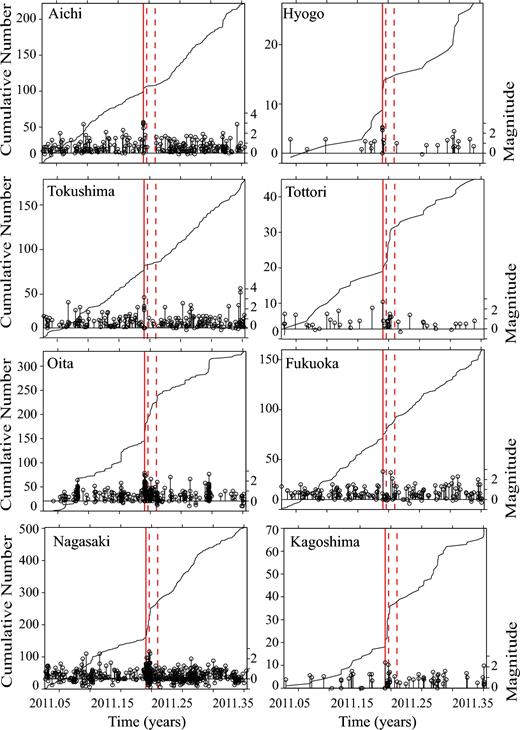
Cumulative number and magnitude distribution of events versus time, for the areas indicated in Fig. 5. The vertical red line in each plot represents the occurrence time of Tohoku-oki earthquake, while the following two vertical red dashed lines represent 2 and 7 d from the main shock, respectively.
We could not find any evidence of triggering at non-volcanic sites following the 2008 M7.9 Wenchuan earthquake or other remote large earthquakes occurred after 2005. The passage of surface waves from the 2008 Wenchuan earthquake was associated with dynamic stresses of 30–80 kPa (at the non-volcanic sites), while other remote earthquakes produced significantly lower values, in the range of 10–40 kPa for the 2012 Sumatra earthquake and on the order of 10 kPa or less for the 2005 Nias, 2007 Sumatra and 2007 Solomon Islands earthquakes. Moreover, the seismicity activation at volcanic sites in Kyushu after the 2008 Wenchuan earthquake is relatively weak and might take place only during the passage of surface waves from the main shock.
In some cases (e.g. Fig. 7, the ‘Oita’ region), the larger events occur at the very beginning of the triggered sequence, in others (e.g. in ‘Nagasaki’ region) the first triggered events have smaller magnitudes and are followed by larger events, similar with a seismic swarm. Such observations indicate that the higher rates of seismicity after the initial excitation by the Tohoku-oki surface waves are likely related to local static stress interactions and crustal fluid movement. While the time decay for the stacked earthquake sequence is relatively smooth (Fig. 6(a)), one can notice a more stair-like pattern for the individual areas (Fig. 7), which may indicate relatively quick and short local activations, possibly signatures of a fast decay. Local stress interactions (Ziv 2006) and, likely, excitation of fluids at volcanic and geothermal sites (e.g. Kosuga 2014; Shimojo et al. 2014) caused the seismicity rates to remain above the background level after the passage of surface waves from the 2011 Tohoku-oki earthquake, however for a relatively brief time. Such an interpretation is consistent with the findings of Brodsky (2006) for long-range triggered seismicity that continues after the passage of surface waves.
The immediate seismicity triggering in Fukuoka (Kyushu; Fig. 7) does not occur at or near a volcano (Fig. 5), however the area experienced a large earthquake (M7.0) nearby, in 2005. The very brief triggering period in Tottori occurred in an area of active faulting, relatively close to a 2016 M6.6 event, where rather frequent moderate-size events have occurred often in the past. These observations may support the interpretation (e.g. Enescu et al. 2016) that dynamic triggering could be a proxy for detecting areas of relatively high seismic potential.
What causes the relatively slow decay of seismicity rates for the stacked sequences in SW Japan? Aiken & Peng (2014) documented a relatively slow decay (p-value ∼ 0.7) of dynamically triggered seismicity at geothermal sites in the United States, for roughly the first hour after large remote main shocks. Enescu et al. (2009) reported a slower temporal decay (p-value ∼ 0.7) of stacked swarm-like seismic sequences in California, compared with the more typical main shock-aftershock sequences (p-values ∼ 1.0). These results suggest that the decay found in this study (p-value ∼ 0.7) could be the effect of stacking swarm-type seismic sequences triggered predominantly at geothermal/volcanic areas in Kyushu. Some further support for this interpretation comes from the observed trade-off between the p-value and c-value of the Modified Omori law. By fixing the p-value above 0.7 and inverting only for the c-value and K-value, we have observed a tendency of estimated c-values to increase. For example, a fixed p-value = 1.0, results in a c-value = 0.04 d, which is one order larger than the previously determined c-value (Fig. 6). We hypothesize that the slightly different timing and decay characteristics of seismicity activation in various areas may result in either a relatively small overall p-value or large c-value. Thus, the temporal characteristics of an individual earthquake cluster might be different than the collective behaviour documented above; however, unfortunately, the number of dynamically activated events is too less for some quantitative local (one-cluster) analysis. Since the 2016 M7.3 Kumamoto earthquake triggered dynamically a relatively large event (M5.9) at Yufuin-Beppu geothermal area (Kyushu), which was followed by many other local earthquakes (likely aftershocks of the M5.9 event), we will compare in Section 4.2 the decay rate of aftershocks following the M5.9 event with that of aftershocks around the M7.3 main shock fault area (non-volcanic region).
4.2 Relatively short durations and fast decay of aftershocks at volcanic regions in Kyushu, after the 2016 M7.3 Kumamoto earthquake
We have documented in the previous section a stronger activation of seismicity following the 2011 Tohoku-oki earthquake at some volcanic areas in Kyushu compared to other regions. Two of the triggered areas are situated in the region labelled ‘Oita’. At a closer look, one can distinguish two main subareas of activation: the one close to Aso volcano and the other one to the northeast, in the Yufuin-Beppu region. These areas have been seismically activated during the 2016 M7.3 Kumamoto earthquake sequence as well (e.g. Uchide et al. 2016; Yagi et al. 2016). It is important to remark that Miyazawa (2016), Uchide et al. (2016) and Yoshida (2016) demonstrated the dynamic triggering initiation (by main shock body or surface waves) of seismicity at the Yufuin-Beppu region, where a M5.9 occurred at very short times after the main shock.
The aftershock area following the 2016 M7.3 Kumamoto earthquake can be divided into three subareas, as shown in Fig. 8(a). The ‘Main’ area, where the fault rupture is located, the ‘Aso’ area, which is at the northeast end of the fault and close to Aso volcano, and finally the Yufuin-Beppu geothermal area.
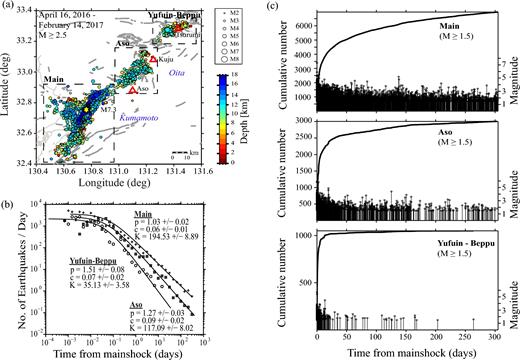
Aftershock spatial distribution and temporal decay for the 2016 Kumamoto sequence. (a) Distribution of aftershocks of the Mw 7.3 Kumamoto earthquake, from 2016 April 16 to 2017 February 14, coloured function of depth (with a size scaled with the event magnitude). The three aftershock areas are referred as ‘Main’ for the main shock (yellow star) region, ‘Aso’ and, respectively, ‘Yufuin-Beppu’, for the aftershocks occurred in these two last areas, respectively. Red triangles show volcanos, while grey lines show active faults; (b) aftershock decay and the corresponding Modified Omori law fit for the three regions indicated in (a) (‘Main’, crosses: p = 1.03 ± 0.02, c = 0.06 ± 0.01, K = 194.53 ± 8.89; ‘Aso’, rectangles: p = 1.27 ± 0.03, c = 0.09 ± 0.02, K = 117.09 ± 8.02; ‘Yufuin-Beppu’, circles: p = 1.51 ± 0.08, c = 0.07 ± 0.02, K = 35.13 ± 3.58); (c) magnitude versus time plot for the ‘Main’, ‘Aso’ and ‘Yufuin-Beppu’ regions (M ≥ 1.5).
Fig. 8(b) shows the decay of aftershocks in the three areas mentioned above, for earthquakes above the completeness magnitude (Mc = 2.5). We observe that the p-values at Aso volcano and Yufuin-Beppu geothermal region are unusually high: 1.27 ± 0.03 and 1.51 ± 0.08, respectively; the aftershock decay in the ‘Main’ area is characterized by a p-value of 1.03 ± 0.02, which is ‘normal’ for an aftershock sequence. We have obtained similar results for a threshold magnitude of 3.0, thus we conclude that the results are robust against parameter variations. Note also that in a detailed study of Zhuang et al. (2017), regarding the level of magnitude completeness after the 2016 Kumamoto earthquake, it was found that p-values are less sensitive to completeness issues and the parameter is robust against changes in the threshold magnitude. The relatively short period of activation and fast decay of aftershocks at the Yufuin-Beppu region can be qualitatively confirmed also by the magnitude versus time plots in Fig. 8(c).
How can we explain the fast seismicity decay for ‘Yufuin-Beppu’ and ‘Aso’ areas? As discussed by Klein et al. (2006), large decay rates (p-values ≥ 1.2) of aftershocks are generally found near active volcanic centres and may associate with higher temperatures near shallow magma reservoirs and faster stress relaxation following main shocks. In addition, the occurrence of a relatively large aftershock (M5.9) at the ‘Yufuin-Beppu’ region may have released almost completely the accumulated tectonic stresses (i.e. an almost complete stress drop), thus explaining the quick attenuation of seismicity and weak seismic activity after more than one month from the main shock (Fig. 8c).
We finally attempt to integrate our observations on the decay of dynamically activated seismicity. The remote earthquakes activated preponderantly at geothermal and volcanic areas in Kyushu following the 2011 Tohoku-oki earthquake had swarm-like characteristics, with an overall temporal decay of seismicity rates that follows the Modified Omori law. The estimated small p-value discussed in Section 4.1 is likely an effect of stacking sequences with different temporal characteristics (including different seismicity rate decays). Note that there are some well documented cases that report fast aftershock decays following larger earthquakes that occur within a swarm sequence (Utsu et al. 1995). The vigorous seismicity that followed the 2016 Kumamoto earthquake displayed clear contrasting aftershock decays: ‘normal’ p-values around the main shock rupture and large p-values at volcanic/geothermal sites. The aftershocks in the Yufuin-Beppu region, following a dynamically triggered relatively large event (M5.9), had the fastest decay. We hypothesize that while large surface waves from the Kumamoto earthquake could dynamically trigger the M5.9 event (e.g. Miyazawa 2016), the local conditions (temperature and possibly stress) resulted in a fast decay and abrupt termination of aftershocks in the area.
5 CONCLUSIONS
We have documented the dynamic triggering as well as the temporal extent and decay characteristics of seismicity activation at remote locations in SW Japan, following the 2011 M9.0 Tohoku-oki earthquake. The first events in each of the triggered areas occur during the passage of large Love and Rayleigh waves from the main shock. We have observed that the amplitudes of surface wave displacements on transverse components are significantly larger than those on vertical or radial components and hypothesized that the Love waves played a significant role in initiating remotely the seismicity activation in SW Japan, after the megathrust event. We have also noticed that the surface waves responsible for the dynamic triggering after the 2011 Tohoku-oki earthquake are characterized by relatively long periods (20–50 s) compared to those (10–25 s) usually reported as most efficient at remotely triggering earthquakes. The large shaking (i.e. dynamic stresses) associated with these longer period surface waves was likely the dominant factor responsible for event-triggering. The potential of both Love and Rayleigh wave triggering at or close to two volcanic areas in Kyushu is confirmed by the detection of local events that occurred during the passage of surface waves from the 2008 M7.9 Wenchuan earthquake. Our results imply that sharing motion, induced by the passage of Love waves from the remote large earthquake on well-lubricated local faults, may have facilitated and started failure in these areas; the subsequent passage of Rayleigh waves triggered also local earthquakes.
The analysis of a combined catalogue of events—either detected in this study on high-pass filtered continuous waveforms, for the early times after the 2011 Tohoku-oki earthquake, or recorded by the JMA—showed that the stacked seismicity for all activated areas had a clear, albeit weak increase immediately after the megathrust earthquake and continued after the passage of seismic waves, for a period of about one week or less. The decay of activated-earthquake rates towards the pre-main shock levels follows the Modified Omori law and is relatively slow, with p-values of about 0.7, possibly indicating the stacking of swarm-like triggered sequences. The increased rates of seismicity after the passage of seismic waves are most evident in three volcanic/geothermal regions in Kyushu: Oita (includes seismicity near Aso volcano and at the Yufuin-Beppu geothermal region), Nagasaki and Kagoshima (at the Ibusuki volcanic field).
Finally, the aftershock analysis around Aso volcano and at the Yufuin-Beppu geothermal region, following the M7.3 Kumamoto earthquake, revealed a fast decay of aftershock rates (p-value ≥ 1.2), which suggests quick stress relaxation nearby high-temperature, shallow magmatic reservoirs. Since dynamically triggered events are usually observed at geothermal/volcanic sites, future studies should assess whether the fast decay reported in this paper is a general characteristic. In cases where swarm-like seismicity activation is observed, it will be of interest to analyse the decay of aftershocks following larger events within the swarm. The continuous improvement of seismic network detection capabilities may allow an accurate characterization of such temporal features, thus contributing to a better earthquake hazard assessment.
Acknowledgements
The JMA earthquake catalogue used in this study is produced by the JMA, in cooperation with the Ministry of Education, Culture, Sports, Science and Technology (MEXT) of Japan. The JMA catalogue has been accessed last time on 2017 April 20, and is available at the link: http://www.data.jma.go.jp/svd/eqev/data/bulletin/hypo_e.html. We thank NIED for providing the Hi-net and F-net waveform data (https://hinetwww11.bosai.go.jp/auth/?LANG = en, last accessed on 2017 May 25). AO thanks MEXT for providing a ‘Monbukagakusho’ scholarship for studying at Tsukuba University, in Japan. The authors are grateful to Dr Masatoshi Miyazawa and Dr Kazushige Obara for earlier comments on the topic, as well as Dr Keiko Kuge for some useful observations related to waveform data interpretation. We thank the Associate Editor and two anonymous reviewers for their constructive and insightful comments.
