


Summary
We used the SBAS DInSAR analysis technique to estimate the interseismic deformation along the western part of the Doruneh fault system (DFS), northeastern Iran. We processed 90 ENVISAT images from four different frames from ascending and descending orbits. Three of the ground velocity maps show a significant interseismic signal. Using a simple dislocation approach we model 2-D velocity profiles concerning three InSAR data set relative to the western part of the DFS, obtaining a good fit to the observations. The resulting model indicates that a slip rate of ∼5 mm yr−1 accumulates on the fault below 10 km depth, and that in its western sector the Doruneh fault is not purely strike-slip (left-lateral) as in its central part, but shows a significant thrust component. Based on published geological observations, and assuming that all interseismic deformation is recovered with a single event, we can estimate a characteristic recurrence interval between 630 and 1400 yr.
1 Introduction and Tectonic Framework
The Doruneh fault system (DFS) is one of the longest and more prominent faults in Iran (Wellman 1966; Farbod 2011). This strike-slip fault system crosses northeastern Iran for about 400 km from the eastern Dasht-e Kavir basin to the Iran-Afghanistan border (Fig. 1a). The DFS system plays an important role in the tectonics of northeastern Iran. It is thought to accommodate part of the 15 mm yr-1 N-S right-lateral shear observed across Central Iran and the Lut block (Vernant 2004; Fattahi 2007). In particular, the available geodetic data for northeastern Iran (Vernant 2004; Reilinger 2006) show a ∼7 mm yr-1 shear rate between the Lut block, south of the DFS and Eurasia (Figs 1a and b). The amount of deformation accumulated on the DFS, as well as the characteristics of its release, are not yet clear, given the scarcity of geodetic, geomorphologic and palaeoseismic data. For this reason the knowledge of the seismotectonics of the fault, is rather limited. Only few moderate (Mw 5-5.8) instrumental earthquakes have been recorded around the entire DFS, whereas the historical record shows no more than one event possibly associated to the DFS. Such low seismicity might be either because of the lack of historical data or to long recurrence intervals for the largest earthquakes (Ambraseys & Melville 1982; Fattahi 2007; Farbod 2011).
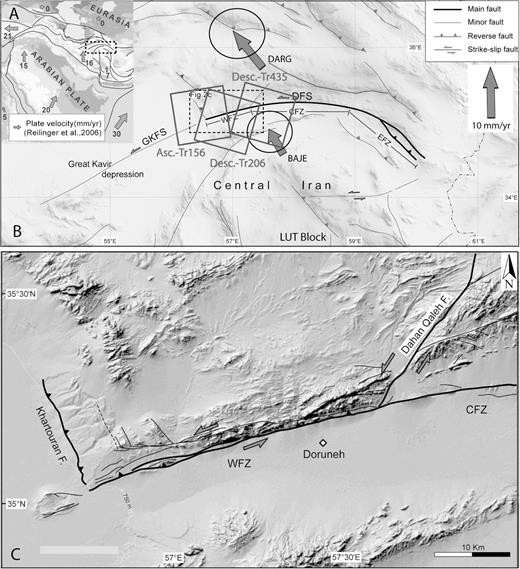
(A) Location and geodynamical setting of the Arabia-Eurasia collision zone. Fault mapping results from the Farbod's PhD thesis work (e.g. Farbod 2011). The arrows show plate velocities (mm yr-1) after Reilinger (2006) (B) GTOPO30 topographic image on northern part of Central Iran showing the location of the DFS. The arrows show velocities (mm yr-1) of the DARG and BAJE GPS sites (Tavakoli 2007); the three quadrangles show the footprints of the ENVISAT scenes. GKFS, Great Kavir fault system; DFS, Doruneh fault system; WFZ, western fault zone; CFZ, central fault zone, EFZ, eastern fault zone, DQF, Dahan-Qaleh fault; KF, Khartouran fault. (C) Shaded relief map (SRTM) of the WFZ. The trace of the WFZ joins at DQF and KF at its eastern and western terminations, respectively. The KF absorbs the relative westward motion (left-lateral faulting) of WFZ's northern block by reverse faulting. Left-lateral faulting along the DQF fault implies a prominent reverse component to the left-lateral WFZ.
Geomorphological studies of faulted quaternary deposits along the central DFS trace (Figs 1b and c) show several 10 m of left-lateral displacement in the Holocene (Fattahi 2007), from which a long-term slip rate of 2.5 mm yr-1 is estimated. Recent geomorphological studies (Farbod 2011) proposed a model for the DFS, defining three distinct segments characterized by different kinematic regime: the western fault zone (WFZ), the central fault zone (CFZ) and the eastern fault zone (EFZ; Fig. 1b). Although the EFZ displays an imbricate reverse fault zone and NW-SE oriented folding, the CFZ shows exclusively a left-lateral strike-slip motion. The WFZ (Fig. 1b) shows instead evidences of a transpressional local tectonics in agreement with the kinematics of the NE-trending, branching Dahan-Qaleh left-lateral strike-slip fault (DQF in Fig. 1c) and of the NNW-SSE Khartouran reverse fault (KF in Fig. 1c), which terminates the DFS system to the west.
No detailed geodetic measurements are available for the area, and the few existing GPS sites (Vernant 2004) are too sparse to be used for a local scale analysis of the interseismic velocity field. A GPS velocity field has been reconstructed by Tavakoli (2007) for Eastern Iran, using survey-mode GPS sites; the two stations closer to the WFZ (DARG and BAJE) show a differential left-lateral velocity of 2.5 ± 2 mm yr-1, although they seem to indicate extension across the DFS of 2.4 mm yr-1, which contrasts with the geodynamic setting.
In this work, we present the results of interseismic deformation measurement and analysis, carried out using multitemporal differential SAR interferometry (InSAR). We used the InSAR-Small BAseline Subset technique (SBAS) technique (Berardino 2002) to process several tens of ENVISAT-ASAR images covering the WFZ with a temporal span of 8 yr, from 2003 to 2010. We calculated the ground velocities over the most coherent areas and modelled the data to investigate the WFZ slip rate and kinematics.
2 Multitemporal Insar Data Analysis
We calculated ground displacement time-series and mean ground velocities in the line of sight (LOS), that is, the ground-satellite direction, using the SBAS, developed by Berardino (2002).
We processed four ENVISAT-ASAR image mode data sets, acquired from four different frames (Table 1) covering the WDF area. For ascending track, 385 only eight images were available and although this data set was processed, the final velocity was considered too noisy and was not used for subsequent modelling. Using as constraints a maximum normal baseline of 300 m and a maximum temporal separation of 1200 d, we generated 79 interferograms for track 156, 52 for track 206 and 113 for track 435. We used the post-processed precise Delft orbits () during interferogram generation, and a 20 x 4 multilooking, to obtain a square pixel with a ground resolution of 80 m. For topographic corrections we used the SRTM-3 Digital Elevation Model (). The coherence threshold for pixel selection was 0.75. The resulting mean velocity maps are shown in Fig. S1. By averaging, we then reduced the ground resolution to 400 m pixel-1, to improve the signal-to-noise ratio and masked the strong subsidence signals observed in the large plain south of the DFS, related to water table overpumping because of agriculture developments (Fig. S1; Anderssohn 2008).
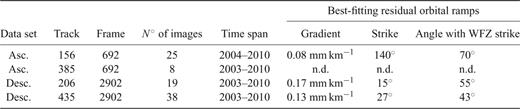
Multitemporal InSAR data sets. The last three columns indicate the removed residual orbital ramps (see text for explanation).
InSAR time-series processing results are usually affected by residual orbital signals, not completely removed from the single interferograms during the stack inversion (Biggs et al. 2006; Casu 2006; Manzo 2011). These signals have the same characteristics of interseismic signals: low wavelengths and low rates, and thus need to be modelled and removed before any interseismic modelling. Where possible, this is best accomplished using independent deformation measurements obtained from GPS data (Burgmann 2006; Fialko 2006; Manzo 2011). Because we did not have enough GPS data to estimate the geodetic signal across the Doruneh fault, we estimated best-fitting linear ramps directly from our velocity maps. The best way to estimate the actual orbital residuals would be to consider an area where there is no tectonic signal. Although it is probably not possible to find an area completely devoid of tectonic deformation in Central Iran, because we are interested in the interseismic deformation accumulating along the Doruneh fault, we first estimated the ramps using velocities located at least 30–40 km from the WFZ trace. Because these estimates might be influenced by a reduced number of data samples, we then compared these ramps to those calculated using the full velocity maps.
For a nearly vertical, mainly strike-slip fault as the WFZ, we expect that the interseismic signal shows the largest variations perpendicularly to the fault (Biggs et al. 2006; Fialko 2006; Elliott 2008). If the actual residual orbital phase gradients are much steeper, and are oriented at high angles from the expected signal ‘ramp’, the estimated ramp should contain only a small fraction of interseismic signal. Indeed the differences between the ramps estimated locally and on the entire map were very small: a few degrees in direction and a virtually identical gradient (only for track 156 there is a difference of 0.04 mm yr-1 km-1), confirming the robustness of the estimates. We then subtracted the estimated ramps from the velocity maps, assuming only a small fraction of tectonic signal to have been removed in this process. The final velocity maps are shown in Figs 2(a)–(c). We also ruled out the presence of evident topography-correlated atmospheric artefacts because the correlation with ground velocity is ∼0.

Mean LOS velocity maps from (A) ascending track 156, (B) descending track 206 and (C) descending track 435. Positive velocity values (blue colours) indicate ground movement toward the satellite along the LOS direction (inclined 23° from the vertical), negative ones (red colours) indicate the opposite. In red we show the DFS system trace; other faults in the region are in black. Black triangles indicate the reference point; black boxes mark the ∼20 km buffered velocity profiles reported with the profile (D), (E) and (F), where the topography is also reported in green; dashed red lines mark the intersection with the DFS trace, whereas dashed black lines mark the truncation of profile, around the DFS trace, used in the inversion processing. We show velocity error bars of ±1 mm yr-1. All the maps are geo-referenced in UTM WGS84, Zone 40 N.
The SBAS algorithm does not estimate the uncertainty of the derived mean velocities (Casu 2006), and no other geodetic data were available at the same scale. We expect the average uncertainty to be ±1 mm yr-1, based on the SBAS assessment study by Casu (2006).
We observe a clear pattern of accumulation of interseismic deformation across the WFZ. The velocity maps show predominantly higher LOS velocities north of the fault, with a relative difference of ∼2 mm yr-1 over a distance of 30–40 km from the fault (Figs 2a and c). There is no clear discontinuity in the velocities across the fault trace, suggesting that no surface creep is presently acting on the WFZ. Two ENVISAT data sets (Figs 2a and c) show velocity patterns with approximate wavelengths of 30–40 km across the fault.
3 Interseismic Deformation Modelling
We investigated some of the characteristics of the Doruneh fault by a 2-D non-linear modelling of our geodetic observations. Such a simplified model implies that the deformation is constant along strike. Our velocities show a low-varying signal along strike for the two descending data sets, at least up to the DQF intersection to the east. The ascending data set shows instead a ∼3 mm yr-1 decrease along the northern side of the DFS, from east to west (Fig. 2). This behaviour is compatible with the presence of a fault discontinuity, and in fact the western limit of the WFZ, as defined by Farbod (2011), is here limited by the transversal KF. To avoid any border effect, we inverted only data averaged over box profiles calculated for the central part of the WFZ (Figs 2-c). We used the three most reliable velocity maps (Table 1), considering their actual LOS, and all weighted equally.
We assume that the WFZ can be approximated by an infinitely long dislocation occurring on a defined fault plane extending from the surface to an infinite depth. The model assumes that the fault part extending below a certain depth is freely slipping and is loading the brittle, upper crustal layer, which is locked in the interseismic period (Savage & Burford 1973). The deformation rates observed at the surface are inverted to retrieve a set of fault parameters at depth. The locking depth is determined by the thickness of the brittle seismogenic layer, where elastic deformation dominates (Savage & Burford 1973). When modelling interseismic deformation across large areas, the presence of parallel faults and across-strike variations of crust rigidity may complicate the deformation pattern up to a point where simple elastic models cannot provide a reasonable fit to the data (Fialko 2006). Although no information exist on possible crust rigidity variations in the area, the presence of a nearly parallel, ∼100-km-long fault to the south of the WFZ, bordering to the north of the Dasht-e-Kavir basin, is reported (Fattahi 2007). North of the WFZ there are no major mapped faults, but the presence of ENE-WSW basins and ridges and sharp geological boundaries suggests that a similarly oriented active fault is present here too, at a distance of ∼40 km. To minimize the possible contributions of interseismic crustal velocities from these nearby faults, we truncated the profiles at a distance where we expect that the observed signal is attributed to WFZ as shown in Fig. 2.
We fixed the fault location and strike angle as the WFZ, the locking depth to 12 km (average depth of the regional seismicity according to Engdahl 2006), and simulated an infinitely long and deep fault. Using the Okada (1985) analytical solutions, we jointly inverted all profiles of the three data sets for the fault dip, rake and slip rate by means of a non-linear, least-squares inversion algorithm based on the Levemberg-Marquardt approach, as described by Atzori (2009); the convention for dip, rake and strike angles is the same as Okada (1985). We used a value of 30 GPa for the Lamé constants. The comparison between observed and predicted data is shown in Fig. 3 for the three velocity maps. We tested also a 15-km-locking depth, obtaining very similar dip and rake and a 20 per cent slip rate increase as shown in Fig. S2. The parameter uncertainty (Fig. 3d) was estimated with 150 restarts of the inversion, adding, each time, a synthetic noise correlated in space according to InSAR data statistical properties (Atzori 2008); using this procedure we found that rake and slip are better resolved whereas the dip has a higher uncertainty. We obtained a best-fitting solution with an rms of 0.6 mm yr-1 for the ascending track 156, 0.6 mm yr-1 for the descending track 206 and 0.7 mm yr-1 for the descending track 435. In the Fig. S3 we show the histograms of the residuals velocities (observed-modelled).
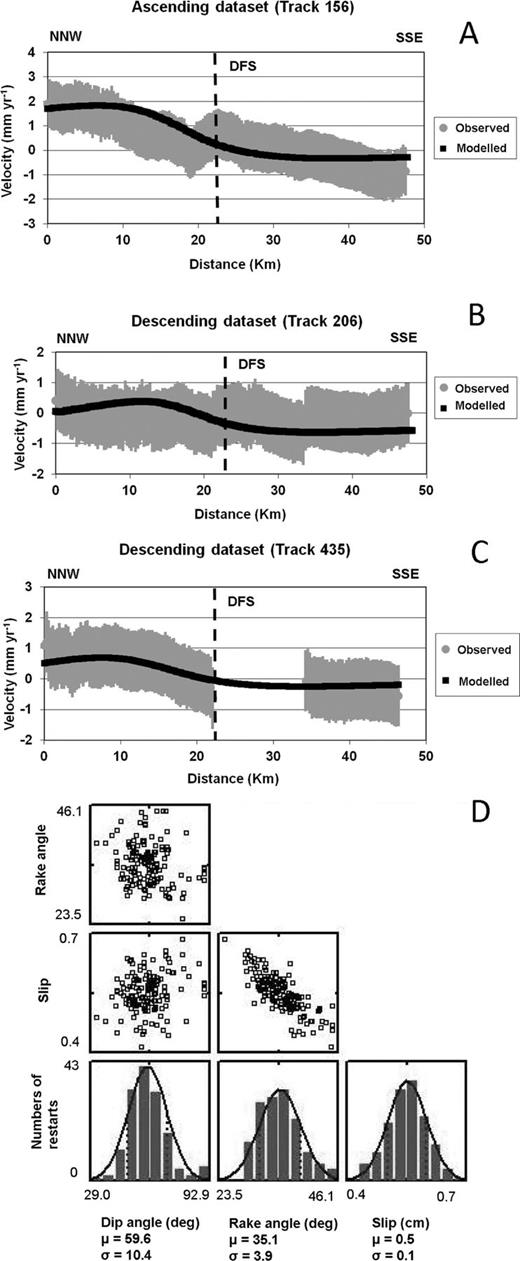
Observed (grey) versus modelled (black) velocity profiles for (A) ascending track 156, (B) descending track 206 and (C) descending track 435; dashed lines mark the intersection with the DFS trace. (D) (μ), standard deviation (σ) and trade-offs of inverted parameters, calculated as described in the text.
According to our modelling procedure, the WFZ fault plane is constrained by the InSAR observations to be north-dipping, with dip values in the interval 60 ± 11° and that for a locking depth of 12 km, the most probable slip rates are 5 ± 1 mm yr-1. The rake angle defines a left-lateral strike-slip, with a small compressive component (rake between 30° and 38°), although an anticorrelation between slip and rake is present (Fig. 3d).
4 Discussion and Conclusion
Our simple 2-D model is able to fit the observations quite well (Fig. 3). The inverted model parameters, while confirming the main characteristics of this sector of the DFS, give new information insights into the seismic potential of the fault.
Our model confirms the general left-lateral kinematics of the DFS, as first defined by Wellman (1966), but an additional important thrust component along the WFZ is necessary to fit the observations (rake angle of 34 ± 4°). The modelled rake angle results in the left-lateral component being about 2/3 of the slip rate, which is in agreement with the long term record as reconstructed by structural and geomorphic observations. A steep fault dip to the north (∼60°) is well constrained by the observations, and is in agreement with field observations on the western and central DFS.
Our modelled slip rate of 5 ± 1 mm yr-1 is the first quantitative estimate of strain accumulation for the western DFS, corresponding to ∼4 mm yr-1 of pure horizontal movement (along the fault strike: 255°). In the long term, Fattahi (2007) estimates ∼2.4 mm yr-1 of left-lateral slip rate on the CFZ, by infrared stimulated luminescence dating of one Holocene alluvial fan, at longitude 58°10′. Although this is so far the only geological slip rate available for the DFS, it cannot be extended to the entire length of the DFS. In fact, there are many geological and geomorphological evidences that the maximum rupture length of a single earthquake along the DFS system is ∼100 km (Fattahi 2007; Farbod 2011).
The transpressive character of the WFZ resulting from our model is in agreement with the kinematic model proposed by Farbod (2011), in which the slip vector of WFZ is compatible with those of the left-lateral strike-slip DQF and of the reverse KF (Fig. 1c). Indeed the topography along the fault trace is suggesting a long-term uplift of the northern block (Fig. 1). In our model, the anticorrelation between the slip and rake indicates that some vertical component (rake >0) is needed to explain the observations, otherwise the slip rates for pure strike-slip fault would be unrealistic (with respect to the geological estimates). There are no geological estimates of Quaternary uplift rate along the WFZ. Extrapolating the vertical component of our modelled slip rate (2.4 ± 1 mm yr-1) in the geological past does not seem to justify the relatively low relief across the WFZ (500–700 m). On the other hand, geological and geodetic slip rates often show differences (e.g. Fialko 2006; Elliott 2008), which could be because of a number of different factors, for example observation and/or model uncertainties, spatio–temporal slip rate variations, interaction with close tectonic structures.
At the regional scale, our slip rate and slip vector for the WFZ are in agreement with the sparse quantitative data available on the present deformation field (Vernant 2004). Our model implies a shortening rate across the WFZ of ∼1.3 mm yr-1, which is 1/4–1/5 of the total shortening accommodated between the Lut block and Eurasia, as measured by GPS networks (Vernant 2004). This result implies that other faults with similar rates of activity north of the Lut block accommodate the rest of this shortening.
Based on a geologically determined average slip per event of 4.7 m, the recurrence interval along the Central DFS has been estimated to ∼2000 yr (Fattahi 2007). The slip rate we estimated for the WFZ would require a slip per event of ∼10 m to obtain the same recurrence time. This is unrealistic, especially if we consider the field observations and the segmentation model by Farbod (2011). Accepting for the WFZ a similar slip per event as for the CFZ, including a conservative uncertainty estimate of 20 per cent, we obtain a recurrence interval varying between 630 and 1400 yr. The lack of strong seismicity in the last 1500 yr along the WFZ may be because of the incompleteness of the historical seismic catalogues (Ambraseys & Melville 1982), and our results show that recurrence intervals below 1000 yr cannot be excluded. Localized aseismic deformation (creeping) along the DFS trace may also justify the paucity of strong seismicity (as discussed by Farbod 2011), but higher spatial resolution geodetic data would be required to ascertain its presence. Further geomorphological and palaeoseismological investigations will give a more accurate assessment of slip rates, recurrence intervals and relevance of distributed strain mechanisms, providing the means to estimate the seismic hazard along this important active fault.
Acknowledgments
This work has been partially carried out under contract with the Agenzia Spaziale Italiana (SIGRIS project). GP was supported by the same project. We thank R. Lanari for providing the SBAS software. ENVISAT images were released under Cat1 project no. 5605. This study was partly carried under the frame of a cooperation agreement that permits to GP to stay in CEREGE during 3 months as visiting PhD student. We thank C. Faccenna for his help and encouragement and J.P. Merryman Boncori for his suggestions on SAR data interpretation.
References
