


Summary
Viscoplasticity has been considered to be a dominant element in causing the nucleation of shear instability leading to lithospheric weakening. Here, we propose that a simple contrast in shear moduli may be sufficient for explaining the fast timescale asymmetric shear instability in a bimaterial setting. Not much attention has been paid to heterogeneous elasticity in geodynamical modelling because it is dominant only for short timescales. Up to now, no studies have been made on asymmetric shear instability induced by elastic modulus contrast. Thermal-mechanical numerical simulations based on high-resolution (from 0.4 km x 0.4 km to 0.2 km x 0.4 km meshes) finite-element methods were performed to understand the effects of shear modulus contrast on inducing asymmetric instabilities. Strain-rate and stress-dependent rheology are used with a wide range of activation energy 0-850 kJ mol-1 for all models. Numerical results with enough shear modulus contrast show asymmetric shear instability, which is generated around the interface and then propagates across the interface. Two parts of the lithosphere with different shear moduli (stiff for higher and soft for lower shear modulus lithospheres), which are simply connected to each other without a pre-defined weak zone, were compressed at a constant rate of 2 cm yr-1. Having different shear modulus is justified by chemical heterogeneity of geological minerals and their pressure-temperature dependence. To explore the dynamical effects generated by the contrast in the elastic modulus, the shear modulus of the soft lithosphere is fixed at 32 GPa, whereas that of stiff lithosphere is increased systematically from 32 up to 640 GPa. We also examined the role of activation energy (0-850 kJ mol-1) on the geometrical pattern and the initiation time of asymmetric shear localization. The shear modulus contrast has to be close to two for triggering asymmetric shear instability and is found to be by far a more important controlling factor in causing shear instability than activation energy of the creep law. The instability develops rapidly between 250 000 and 500 000 yr after deformation begins, and thermal weakening in the shear zone is greater, when a stronger shear modulus contrast is prescribed. Our work suggests that initiation of lithosphere-scale asymmetric instability would be faster than previous considerations. Our finding stresses that naturally occurring shear modulus contrast has also important impact on many geological problems related to bimaterial instability.
1 Introduction
Shear localization due to thermal-mechanical positive feedback has been investigated for a long time as a potential mechanism for the generation of shear zones and deep focus earthquakes (Ogawa 1987). Complex viscoplastic rheologies (Kameyama 1997; Branlund 2001), a pre-defined fault or weak zone (Toth & Gurnis 1998; Doin & Henry 2001) and also sediment loading on passive margins (Regenauer-Lieb 2001) have been thought to be important elements giving rise to unstable shear-heating instability at convergent plate boundaries.
However, these investigations have commonly assumed an imposed weak zone, complex plastic rheologies related to water content (Regenauer-Lieb 2001) and other weakening processes (Yamasaki & Seno 2003; Mizoguchi 2006), such as a velocity-dependent frictional coefficient (Fukuyama & Madariaga 1998; Goldsby & Tullis 2002). To improve on these models, plastic strength and shear localization for crust and mantle rocks were extensively studied with constraints drawn from laboratory experiments and field studies. For instance, Karato (1998) reported that a significant plastic strength drop occurs during the phase transition from olivine to ringwoodite due to grain size reduction. Obata & Karato (1995) also noted that shear localization is promoted by high stress and low temperature, which corresponds to the environment of cold subducting slab.
Since elasticity is dominant over short timescales, viscoelasticity, which prevails for long timescale dynamics, has been widely adopted to investigate the nature of subduction zones (Zhong & Gurnis 1995; Billen & Gurnis 2001; Billen 2008). Thus, the role of elasticity has been downplayed and thought as being less important component compared with viscoelastic behaviour in long timescale problems, such as subduction. Except for some short-timescale studies (e.g. Weertman 1980; Adams 1995; Ben-Zion 2001, 2012; Brietzke & Ben-Zion 2006), most researchers in geodynamical modelling have not paid enough attention to the contrast in elastic properties as triggering mechanism for thermal weakening. Shear localization caused by the contrast in elastic property is not well-understood and thus a systematic study of its fundamental effect in shear instability is necessary.
The shear modulus depends strongly on the type of mineral and pressure-temperature condition (Jackson & Liebermann 1974; Wentzcovitch 2004), and the presence of solid-state phase transition (Stølen & Trønnes 2007). Shear modulus of minerals have been derived from first principle calculations dealing with thermodynamics and the relationship between S- and P-wave velocities.
The most popular and easiest example about bimaterial Earth materials is that concerning oceanic and continental lithospheres because they are composed of different minerals with different shear moduli. Feldspar, pyroxene and olivine which compose oceanic lithosphere have about three times larger shear modulus than quartz which is main composition of continental lithosphere (Hacker 2003). However, the shear wave velocity contrast between the oceanic and continental lithospheres varies by a small percentage (Levander 2007). This may indicate that the shear modulus contrast between oceanic and continental lithosphere is too small to initiate an asymmetric shear instability. However, from seismology short-wavelength heterogeneity is difficult to be imaged, but common along the margins of continental lithosphere (Yoshimoto 1997), such as from intrusion of granite into basaltic outcrops along the Chinese eastern coast in Guangdong and Zhejiang. Short-wavelength heterogeneity from seismic inversion does not show convincing correlation because it is difficult to be imaged due to sensitivity to the type of data and damping algorithms used for seismic inversion (van der Hilst 1997). Thus, it is possible that small-scale heterogeneity undetectable from seismic imaging can produce the short-wavelength thermomechanical instabilities, which can initiate a whole long-wavelength process. The diffusion and propagation of the instability, from small wavelength to lithospheric wavelength scale, are important and represents a promising mechanism for explaining large-scale shear instability. The concept that small-scale heterogeneity causes large-scale instabilities is widely applied to many previous studies dealing with viscoelastic lithosphere. For example, Regenauer-Lieb & Yuen (1998) employed the small-scale (about 5 km x 5 km) notched zone on the top surface for the ductile faulting in whole spatial and temporal domains. A small and low viscosity seed for generating the instability throughout whole domain is also used in many studies such as by Huismans & Beaumont (2002).
When the shear moduli of two neighbouring materials [i.e. bimaterial (Rosakis 1998; Ben-Zion & Shi 2005)] have a sufficiently large contrast, applied forces and consequent deformations around the interface may be considerably different over short timescales (Ben-Zion & Shi 2005). Thus, elastic shear modulus contrast may play an important role in short timescales in bimaterial systems, this poignant issue should not be overlooked in shear instability. The word of shear instability means the localized storage and fast release of elastic energy. We concentrate our attention on the effect of shear modulus contrast on generation of the asymmetric instability at a bimaterial interface. In particular, our study investigates (1) the timing, (2) the intensity of asymmetric instability and (3) its geological implications for initiation of weak zone and making it favourable for large-scale deformation in plate boundary. To understand lithospheric-scale large deformation, it is absolutely essential to study the thermal weakening of lithosphere and determine the features of instability such as timing, intensity and their developed asymmetry. In brief, our main aim is to understand the nature of asymmetric shear instability as a consequence of the shear modulus contrast.
2 Model Setup and Numerical Methods
We examine the development of asymmetric shear instability around the interface of bimaterial with elastoplastic rheologies under an imposed constant compression by using 2-D fully coupled thermal-mechanical FEM (Finite Element Method) code Abaqus/Standard (Hibbit, Karlsson and Sorenson Inc. 2009) under the plane strain assumption. The rectangular domain is 150 km deep and 600 km wide. The left (in red colour) and right (in blue colour) domains have different shear moduli, but have the same plastic rheology (Fig. 1). Red and blue regions are, respectively, soft and stiff lithospheres with small and large shear moduli. More than 0.5 million heterogeneous Lagrangian quadratic type elements with highly resolved mesh (0.2 km x 0.4 km) around interface and the region under the constant stress loading and coarse mesh (0.4 km x 0.4 km) in other places have been prescribed. No weak zone, fault and notched zone for plastic instability nucleation have been prescribed, and the left and right sides are just attached as a frictionless interface. A free-surface boundary condition (i.e. no surface traction stress) and zero-horizontal-velocity boundary condition were applied at top and left boundary, respectively. The bottom is not allowed to move vertically. But if this model is applied for long timescale problem, then dash-pot element is needed to mimic the isostatic restoring force (Regenauer-Lieb 2001), but this is a short timescale problem of O(100) Myr duration and thus a vertically fixed bottom boundary should be appropriate. In the energy equation, all boundaries are thermally insulated. In modelling subduction, the free-surface case (e.g. Gurnis 1996) has been employed for reproducing the deformation of overriding plates above the slab. Since asymmetric lithospheric deformation is extremely essential, the free-surface boundary condition is definitely suitable. Calculations with both a free-surface boundary condition and a free-slip condition are found to differ not too much in this and other comparative studies (OzBench 2008).
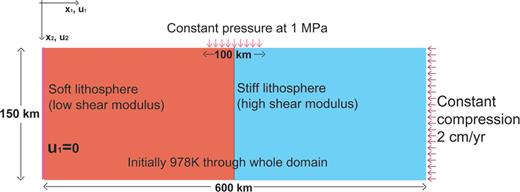
Domain of our 2-D FEM model with a 600 km width and 150 km depth under the plane strain assumption. We have used 0.5-1 million elements with irregularly spaced gridpoints. Constant velocity boundary condition 2 cm yr-1 is imposed at right-side boundary. Free surface boundary condition and zero horizontal velocity boundary condition are used at top and left boundary, respectively. The left and right portions have different elastic shear moduli. The left part with smaller shear modulus and the right part with larger shear modulus correspond to soft and stiff lithospheres, respectively. The boundary between the two different lithospheres has no frictional mechanism.
A constant and tiny pressure of 1 MPa is prescribed along a 100 km horizontal strip at the top of the domain. If we convert this value of pressure into sedimentary loading, which is a popular reason for initiating shear instability, the pressure corresponds to a sediment thickness of less than 0.1 km with a density of 2700 kg m-3. Strictly speaking, a small sedimentary loading is not required for generating asymmetric instability. The strength and initiation timing of asymmetric shear instability is very similar, regardless whether the loading is applied or not. However, the solution has a tendency to diverge, when a high shear modulus contrast (i.e. Rs > 10) is imposed without sedimentary loading at the surface. This convergence problem is caused by step-function due to the stress jump at the interface from the high shear modulus contrast. The sedimentary loading acts as a buffer against the abrupt stress jump at the interface of the bimaterial lithosphere. The solution is consequently stabilized under a high enough shear modulus contrast.
We will focus on the dynamical effect of shear modulus contrast (Rs= shear moduli of stiff/soft lithospheres) on thermal instability. The values of Rs are systemically varied from 1 to 20. To find out more about the effect of shear modulus contrast, Young modulus (100 GPa) and Poisson ratio (0.3), which are other important elastic properties, have been maintained constant for both materials in all models. The time interval of all calculations ranges from 1 to 4 Myr, and the time step is automatically selected as between 10-5 s and 1000 yr with full Newtonian iterative implicit scheme. The smallest time steps are employed in the initial stages, which last a very short time.
Time-integration dealing with partial differential equations can be divided into implicit and explicit schemes. Implicit scheme can have numerical stability, regardless of the size of time stepping for a given tolerance (i.e. 10-6), but requires much computational cost for solving non-linear stiff problem. On the other hand, explicit scheme holds numerical stability with much less computational cost per time step (Regenauer-Lieb & Yuen 1998), but needs very small size of time step and then consequently requires too many time steps for the entire run. Additionally, the dynamic problem which has short timescale is best solved by using an explicit scheme. The dynamic problem with multiple timescales cannot be solved completely with only one scheme. In recognition of this fact, the implicit-explicit (IMEX) mixed method was recently developed for efficient and accurate calculation (Kennedy & Carpenter 2003; Constantinescu & Sandu 2010). The adaptive scheme for selection, which depends on timescale of problem and/or the IMEX scheme should be used to understand fully the instability induced by the elastic contrast, because this instability develops with a multiscale resolution manner in time (So 2011).
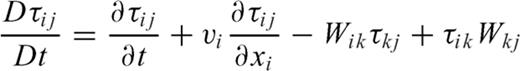
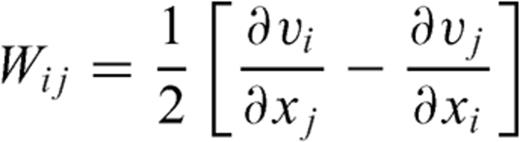
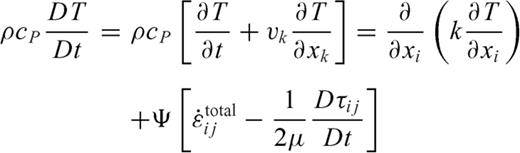
 and vi are deviatoric stress tensor and i-direction velocity of displacement, respectively. Wij is spin rate defined by eq. (2). Eq. (3) represents the evolutionary energy equation with thermal-mechanical coupling. The second term of right-hand side of eq. (3) denotes the viscous dissipation.
  indicates the efficiency of conversion between the plastic strain-rate and shear heating (Regenauer-Lieb & Yuen 1998). The last term on the right-hand side of eq. (3) represents the coupling between temperature and plastic strain-rate.
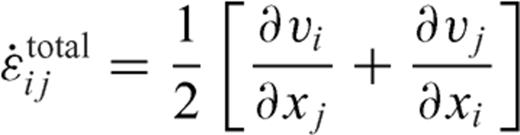
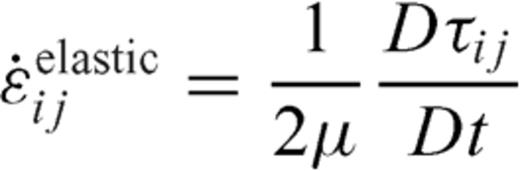
 is simply the sum of elastic strain-rate
  and plastic strain-rate
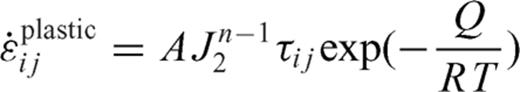
  (see eqs 4-7). J2 (eq. 6b) represents the second invariant of deviatoric stress tensor. We have employed the Von Mises yield criterion with a yield strength
  . This simple Von Mises criterion has been used to define the moment of failure, when the material is not deforming elastically and provides an appropriate assumption for studying multiscale fault mechanics (Moresi & Solomatov 1998). We use a yield strength of 100 MPa. If the second invariant of deviatoric stress tensor is larger than yield strength, the temperature and stress-dependent plastic rheology (eq. 6a; Glen 1955; Hutter 1983; Karato 2008) is activated and the total strain-rate becomes then the sum of elastic and plastic strain-rates (eq. 7). The activation energy and deviatoric stress-dependent, plastic strain-rate are set to be the same in the two materials. The values of the parameters are given in Table 1.
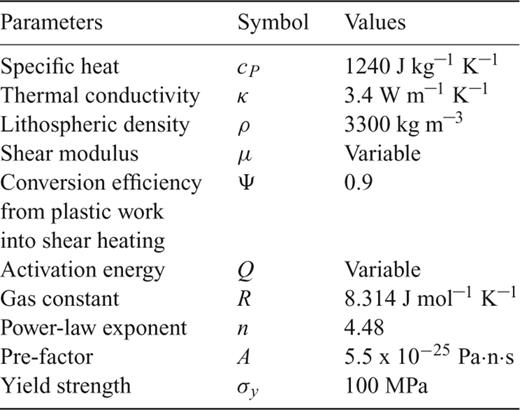
Input parameters.
The right-hand side (stiff) of the computational domain is set to have a larger shear modulus than the left side (soft) in all models. In many studies, a soft crust (e.g. continental crust) is depicted as having quartz-rich composition with a shear modulus of about 40 GPa (Hacker 2003; Henderson & Henderson 2009). On the other hand, a stiff crust (e.g. oceanic crust) contains feldspar, pyroxene and olivine-rich composition of 100–120 GPa shear modulus (Yeganeh-Haeri & Ito 1989; Henderson & Henderson 2009). If we use the concept of asymmetric instability from shear modulus contrast, we may support generation of asymmetric instability and weak zone around the boundary where shear moduli are changed. Oceanic–continental passive margin and subducting slab under conditions of pressure–temperature changing and phase transition (Hill 1952) are good candidates for this type of boundary. van Hunen & Allen (2011) concluded that the collision of positive buoyant continental crust induces a strong extensional strain and subsequent slab detachment. However, if we introduce asymmetric instability due to shear modulus contrast, the generation of shear zone that represents the seed for slab detachment can occur without any special tectonic intervention (e.g. collision of buoyant lithosphere).
Strictly speaking, the assumption that two different lithospheres have the same mechanical thickness and plastic properties may not be entirely realistic. However, our aim is to investigate simply the effects of Rs on the development of asymmetric instability. For this purpose, the simplification can be justified.
Pre-processing, such as meshing and post-processing, are performed using Abaqus CAE (Computer Aided Engineering). We used the Abaqus/Standard version 6.9.2, which was installed on a Sun-Blade at the Minnesota Supercomputing Institute together with a Linux clustering server with 16 Intel Xeon quad-core CPUs in the Seoul National University.
3 Description and Discussion of Results
3.1 The nature of the asymmetric shear instability within a bimaterial lithosphere
The temporal development of the temperature field over time is plotted for a constant compression rate (2 cm yr-1) at time of 1 Myr. Fig. 2 shows temperature distribution for Rs= 1 (e.g. no shear modulus contrast) where the shear moduli of stiff and soft lithospheres are the same at 32 GPa. The symmetric instability is facilitated by pressure applied at the top and a constant horizontal deformation imposing from the side. No asymmetric shear instability is observed in the case of Rs= 1. Even when the deformation was continued up to 4 Myr and activation energy was lowered down to zero, asymmetric instability at the interface did not develop in the Rs= 1 case. There is then no possibility that nucleation of weak zone. In addition, no asymmetric deformation feature appears at all in the case of Rs= 1. The influence of the elasticity (e.g. Young's modulus) of the whole plate has been investigated in other previous studies. However, they concluded that the elastic modulus has a small effect on large-scale subduction motion and stress fields within subducting slabs (Capitanio 2007). On the other hand, we introduce bimaterial lithosphere having shear modulus contrast within it to generate the asymmetric shear instability. This approach is novel and distinguishes itself from all other previous works in that they only focused on a homogeneous elastic plate without considering any thermomechanical coupling.
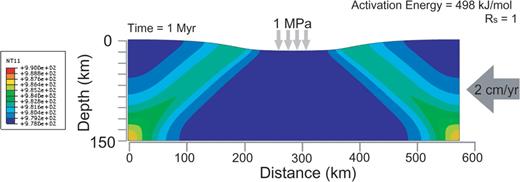
The rainbow colour contours show the temperature distribution. Symmetric instability with same shear moduli in soft and stiff lithospheres occurs at 1 Myr. Symmetric thermal instability occurs in both parts because of the constant vertical pressure. Asymmetric deformation does not appear.
Figs 3(a)-(c) illustrate the thermal field for Rs= 3 and 498 kJ mol-1 activation energy for different time steps. A quasi-symmetric instability is usually generated at an early stage (before 0.34 Myr). Then the seeds of asymmetric instability (see red circle in Fig. 3a in the left bottom and the right top of the domain) appear. Eventually, the instabilities extend to the bottom and top, and merge at 0.41 Myr. We envisage that this asymmetric instability may be capable of producing quickly a shear zone, which may lead to rapid deformations at plate boundary. We believe that the asymmetric instability becomes more coherent with the passage of time. In Fig. 3(c), the asymmetric deformation, which resembles a form of obduction and subduction, is observed. Subduction and obduction like features are shown in both the right and left sides of the domain, respectively. In Fig. 5(A-c) representing the case of 200 kJ mol-1 activation energy and Rs= 3, a stronger asymmetric instability is generated with a smaller activation energy. The steeper underthrusting angle (i.e. meaning stronger asymmetric deformation) in the stiff lithosphere side is shown in the case of lower activation energy.
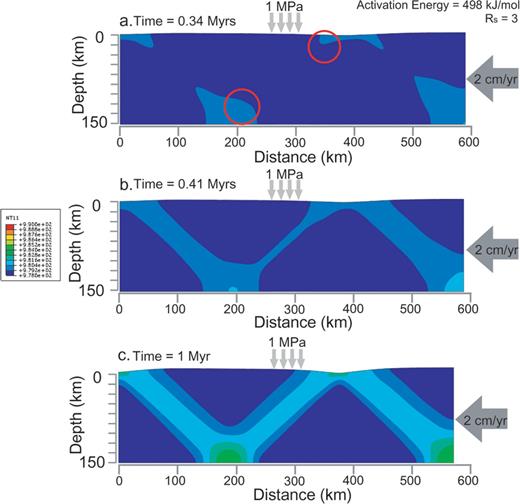
The rainbow colour contour shows temperature distribution. (a) Nucleation of asymmetric instability. The seeds for asymmetric instability (red circle) are nucleated on bottom and top of the domain at 0.34 Myr. (b) Growing of asymmetric instability. The thermal instabilities from both and top run towards each other and merge in centre at 0.41 Myr. Shear localization is clearly observed clearly. (c) Maturing of asymmetric instability at 1 Myr. The asymmetry instability becomes stronger and stronger with time. This process matures and localizes the asymmetric instability.
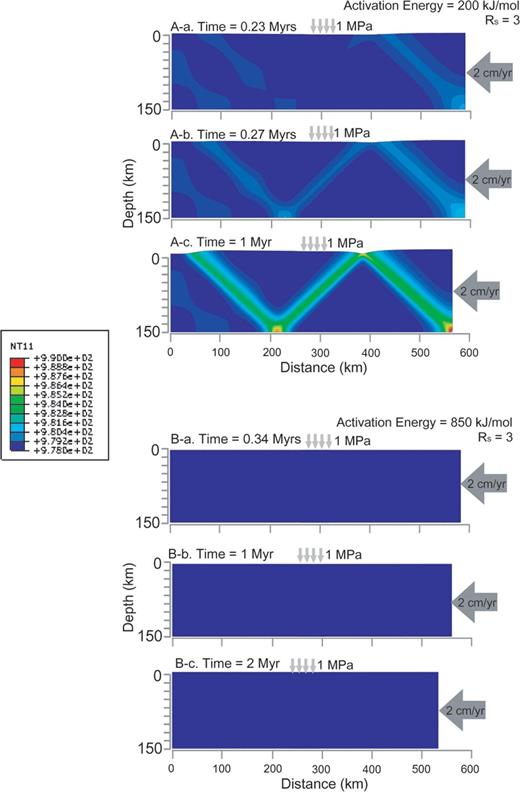
(A) (a-c) The case of low activation energy (200 kJ mol-1 with Rs= 3). It shows that ∼0.11 Myr faster and ∼3 K hotter asymmetric instability develops than for the 498 kJ mol-1 model. (B) (a-c) Time history of temperature distribution in the calculating domain of the case of high activation energy (850 kJ mol-1 with Rs= 3). It shows just the elastic deformation rather than plastic deformation.
Fig. 4 demonstrates the initiation time for activation energy of 498 kJ mol-1 with different values of Rs. If Rs is smaller than 1.7, no asymmetric instability is produced with any activation energy. This result argues that there exists a critical shear modulus contrast for asymmetric instability. As mentioned previously, the shear modulus of lithospheric minerals can be changed by state variables, such as pressure and/or temperature; the shear modulus can be calculated or measured as a function of temperature and pressure (Hill 1952; Anderson 1992; Bina & Helffrich 1992). Consequently, thermal-mechanical instability induced by shear modulus contrast is highly feasible in nature. A large variation in initiation time (∼0.5 and ∼ 0.3 Myr for Rs= 1.7 and Rs= 4, respectively) occurs between Rs= 1.7 and 4. Beyond Rs= 4, the initiation time of the instability appears to converge rapidly to about 0.25 Myr. In laboratory experiments and calculations, shear modulus can be varied by up to factor of 5 or more with temperature and pressure (Berckhemer 1982). Therefore, such a shear modulus variation is possible and hence the instability is highly feasible. We have found that asymmetric instability in the soft-stiff lithospheric boundary may occur at timescales much shorter than 1 Myr. This short timescale of around 1 Myr does not mean the timing of a mechanical break-off, but rather the timescale for creating a thermally weakened zone.
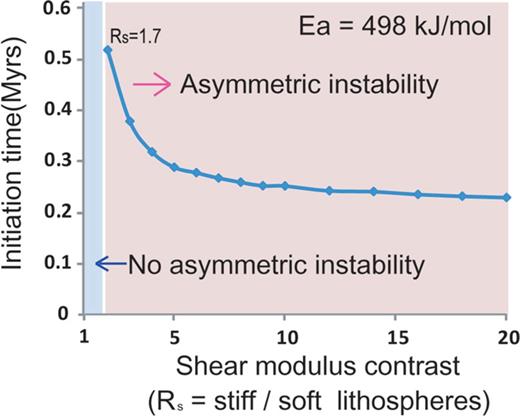
Initiation times of asymmetric instability with varying shear modulus contrast, Rs, from 1 to 20. No asymmetric instability occurs in the blue region with small shear modulus ratio.
To investigate the effect of activation energy, we applied unrealistically large and small activation energy values of 850 and 200 kJ mol-1, respectively. In Fig. 5 shows a time sequences of temperature profile, the case of lower activation energy (200 kJ mol-1, Rs= 3, see Fig. 5A) has a faster asymmetric instability than other cases. It is ∼0.11 Myr faster and ∼3 K warmer than that of 498 kJ mol-1 with Rs= 3. Above 800 kJ mol-1 (e.g. 850 kJ mol-1 with Rs= 3, see Fig. 5B), the asymmetric feature is not produced perhaps because of a too low plastic strain-rate. Even though the time domain is expanded up to 2 Myr (see Fig 5B-c), it is difficult to generate shear heating with attendant shear localization due to the large activation energy. It has been shown that the lower the activation energy, the earlier the initiation of asymmetric instability. This is similar to what was found for listric faults (Regenauer-Lieb 2004); so we can conclude that strong shear localization is facilitated by a small activation energy.
To ensure the reliability of our calculation, we perform end-member modelling with the activation energy of 200, 498 and 800 kJ mol-1 under same Rs. Fig. 6(a) is temperature profile at 1 Myr with different 200, 498 and 800 kJ mol-1 activation energies. The case of lower activation energy (i.e. 200 kJ mol-1) induces a stronger instability. On the other hand, the maximum temperature is higher for low activation energy. Another interesting aspect of Fig. 6(a) is that the region of high temperature (the location of shear localization) becomes more localized for lower activation energy. The localization width is about twice as wide for strong than for weak activation energy. The narrower shear localization is more favourable weak zone for mechanical break-off. The depth of maximum temperature has a tendency to go deeper with decreasing activation energy. This suggests that more asymmetric deformation occurs with smaller activation energy. Stronger asymmetric instability due to lower activation energy induces larger plastic deformation along the interface. The stress guides underthrusts deeper (∼90 and ∼60 km in cases of 200 and 800 kJ mol-1 activation energies, respectively), when a stiffer lithosphere is underthrusting towards a soft lithosphere. The green line referring realistic activation energy (498 kJ mol-1) of olivine (Chopra & Paterson 1981) lies between the strong (800 kJ mol-1) and weak (200 kJ mol-1) cases. Thus, this finding lends confidence to this end-member investigation.
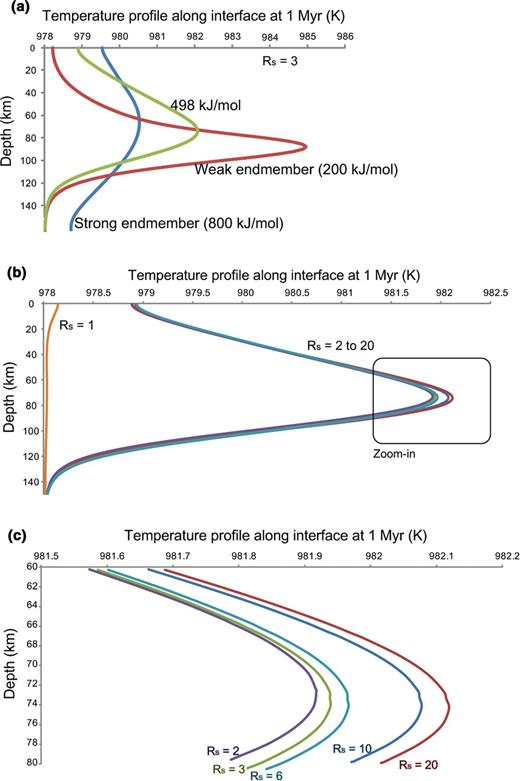
(a) The temperature profile along interface at 1 Myr with varying activation energy and constant Rs= 3. Blue line is result from strong end-member (800 kJ mol-1 activation energy) and red line is that from weak end-member (200 kJ mol-1 activation energy). Green line shows realistic case with rheology of 498 kJ mol-1 activation energy. (b) The temperature profile along interface with varying Rs, under 498 kJ mol-1 activation energy condition. The strength is varied with Rs. (c) The zoomed-in temperature profiles at the centre of instability.
In Fig. 6(b), temperature profiles along the interface at 1 Myr with 498 kJ mol-1 activation energy are plotted for Rs= 2 to 20. For Rs= 1, asymmetric instability is not observed. The maximum temperature becomes higher with increasing Rs. Fig. 6(c) is a close-up shot of Fig. 6(b). A strong instability develops for high Rs value. However, the variation of temperature rising with increasing Rs is just 1 K. We need to discuss further this small temperature change, which is growing consistently with increasing Rs.
In our 2-D simulation, we find a small temperature increase; this result is in contrast to Ogawa's classical 1-D model. Ogawa (1987) reported that temperature arises up to 100-400 K, which is enough to melt subducting materials, leading to deep focus earthquake. However, this huge temperature increase is caused by long time span (i.e. more than 100 Myr) with a suppressed heat advection due to 1-D nature. In this context, it is easy to imagine that high-temperature anomalies in a shear zone are required for large deformation. However, considering the heat flow paradox in large strike-slip fault zone, no sharp anomaly in heat flow is observed in spite of very fast and significant fault movement (Brune 1969; Lachenbruch & Sass 1992). Brune (1993) stated that large instabilities can occur without substantially strength drop or temperature growing in the lithosphere, if the stress that is perpendicular to the boundary varies spatially and changes temporarily changed. The key focus of our study is not only the analysis of heating in the shear zone, but also heterogeneous stress distribution change caused by the shear modulus contrast. In brief, shear modulus contrast causes both higher temperature in shear zones and larger stress differences around the boundary, which enhances initiation of the weak zone. We propose that heterogeneous stress distribution around the interface of bimaterial lithosphere due to larger shear modulus contrast causes:
- 1
the asymmetric instability; and
- 2
the weak zone which induces large deformation.
These two points mean that this mechanism can cause large instability in the latter stage because of larger stress difference and the positive thermal-mechanical positive effect (Hobbs 2010), although the temperature increase is smaller (less than 1 K, in Fig. 6c) with increasing shear modulus contrast.
The occurrence of asymmetric instability with activation energy and Rs has been mapped out (Fig. 7). To validate our findings, we have employed a grid set composed of Rs and activation energy for delineating the extents of each mode. The increments are 0.5 and 50 kJ mol-1 for Rs and activation energy, respectively. In Fig. 7, three different modes, S (Stable; red zone), FU (Fast Unstable; green zone) and SU (Slow Unstable; blue zone), are defined. S mode is the case that there is no asymmetric shear instability during the calculation (see Fig. 2). Because of the high activation energy and the low shear modulus contrast, no asymmetric shear instability occurs, even though the geological time is lengthened up to 4 Myr. The region of S modes indicates that the required Rs for asymmetric instability is larger than 1.7 even with zero activation energy. Additionally, no asymmetric instability occurs when activation energy is higher than 850 kJ mol-1. The value of 850 kJ mol-1corresponds to a lithosphere too stiff for promoting sufficiently large plastic strain.
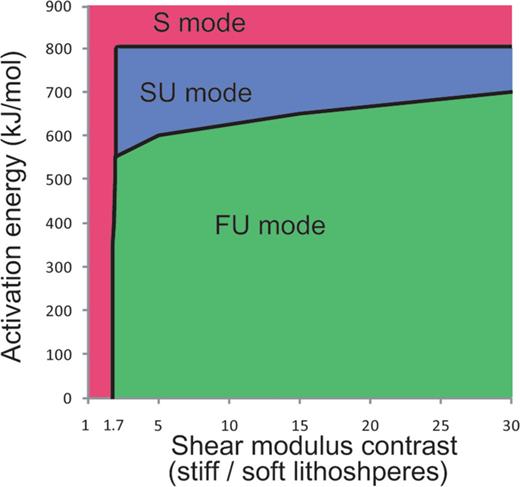
Domain map of asymmetric instability with parametrized activation energy and shear modulus contrast. S mode (red zone) means stable mode that no asymmetric instability despite of long timescale (4 Myr).The unstable group can be divided to two modes, FU (fast unstable; green zone) and SU (slow unstable; blue zone), in terms of the initiation time of asymmetric instability, before or after 1 Myr.
FU and SU modes represent the cases that have an apparent asymmetric shear instability. However, the time for the maturing shear instability, which refers to the time when temperature increment is 2 K greater than compared with the initial state, differs with Rs and activation energy. We define the FU mode that the time for maturing is faster than 1 Myr. Conversely, the SU mode indicates that the maturing time is slower than 1 Myr. The notable aspect in these two unstable modes is the big difference in the areas covered by each mode. The large territory of FU mode suggests that Rs has a dominant effect on the speed of instability development. In short, fast timescale asymmetric instability (<1 Myr) is generated under wide range of activation energy and can be controlled by a sufficiently large shear modulus contrast.
This asymmetric bimaterial instability occurs because of a substantial difference in shear moduli of continental and oceanic lithospheres, where the change in applied forces and torques at the boundary leads to asymmetric bimaterial viscoelastic instability. The distortion and larger differential stress eventually leads to shear localization. According to our results, a large shear modulus contrast facilitates the development of lithospheric necking and fault instability.
We have not ruled out that the bimaterial instability may come from density contrast between stiff and soft lithospheres, not only from shear modulus contrast, as discussed in previous study (e.g. Nikolaeva 2010). However, in our model with a short duration of calculation, we have not included the density contrast between stiff and soft lithosphere within the framework of a viscoelastoplastic rheology. In further study using a more complete numerical set-up, both shear modulus and density contrasts between stiff and soft lithospheres will be required to unravel the fundamental causes of the bimaterial instability and its implications for geodynamics. State variable change (e.g. pressure and temperature) and phase transition cause not only shear modulus change, but also sharp density variation (Lee 2003). We should consider both shear modulus and density contrast taken together.
3.2 Effects from other aspects of lithosphere on the instability
To investigate additional features of asymmetric shear instability developed in realistic nature, the simple geothermal gradient and the difference of yield strength between stiff and soft lithospheres are employed to our model. Previous studies (Ogawa 1987; Regenauer-Lieb & Yuen 1998) have used initially a constant temperature distribution to observe pure effect of pre-defined shearing boundary condition and geometrical perturbation such as notched zone. Consistently, we also have employed constant temperature distribution in our study. However, the rheology depends significantly on temperature and thus a depth-dependent temperature must be introduced. Additionally, the deviatoric stress for plastic yielding may be different in stiff and soft lithospheres. Low yield strength is prescribed to the soft lithosphere, and vice versa. On the other hands, Poisson's ratio is also an important elastic property, which may influence on the asymmetric shear instability.
3.2.1 The difference in yield strength of bimaterial lithosphere
Many previous studies (e.g. Andrews & Billen 2009) have suggested that the yield strength of the lithosphere controls the ultimate fate of deformation and large-scale motion. Although our main aim is to investigate the asymmetric shear instability from shear modulus contrast in a bimaterial lithosphere, distinguishing the influence of shear modulus contrast and yield strength difference in bimaterial lithosphere is an important issue. Fig. 8 shows the shape of deformation and the shear instability at 1 Myr in cases that different yield strength and the same shear modulus (i.e. Rs= 1) are prescribed. The shear instability and the deformation appear to be localized in the soft part (see Fig. 8). This also shows a strong asymmetry, but the shape is completely different with models with same yield strength and different shear moduli. Relatively small difference of yield strength, even just few per cent, can trigger the shear instability. The deviatoric stress level reaches more quickly to yield strength in the lithosphere of lower yield strength; it leads to single set of shear zone in soft lithosphere. The elevated height on the top surface is plotted in Fig. 9. We can recognize that the deformation is sharper and more uplifted with a larger difference of yield strength between two lithospheres in Fig. 9. The different feature compared to the instability from shear modulus contrast is that the strength of the instability is weaker, for a larger difference in the yield strength. In cases of the instability from shear modulus contrast, higher shear modulus contrast induces stronger instability. The soft lithosphere with the weaker yield strength develops much more quickly the plastic strain. It means that less elastic energy is stored due to the lower yield strength. This result can be the important key for revealing on heat flow paradox, which was first proposed by Brune (1969). Heat flow paradox is an enigmatic geophysical phenomenon, questioning why heat flow is very low in a narrow zone, where large shear heating is expected such as San Andreas Fault and subduction areas. We propose that the large difference in yield strength in bimaterial induces large deformation (see Fig. 9a), but a lower temperature in the shear zone (see Fig. 8a). It can be one plausible reason for the heat flow paradox.
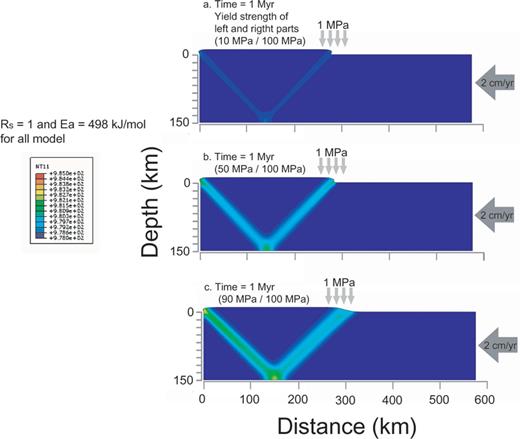
Shape of deformation and the shear instability at 1 Myr in cases with different yield strength. Rs and activation energy are fixed a 1 and 498 kJ mol-1, respectively. (a) Yield strength of left and right parts = 10/100 MPa; (b) 50/100 MPa; (c) 90/100 MPa. All cases are consistently showing a single shear zone of the part with a lower yield strength.
![Elevated height on the top surface. (a) Yield strength of left and right parts = 10/100 MPa; (b) 50/100 MPa; (c) 90/100 MPa. The case of largest difference [i.e. case (a)] in yield strength shows the sharpest deformation of the top surface.](https://oup.silverchair-cdn.com/oup/backfile/Content_public/Journal/gji/190/1/10.1111/j.1365-246X.2012.05473.x/2/m_190-1-23-fig009.jpeg?Expires=1749873742&Signature=OZnaI57GPC6E-e9YQ-NvG34webzFcIjX0OnluvJlnmI-uVnyQa0tArYk3c2sCdFtstosMljPfPdbmU5If~Qhk~Ojxm2ia43jzknNX5Xq3oJ-uGiRlZOks0QSMeZK7S926n0PgEvSJTA~raxpmRw1R5oGCijFLBVHg8t-qbghz3BHRo381PV23MBl8pipU89xO9fQyCBYlsK8uTP5RAZc8WkHhZHQLGYVuNtgb1hIq55aPobdBq9lqRwtS2qNQp~vv9T5Wts-xJQ~4hnsmVqo6P3~EDn9beH81IBQwOmgvddeY4lCHAUVX2SMch8~y4XSvG1S84OsSeecyg~cfGw-dw__&Key-Pair-Id=APKAIE5G5CRDK6RD3PGA)
Elevated height on the top surface. (a) Yield strength of left and right parts = 10/100 MPa; (b) 50/100 MPa; (c) 90/100 MPa. The case of largest difference [i.e. case (a)] in yield strength shows the sharpest deformation of the top surface.
We have performed modelling with both differences in yield strength and shear moduli of bimaterial lithosphere to understand the interaction between two elements. Fig. 10 shows the results of the cases with Rs= 3 and varying the difference in yield strength. The yield strength of 100 MPa for stiff part is constantly applied, and the yield strength of soft part is changed (i.e. 10, 50, 90 and 100 MPa). The asymmetric instability due to the yield strength difference (similar features in Fig. 8a) is predominant, when its value is greater than around 10 MPa. Otherwise, the asymmetric instability from Rs prevails (similar with Fig. 3c), if the yield strength difference is smaller than about 10 MPa. Fig. 10 is associated with the coupling between the yield strength difference and Rs. Fig. 10(a) shows definitely the asymmetric instability from yield strength contrast. Otherwise, Figs 10(c) and (d) indicate the transient feature and fully Rs dominant feature, respectively. According to balancing between the yield strength difference and Rs in bimaterial lithosphere under compression or extension, we determined the shape of asymmetric instability. One feature we noted is that the initiation time and the strength of the instability are faster and weaker, respectively, when the higher yield strength difference is prescribed. This result is expected because a lower yield strength allows the material to give away quickly and not to store a large amount of elastic energy.
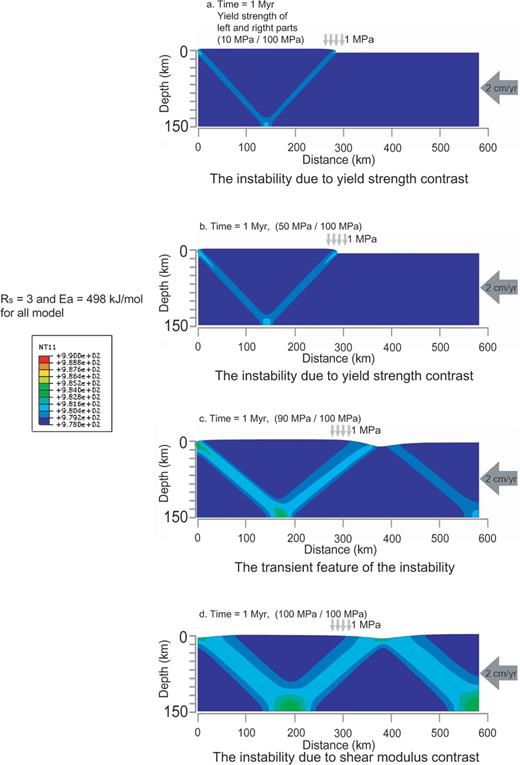
Shape of deformation and the shear instability at 1 Myr in cases with different yield strength. Rs and activation energy are fixed at 3 and 498 kJ mol-1, respectively. (a) Yield strength of left and right parts = 10/100 MPa; (b) 50/100 MPa; (c) 50/100 MPa; (d) 100/100 MPa.
The fundamental difference in shear moduli has an important implication on shear instability in bimaterial lithosphere. Considering separately the yield strength difference in bimaterial, we must also look at yield strength contrast in terms of the timing of plastic yielding for the different materials.
3.2.2 Effect from a geothermal gradient
The lithosphere is not thermally constant and has a temperature-dependent rheology. Thus, it is reasonable to test the effect coming from a simple geothermal gradient. As mentioned previously, our aim is to investigate pure effect of shear modulus contrast. Within this context, we have used a uniform temperature distribution, which is similar to that employed by Regenauer-Lieb & Yuen (1998). In that study by Regenauer-Lieb and Yuen, they already confirmed that depth-dependent temperature has minor effect in the case of the releasing of stored elastic energy with fast timescale. However, checking out the effect of geothermal gradient is important to emphasize the effect of shear modulus contrast. Therefore, the model with a simple linear gradient, from 273 K (the top) to a 1273 K (the bottom), is calculated under 498 kJ mol-1 activation energy and Rs= 3.
The left column of Fig. 11 (i.e. Figs 11a-c) is showing the influence of asymmetric instability with the geothermal gradient. The right column (i.e. Figs 11d-f), otherwise, represents the case with a uniform temperature. The temperature distributions of initial stage and 1 Myr are plotted in Figs 11(a) and (b), respectively. Due to asymmetric instability, the temperature field is perturbed at both top and the bottom (see Fig. 11b), similarly with Fig. 11(e). In terms of equivalent plastic strain, the general shape with and without the gradient are almost the same except for the strength. A slightly higher shear instability is observed in Fig. 11(c) than that in Fig. 11(f), which indicates that high temperature in lower part of lithosphere promotes the development of plastic strain. In addition, the initiation times of the asymmetric instability are very similar in these two cases (i.e. around 0.34 Myr with or without the geothermal gradient).
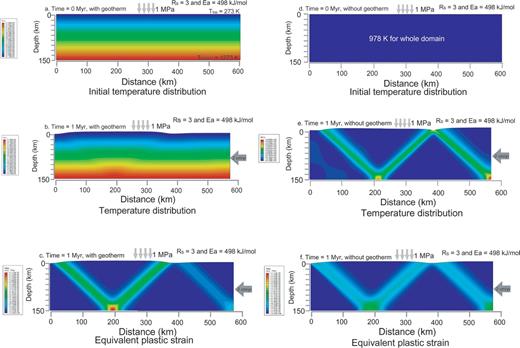
Comparison of the asymmetric instability between the cases with and without the geothermal gradient. The left and the right columns are showing the cases with and without the gradient, respectively. In terms of the magnitude of the plastic strain, two cases are similar.
3.2.3 Variation of the Poisson ratio for whole lithosphere
The Poisson ratio is also an important material characteristic, which can be varied by water content and volatile and less by varying by pressure and temperature. We have performed modelling using same Poisson ratio (i.e. 0.3), but the effect of Poisson ratio on asymmetric shear instability must be investigated. The models with Poisson ratios (e.g. 0.25, 0.3 and 0.37) are calculated under Rs= 3. The results show that Poisson ratios have a minor effect on the strength and the initiation time of the asymmetric shear instability. However, the magnitude of deformation after asymmetric instability differs dramatically with changing Poisson ratio and also in dimensionality. In Fig. 12, the smaller Poisson ratio has a tendency to induce larger deformation on the top surface. Dashed lines in Fig. 12 represent the elevation on the top surface at 0.1 Myr, which occurs before occurrence of the asymmetric instability. After generating and maturing of the asymmetric instability, the elevations rise quickly.
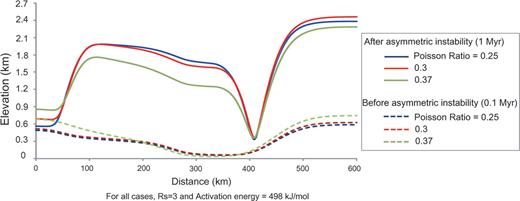
Comparison of the deformation on the top surface with varying Poisson ratio. Dashed line means the deformation for 0.37 (green line), 0.3 (red line) and 0.25 (blue line) of Poisson ratio before the asymmetric instability. Otherwise, solid lines refer to those after the occurrence of asymmetric instability.
4 Concluding Remarks
We have shown that the asymmetric instability can develop from shear modulus contrast of a bimaterial by using a series of high-resolution finite-element simulations with a Lagrangian mesh. Such an asymmetric instability can generate a localized shear zone around the interface of stiff and soft crusts. The shear zone plays an important role as a weak zone and may lead to lithospheric scale break-off (e.g. Gerya 2004). The higher the shear modulus contrast, the more likely asymmetric instability and deformation will be produced. We find that the thermally weak zone will develop more readily, when the activation energy is low and Rs is high. In particular, when R > 1.7 asymmetric instability will develop over a wide range of activation energy from 0 to 800 kJ mol-1.
Our study finds that the shear localization leading to generation of a weak zone may start as early as 1 Myr after plate convergence. Using the same activation energy as Regenauer-Lieb & Yuen (1998), the initiation times of shear localization in this study and previous work (Regenauer-Lieb & Yuen 1998) are 0.25-0.53 (with varying Rs from 20 to 1) and 0.725 Myr, respectively. The work of Regenauer-Lieb & Yuen (1998) had a notched zone, which refers the brittle fault in the top surface of the lithosphere; their work suggested that brittle fault triggers shear instability through the entire lithosphere. However, our model without a pre-defined notched zone also reveals asymmetric shear instability, which indicates that pre-defined shear modulus contrast can trigger the instability in the whole lithosphere. Moreover, the initiation of shear instability in our study is faster than previous work (i.e. Regenauer-Lieb & Yuen 1998). This result strongly suggests that shear modulus contrast has also important effect on shear instability generation. Moreover, the geometrical instability is completely asymmetric along the boundary, which can explain severe convoluted deformation around plate boundaries.
The development of asymmetric instability from variations in the lithospheric shear modulus is useful for explaining geological phenomena such as subduction initiation. Contrast in elastic parameters in the lithosphere is essential in the development of instability over short timescales. In addition to inherent mineralogical difference between continental and oceanic lithospheres, mineralogical phase transition (Dalguer & Day 2009) can cause significant shear modulus change and a consequent bimaterial shear instability can be generated.
Acknowledgments
This work was supported by the Korean government (MEST, No. 2009-0092790), Brain Korea 21 Project (through School of Earth and Environmental Sciences, Seoul National University) and also by the CMG program of the US National Science Foundation. We thank stimulating discussions with Professors Yehuda Ben-Zion and Shun-ichiro Karato, who helped us with nurturing the idea of bimaterial instability. Jed Brown is to be thanked for discussions concerning time integration. We appreciate the two anonymous reviewers for their careful critique.
References
