


Summary
On 2007 April 21, a Mw = 6.2 earthquake shook the Aysén Fjord, Southern Chile in an unprecedented episode for this region characterized by low seismicity. The area is intersected by the Liquiñe-Ofqui Fault System (LOFS), a +1000-km-long strike-slip fault that absorbs part of the oblique convergence motion between Nazca and South America plates. To study the aftershock sequence of this main event, we installed a seismic network of 15 stations in the area for a period of nearly 7 months. We characterized the seismogenic structure of the zone by calculating a minimum 1-D local velocity model and obtaining precise hypocentral coordinates and uncertainty estimates by using a non-linear probabilistic approach. We also obtained fault plane solutions based on first motion polarities and SV/P amplitude ratios. The velocity model shows an average Vp/Vs ratio of 1.76 for the area and low shear wave velocity values for the upper 3 km of crust. The aftershock seismicity was located mainly between 4 and 10 km depth and disposed in (1) an ∼N—S trending alignment that follows the trace of the LOFS and (2) an E—W alignment at the East of the main fault. Furthermore, we re-analysed the previously published foreshock and early aftershock activity of the sequence including four of its largest events, improving considerably previous location estimates. Selected focal mechanisms show a strong strike-slip component that coincides with the nature of the LOFS. Based on our new analysis we conclude that the 2007 Aysén seismic sequence had a tectonic origin related to activity on the southern end of the LOFS, however not discarding the presence and potential action of fluids on the aftershock activity.
1 Introduction
The world's largest recorded earthquakes have all taken place along subduction margins (e.g. Chile 1960, Andaman-Sumatra 2004 and Chile 2010). To comprehend in depth the stress distribution involved in these tectonic environments it is essential to gain a better understanding of occurrence and maximum possible magnitudes of earthquakes at any given segment of a subduction zone. Moreover, oblique subduction zones as in the case of Southern Chile commonly feature large strike-slip faults parallel to the trench that accommodate the oblique convergent motion; for example, the Atacama Fault in northern Chile (Cembrano 2005), Philippine Fault (Barrier 1991), the Sumatran Fault (Sieh & Natawidjaja 2000) and the Liquiñe-Ofqui Fault (Cembrano 1996, 2000, 2002), which is the subject of study in this work. Up to now not many geophysical studies have been carried out on these major trench-parallel strike-slip fault systems that, as in the case of the Sumatran Fault, have generated many historical earthquakes with magnitudes M ≤ 7 (Sieh & Natawidjaja 2000). Therefore, more observations are needed to address possible maximum earthquake magnitudes, variability of slip rates, segmentation along the strike and also their interplay with the subduction thrust.
Due to the low seismicity of the Aysén Region in Southern Chile, the 2007 Aysén Fjord earthquakes sequence represents a unique opportunity to study the seismo-tectonic structure of this area in detail. Precise earthquake locations, estimation of uncertainties and fault plane solutions are required to characterize this zone that lacks local studies and, in general, to understand the processes involved in zones of oblique subduction in which bulk transpressional deformation is expected. Additionally, we have re-analysed the fore- and early aftershock data presented by Legrand (2010) to give a complete overview of the seismicity in this region. We also carried out new relocations of the major events of the sequence by using local stations, improving in this way significantly previous locations (Russo 2010) and providing an in-depth study of the whole seismic sequence of 2007.
The results of this study allow us to determine for the first time a local velocity model and to define the seismogenic zone for this area, giving a starting point for future geophysical investigations in the region. Moreover, our research adds new information on these types of intra-arc strike-slip faulting systems that are not very well studied so far.
1.1 Location and geotectonic setting
The Aysén Region is located at the southern end of the subductive convergent margin between the Nazca and South America plates (Fig. 1). It is also the place where the Liquiñe-Ofqui Fault System (LOFS; described later) starts its development northwards. Furthermore, the active Chile Ridge is currently subducting offshore of the Aysén Region (Herron 1981; Cande 1987) at the so-called Chile Triple Junction (CTJ) where the Nazca, Antarctic and South America plates collide. This tectonic configuration represents the only present-day active ridge-trench collision where the overriding plate represents continental lithosphere.
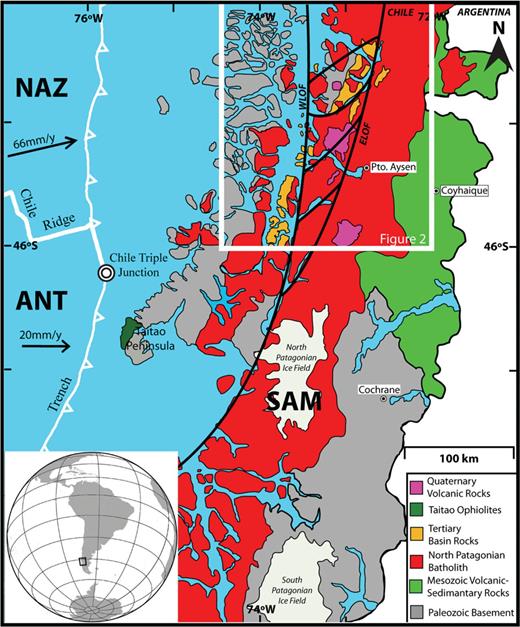
Location, tectonic setting and simplified geology of the Aysén Region. Geology from SERNAGEOMIN (2003).
The CTJ is located off the Taitao Peninsula (see Fig. 1) and has been migrating northwards since 14 Ma when the ridge collided against the trench for first time (Bangs & Cande 1997). North of the CTJ the Nazca Plate is being subducted at a rate of 6.6 cm yr−1 (Angermann 1999), while to the South, the Antarctic Plate is being subducted at 2 cm yr−1 below South America (Chase 1978).
Several consequences of the Chile Ridge subduction beneath the CTJ have been observed including: tectonic erosion, plutonism near the trench and uplift during the Upper Cretaceous in the Taitao Peninsula (Cande & Leslie 1986), emplacement of an ophiolitic complex in the Taitao Peninsula (Forsythe 1986) and the displacement of a forearc sliver (Forsythe & Nelson 1985; Wang 2007). Another important consequence is the occurrence of a 350-km-long volcanic gap within the arc (Ramos & Kay 1992) while in the backarc zone widespread basaltic-plateau volcanism takes place (e.g. Ramos & Kay 1992; Gorring 1997). Ramos & Kay (1992) argue that the most intense periods of this basaltic volcanism are related to the passage of a slab window (subducted ridge) below the plateau.
The geology of the Aysén Region is most simply defined by three predominantly N—S trending domains: a metamorphic coastal domain, a central plutonic belt and an eastern backarc volcano-sedimentary domain (Fig. 1). Specifically in the area within the Aysén Fjord covered by this study, the geology consists mainly of intrusive rocks belonging to the North-Patagonian Batholith and recent monogenetic volcanic cones (Niemeyer 1984; SERNAGEOMIN 2003). The morpho-structural setting in this region is controlled by NE—SW and NW—SE structures related to the LOFS (D'Orazio 2003).
1.2 The LOFS
The LOFS is located within the active arc in southern Chile and corresponds to a dextral strike-slip fault system that extends for more than 1000 km NNE trending. It is formed by two main NNE-trending parallel lineaments, the western and eastern Liquiñe Ofqui Fault (henceforward WLOF and ELOF, respectively), connected by at least four NE-trending en échelon lineaments that define a strike-slip duplex (Cembrano 1996; Fig. 1). This fault system accommodates part of the strike-parallel component of the oblique convergence between the Nazca and South America plates and it is thought to control the distribution of quaternary volcanism in the area (Cembrano & Moreno 1994; Cembrano & Lara 2009).
While some authors consider oblique subduction as the driving mechanism of the displacement along the LOFS (e.g. Hervé 1976; Beck 1988; Cembrano 1996, 2000, 2002), others add the indenter effect of the ridge's subduction (e.g. Forsythe & Nelson 1985; Cembrano 2002). The indenter effect would cause the detachment of a forearc sliver, the Chiloé block, from the continental margin along the LOFS. According to Cembrano (2002), both oblique subduction and the indenter effect of the ridge's subduction generate transpressional deformation along the continental border. The same authors add that the long-term dextral transpressional regime appears to be driven by oblique subduction while the short-term deformation is in turn controlled by ridge collision from 6 Ma to the present day. Cembrano (2000) propose that strong intraplate coupling resulting from the subduction of young and buoyant oceanic lithosphere north of the CTJ plus a thermally weak continental crust appear to be the key factors for the motion in the LOFS.
Most of the information on the current deformation state of the LOFS comes from structural and thermochronological evidence (e.g. Cembrano 1996, 2000, 2002) which suggest that this fault has been active since Late Mesozoic as a sinistral strike-slip fault, while the dextral strike-slip motion is dated to begin about Middle Miocene. Strike-slip brittle deformation during the Pliocene to post-Pliocene and high rates of uplift during the Holocene characterizes the recent tectonics of the LOFS (Cembrano 1996).
Wang (2007) exposed the first geodetic evidence on the current dextral shear of the LOFS, finding a trench-parallel slip rate of 6.5 mm yr−1 between 42° and 44°S, which accommodates about 75 per cent of the current margin-parallel component of the Nazca—South America relative plate motion. They attribute this displacement to the whole width of the fault system with the consequent northward translation of the Chiloé block located to the west of the LOFS.
Recently, Lange (2008) observed local crustal seismicity along a 130-km-long segment of the fault at ∼42°S. At this latitude, the Chiloé block mentioned earlier has been decoupled from South America by the action of the LOFS (Forsythe & Nelson 1985; Wang 2007; Melnick 2009). Although the north edge of this fault system has been intensely researched (e.g. Lange 2008; Haberland 2006, 2009; Melnick 2009), the southern portion remains poorly understood, and therefore, this study will provide a better characterization and understanding of this intra-arc fault.
1.3 Previous seismic studies
Considering the available information, the Aysén Region has a poor catalogue of seismic events whether because of the lack of local studies or the low rates of seismicity. According to the Chilean Seismological Survey (), only one historical event M > 7 has been observed in the time period from 1570 to 2005. This event, magnitude 7.1 occurred on 1927 November 21 (Greve 1964) to the west of the Aysén Fjord causing also a local tsunami. Other minor seismicity in the region is directly linked to the volcanic activity of the Hudson volcano (∼46°S; Fig. 2).
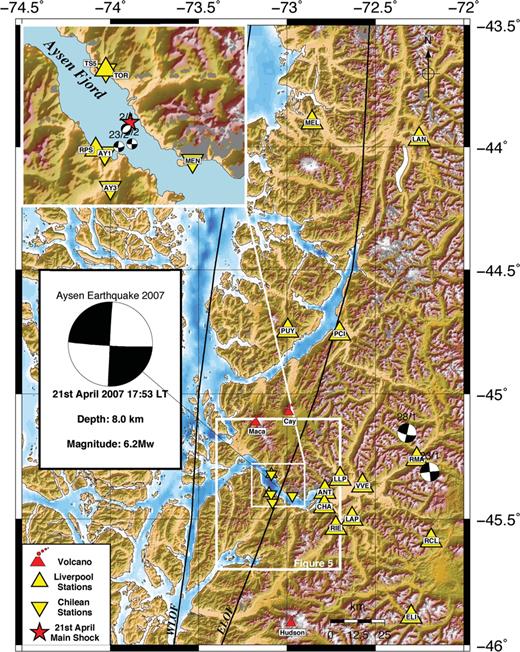
Study area and distribution of seismic network around Aysén Fjord including largest events (M > 5) of the 2007 seismic sequence. Focal mechanisms from GCMT Catalogue except main shock from USGS Catalogue. Location of largest events from this work except events January 23 and 28 from NEIC catalogue.
In terms of seismo-tectonic studies, the Aysén Region is still not well studied. This is mainly due to the difficulties of conducting fieldwork (accessibility, climate) and the lack of major seismicity that could be used for teleseismic (remote) studies. Only a few local seismic networks have been installed in the Aysén Region. Murdie (1993) deployed nine seismometers between 1992 February and March locating around 50 events with magnitudes from 0 to 4 close to the CTJ within the Taitao Peninsula. Miller (2005) maintained the first local seismic network throughout the whole Aysén Region between 2004 January and 2006 February detecting only minor crustal seismicity, while Comte (2007) deployed a dense seismic network in the region allowing them to capture the initial phases of the Aysén seismic sequence of 2007 (see later) and to determine the background seismicity pattern in this area for the 2 yr preceding the sequence.
2 The 2007 Aysén Seismic Sequence
The seismic calmness of the Aysén Region was dramatically interrupted in 2007 when the zone was shaken by a series of earthquakes that took place during the first half of that year. The seismic sequence started on January 10 with a single small shock (ML < 3) at shallow depth beneath the Aysén Fjord after which more events occurred on January 14, 18, 19 and 21, until January 23 when a magnitude 5.2 earthquake shocked the area releasing a sequence with more than 20 events per hour detected immediately afterwards (Barrientos 2007; Russo 2010). Initially several hypotheses about the origin of the earthquakes were discussed, including a volcano-magmatic origin (e.g. Lara 2008) and a tectonic origin (e.g. Cembrano 2007). According to the NEIC Catalogue (), after this initial event, five major earthquakes M > 5 occurred on January 28 (Mw 5.2), February 3 (Mw 5.3), February 23 (Mw 5.7), April 1 (Mw 6.1) and finally April 21 (Mw 6.2; see Table 1 and Fig. 2).

Comparison of location of the largest events during the Aysén sequence. Focal mechanisms from gCMT catalogue except those indicated.
Using a temporary local seismic network, Mora (2010) recorded the initial events of the sequence (2007 January) inferring a tectonic origin to the seismicity related to activity on the LOFS. Legrand (2010) maintained a local seismic network in the epicentral area from 2007 late February to mid-June, deducing that the origin of the Aysén seismic sequence of 2007 may have been related to a combined fluid-driven mechanism and intra-arc tectonic activity based on the distribution of the earthquakes, published focal mechanisms, geology of the area and other geophysical parameters. Russo (2010) relocated six of the largest events of the sequence (M > 5) by using joint hypocentral determination (JHD; Douglas 1967) and the event Mw= 5.3 of February 23 as master event (this event was locally recorded by them). They relocated all of the events at shallow depths (1–12 km) with five of them placed very proximal to the ELOF. By modelling the Coulomb stress generated by these events, they also argue the possible connections between events.
The seismic sequence of the Aysén Fjord culminated (at least in its critical phase) on April 21 with a Mw= 6.2 earthquake (the largest of the sequence; see Fig. 2) that produced damage to salmon farms, several landslides and a landslide-induced tsunami in the fjord that caused 10 reported casualties (three dead and seven still missing people). The effects of this earthquake have been studied in several publications (e.g. Naranjo 2009; Sepúveda & Serey 2009; Sepúveda 2010). Although the temporary local seismic network (five seismometers and five GPS stations) installed by Chilean efforts at the beginning of the sequence was almost completely destroyed by the tsunami, the exact location of this earthquake was constrained and re-located by Legrand (2010) within the Aysén Fjord at a depth of 4 km. According to the NEIC-USGS Catalogue the focal mechanism for this event shows dextral strike-slip faulting NNE-trending and it was located exactly on the trace of the ELOF (Fig. 2).
3 Liverpool Aftershocks Network and Data Processing
During 2007 July to 2008 February we deployed a network of 15 three-component short-period seismic stations in the area around the Aysén Fjord (see Fig. 2 and Table 2). Five of the stations were installed between 2007 July and August and due to the severe weather conditions and restrictions on navigation within the fjord the remaining stations could only be deployed in 2007 September and late October. The stations were continuously recording at a sampling rate of 50 Hz for a period of nearly 7 months. Data could be acquired from 13 stations, although one of them also presented timing problems. The deployment was especially difficult due to weather conditions, accessibility and the closure of the fjord to vessels other than Navy/Police boats during the whole deployment period. Navy/Police boats, zodiac boats and 4 × 4 vehicles were used to reach some of the sites. Additionally, part of the data recorded by the local seismic network deployed by Chilean institutions (e.g. Barrientos 2007; Legrand 2010; see Fig. 2) were used in this study to complement and enhance the coverage of our stations during the first part of the recording period (2007 July-October).
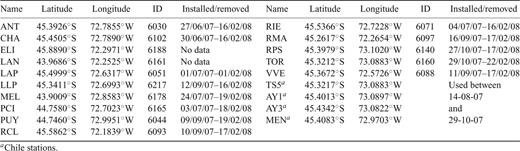
Seismic stations used for this study.
Once the data were collected, a visual examination on the continuous recording was carried out using the software PQL (PASSCAL Quick Look), finding a total of 236 aftershocks. These events were processed using the GIANT software package (Rietbrock & Scherbaum 1998) including bandpass filtering the data between 0.5 and 15 Hz, manually picking both P and S arrival times (1535 P- and 1429 S-phase picks), and assigning weights to each pick according to its quality. We used a standard weighting system in which each weight has an assigned time-window error or uncertainty for the pick. In this case we used 0 = 0.04 s, 1 = 0.08 s, 2 = 0.2 s, 3 = 0.8 s and 4 = 1.5 s based on the given data quality (proximity of stations, very good signal/noise ratio, three components stations, sampling frequency), which allowed us to pick also S-wave arrivals very accurately.
Data from the Chilean local network were processed with the program SDX () adding 170 P and 170 S picks to our data set. The combined data set consisted then of 1705 P and 1599 S arrivals, which were used to obtain preliminary hypocentral locations using the HYPO-71 software (Lee & Lhar 1972). Due to limited available information about this region, a velocity model from the Chiloé area (Lange 2007), ∼700 km northwards of the study zone, was used in this preliminary instance.
3.1 1-D velocity model
In standard earthquake locations, velocity parameters remain fixed to a priori values taken from previous available information (previous seismic studies, refraction profiles, etc.), which is considered to be correct and thus, final solutions are obtained minimizing the traveltime error (rms) by only perturbing the hypocentral parameters. Nevertheless, precise earthquake locations and meaningful error estimates require the solution of all the parameters contained in the inversion problem, that is, hypocentral parameters and velocity structure. The program VELEST (Kissling 1995) allows to calculate a minimum 1-D layered velocity model by simultaneously inverting for both earthquake hypocentres and velocity parameters including station corrections, solving in this way the coupled hypocentre-velocity model problem (Crosson 1976; Kissling 1988).
Based on Wadati diagrams we determined an average Vp/Vs ratio of 1.76 in the Aysén Fjord area. A selection of best events was made based on number of observations (>6 P-wave picks) and GAP or angle of stations coverage (<180°) for the inversion. Additionally, the average Vp/Vs ratio was used to reject those observations with a Vp/Vs value larger than 1.80 s off the main trend. Observations from stations with timing problems were also removed leading to a final selection of 79 high-quality events (out of 214) including 785 P and 749 S phases. The average pick uncertainty for P phases of this subset is 0.062 s (weight 0 representing 77 per cent of the picks) and for the S phases is 0.067 s (weight 0 representing 65 per cent of the picks). Regarding the spatial distribution of the subset, the events are located within the fjord area and further North including the northern cluster (see later) at depths down to 15 km but mostly around 5 km.
Subsequently, this selection was used as input for the simultaneous inversion. The velocity model proposed by Lange (2007) for the Chiloé area was used as the base model for the processing. It is important to note that the inverted velocity structure depends decisively on the initial guess, as it tends to maintain the overall shape of the starting model (Langer 2007).
The inversion in VELEST was performed following the procedure proposed by Kissling (1994). A first approach was carried out testing different configurations of the layers' properties and parameters (e.g. number of iterations, damping) involved in the simultaneous inversion. Finally, 1000 initial models were randomly created for both P- and S-waves inversions and only the best 5 per cent of the final models were considered for plotting (Fig. 3). This process could be considered as a Monte Carlo approach type method since we randomly searched for initial models to get a best final model with the lowest rms. The simultaneous inversion looks for the best velocity model (lowest rms) according to the given traveltimes data set, keeping the layer thickness and depths of the initial model constant and changing only layer velocity, hypocentre location and station corrections. By adopting such an approach we are also relaxing the dependency of the starting model as mentioned earlier.
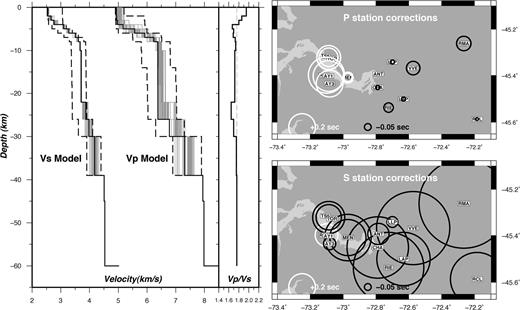
(Left-hand side) Final 1-D velocity model for P and S velocities as well as Vp/Vs ratio. Dashed lines indicate range of starting models, grey lines indicate final models (best 5 per cent) and the bold black line represents the best final model with the lowest overall rms. (Right-hand side) P- and S-station corrections.
Fig. 3 displays the final 1-D velocity model obtained for both P and S waves, as well as the Vp/Vs ratio. Final rms for P model is 0.068 s and for the S model 0.080 s, reducing in ∼0.05 s the initial rms. Due to the lack of deep hypocentres, reliable velocity information was obtained only for the upper ∼20 km, and hence the velocities from 39 km depth downwards were fixed to those provided for the Chiloé area.
For the upper 5 km depth, P-wave velocities around 5 km s−1 were calculated. These values show agreement with velocities expected for this area based on its geology, which consists mostly of granitic rocks from the North-Patagonian Batholith. At 5 km depth a rise in P-wave velocities from 5.17 to 5.57 km s−1 is observed and from this depth velocities increase gradually to 6.38 km s−1 at 8 km depth. From 8 to 26 km depth, P-wave velocities keep constant at 6.38 km s−1. Elevated Vp/Vs ratios of 1.80 to 1.95 were found for the upper 3 km, while for greater depths Vp/Vs ratios in the range of 1.65–1.76 were obtained.
The station ANT was chosen as the fixed reference station because of its central location and number of observations. Notable, P-wave station corrections indicate negative values at the East of the area while to the West of the ELOF positive values are observed (see Fig. 3) despite the fact that the geology is mostly uniform in the whole study area. The opposite sign of station corrections at both sides of the ELOF could be attributed to a structural difference on both sides of the fault; however, more detailed geological/structural mapping would be necessary to assess this point with a degree of certainty.
To check the robustness and location stability of the final 1-D velocity model, we performed a series of tests by randomly shifting both latitude and longitude of the original hypocentre spatial coordinates by °3 to 5 km and depth by °0 to 3 km. The new shifted hypocentres were then introduced to VELEST for a relocation keeping the velocity and station parameters fixed so the programme looks for a solution only by changing the hypocentral parameters. This operation was repeated a hundred times for each event, therefore we obtained a representative average of the events' new relocations. If the final minimum 1-D velocity model presents a robust minimum in the solution space, no significant changes in the hypocentre locations are expected (e.g. Husen 1999). Fig. 4 shows the results obtained from this stability test. The test was applied to the whole data set of 214 events, including those events that were not used for the simultaneous inversion. Except for a few hypocentres, most of them were relocated very close to their original position. The population of differences between the original and the new relocated position of the events exhibits a normal distribution for the three coordinate directions. In the latitude and longitude directions the calculated σ value corresponds to 212.18 and 275.25 m, respectively. It is possible to observe both, in the latitude and longitude directions that there is a particularly small dispersion of relocations between events 85 and 129 (see Fig. 4). This is due to the combined use of Chilean and Liverpool stations during that period (2007 September 2 to 2007 October 29; see Table 2 and Fig. 8), while for the rest of the events only our stations (Liverpool) were available. In the depth direction the calculated σ value corresponds to 468.94 m. As expected, a higher dispersion and therefore, a higher sigma value on the depth direction was obtained in comparison with the horizontal components despite the smaller shift applied in the vertical component (0–3 km vs. 3–5 km for the horizontal components). Specifically, for the subset of 79 events used in the simultaneous inversion (black crosses in Fig. 4), the greatest misfits obtained are 66.7, 306.3 and 679 m for the latitude, longitude and depth directions, respectively. Overall, 96 per cent and 89 per cent of the events were relocated within 500 m from their original position for the horizontal and vertical components correspondingly.
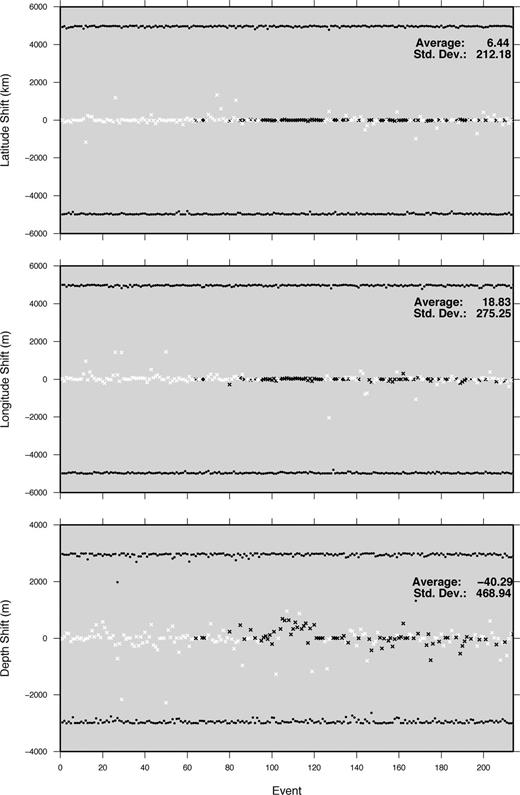
Hypocentre stability tests. Black dots show maximum negative and positive random shifting for each event. Black and white crosses represent the average relocation for each event used (79) and not used (135) in the simultaneous inversion, respectively. See Section 2.2 for more details.
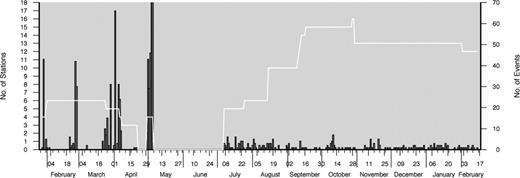
Histogram showing frequency of events during the period of the experiment in grey bars and stations availability in white line.
We also performed stability tests addressing the coupled inversion problem based on our best subset of events (used for the simultaneous inversion) by introducing randomly perturbed hypocentral locations and inverting simultaneously for velocity model, stations corrections and hypocentral locations. The results indicate average variations in velocity of 0.04 km s−1 for the upper 4 km of crust, 0.25 km s−1 for the next couple of kilometres and 0.04 km s−1 down to 30 km depth where the standard deviation and averaged variation of velocity increases due to the lack of hypocentres at this depth. The standard deviations for the hypocentral relocations are 1.7, 1.3 and 2.6 km for the N-S, E-W and vertical directions, respectively.
3.2 Event locations
The final location of events was carried out by using the software NonLinLoc (Lomax 2000) that computes non-linear probabilistic locations by producing an estimate of the spatial probability density function and the maximum likelihood origin time. Out of 214 events processed, 182 correspond to seismicity localized within the Aysén Fjord area, 17 earthquakes are spatially related to the Hudson volcano (∼46° lat. S) and 15 events could not be associated to any known source. No seismicity related to the Wadati-Benioff Zone was detected in the study area during the observation period.
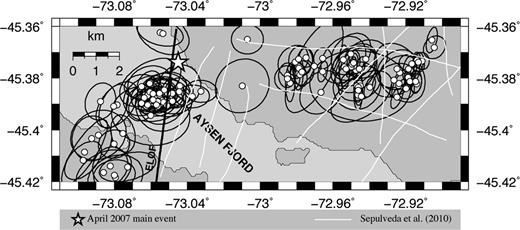
Fig. 5 shows the final locations for the 182 events in the Aysén Fjord area while location uncertainties (68 per cent confidence limit) are shown in Fig. 6. The final locations show intra-plate seismicity at shallow depths, mostly between 4 and 10 km, that can be described as two main features: (1) an alignment of events NNE-trending that crosses the Aysén Fjord extending for more than 50 km coinciding with the ELOF and including a cluster of 19 very concentrated events observed to the North of the area (∼45.15° lat. S); and (2) an arrangement of events located to the East of the main trend and distributed as a nearly W—E-trending alignment. Location uncertainties are particularly small in the area near by the fjord and for the northern cluster of events while locations placed at the South of the seismic network show the greatest uncertainties. For the horizontal directions 80 per cent of the events present uncertainty ellipses smaller than °2 km while in the vertical direction this percentage decreases to 57 per cent.
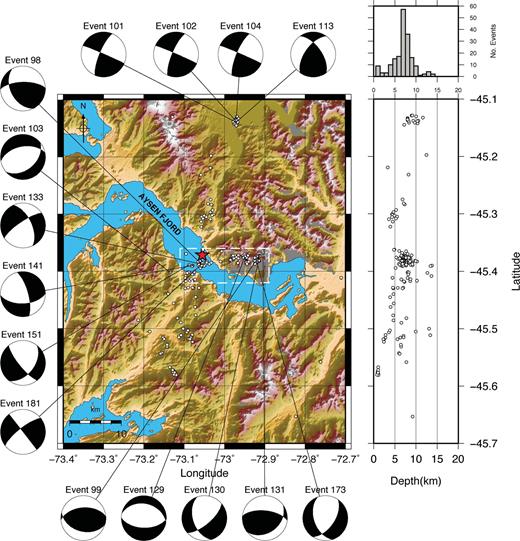
Final location of aftershocks and focal mechanisms. Rectangle in white dashed line indicates events on Fig. 7. White star indicates location of April 21 main shock.
Final location uncertainties. Error ellipses represent 68 per cent confidence limit. Triangles show local network in the area nearby.
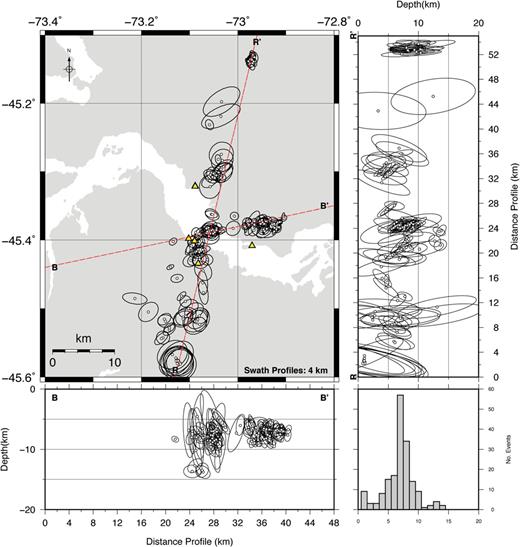
Fig. 7 shows in detail the area highlighted in Fig. 5. It is possible to observe that both seismicity related to the main NNE-trending alignment and seismicity related to the W-E alignment occur mostly at depths between 5 and 10 km within the Aysén Fjord adjacent area.
Detail of events within the Aysén Fjord area showing seismicity and present structures. See Section 2.3 for more details.
Regarding the chronological occurrence of the events, no clear time-dependent pattern was observed, neither an increase nor a decrease in the late Aysén Fjord aftershock seismicity during the time of our deployment and moreover, no spatial migration of the epicentres was detected. The only temporal characteristic to highlight is the occurrence of an event cluster located to the North of the area, which spanned only 1 week in 2007 October (see Figs 5 and 8).
3.3 Local magnitudes
Local magnitudes (ML) were calculated by using the automated magnitude calculation included in the GIANT software package (Rietbrock & Scherbaum 1998). Maximum peak-to-peak amplitudes were selected manually from a time window of 2 s after the arrival of the S wave in both of the horizontal components for each event. These amplitudes were then transformed into the corresponding amplitude of a Wood-Anderson seismometer and computed by GIANT following the equations from Bakun & Joyner (1984). Finally the magnitude of the event is calculated from the average of the magnitudes for each used station.
Magnitudes were found in a range between 1.2 and 4.4 with most of the events concentrated between 1.6 and 2.6 ML (Fig. 9). The geographic distribution shows bigger magnitudes on the main ∼NS alignment while the events located at the east of the main fault show smaller ones. The highest magnitudes are related to the Hudson volcano activity (see Table S1, Supporting Information). No special distribution of magnitudes is appreciated either in depth or in time.
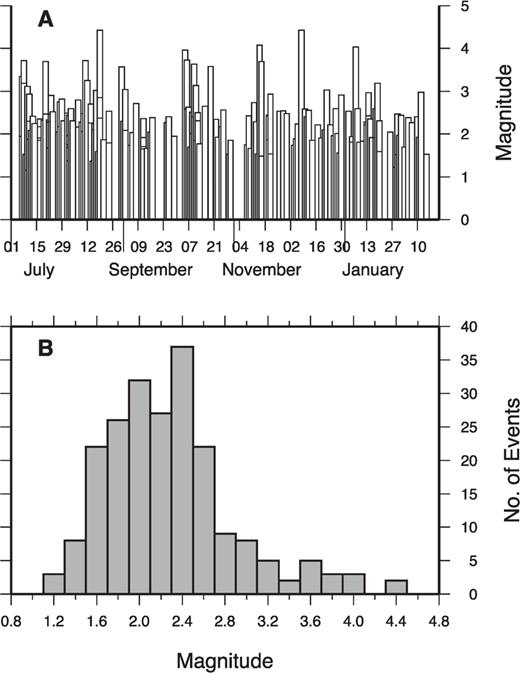
Local magnitudes calculated in this work. (A) Magnitudes per event on time. (B) Histogram of frequencies of magnitudes.
During the observation period, two of our detected events were also listed in the NEIC catalogue and two in the Servicio Sismológico de la Universidad de Chile catalogue (GUC; ). Magnitude differences with NEIC catalogue were 0.57 and 0.38, while differences with the GUC catalogue were 0.14 and 0.43. It is important to note here that the NEIC catalogue is based on a different magnitude scale.
3.4 Focal mechanisms
Focal mechanisms were constrained for selected events using the software FOCMEC (Snoke 1984; Snoke 2009). FOCMEC performs a search of the focal sphere and reports acceptable solutions based on selection criteria for the number of polarity errors and errors in amplitude ratio.
Obtaining focal orientations was particularly difficult due to the failure of some stations during the recording period and consequently, the lack of optimal station coverage around the events. In total, 15 focal mechanisms were successfully calculated from first motion P-wave polarities and SV/P amplitude ratios (Fig. 5). The method used by FOCMEC is explained in Snoke (1984) and Snoke (2009), while the usage of S/P amplitude ratio for focal mechanisms determination has been widely explained in several publications (e.g. Kisslinger 1980; Hardebeck & Shearer 2003). Take-off angles were computed from the final location in the 1-D velocity model. To calculate amplitude ratios, we used the maximum peak-to-peak amplitude of the P- and S-wave arrival. Because the waveforms of S-wave arrivals are usually more complicated than P-wave arrivals, we selected the peak-to-peak maximum amplitude contained within a window of 1 s after the S-wave arrival. In the case of the P wave, we used the first impulse.
The solutions shown in this paper are presented by equal area, lower hemisphere projection. Table 3 shows the parameters obtained for the focal mechanisms. No error for first motion polarity was allowed in the processing. In case of multiple solutions, the focal mechanism with the smallest rms was chosen for plotting. Even though we obtained multiple solutions for most of our focal mechanisms (11 out of 15 events), these solutions differed only by few degrees, therefore not affecting considerably the faulting geometry of each of the mechanisms shown in Fig. 5.
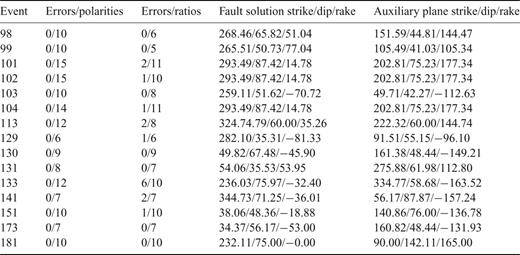
Parameters of focal mechanisms calculated in this study.
Four of the 15 focal solutions calculated (events 101, 102, 104 and 113) are spatially related to the cluster of earthquakes located to the North of the study area (∼lat. 45.15°S). These focal mechanisms show strike-slip faulting and are strongly similar among them indicating either right-lateral strike-slip faulting NNE-trending or left-lateral strike-slip faulting NW-trending. The remaining focal mechanisms show a more diverse variety of solutions with no clear common pattern.
4 Foreshocks and Aftershocks Previous to Our Liverpool Network
To obtain a better understanding of the whole Aysén seismic sequence we relocated the data published by Legrand (2010), containing the foreshock activity (2007 February 28 to April 21) and early aftershock activity (2007 April 30 to May 5) of the sequence using our new velocity model.
The data set consists of manual picks (P and S arrivals) of 344 foreshocks and 615 aftershocks. First, we used our new local 1-D velocity model to perform a simultaneous inversion for station corrections and hypocentres on a selection of the best 225 events in terms of number of observations and GAP from the foreshocks data. We used only foreshocks for the simultaneous inversion given the better seismic network used for their location. The station corrections show negative values (∼0.3 s) for the S wave, which suggests that our velocity model might underestimate the S-wave velocity for this data set. It is important to note that when inverting with fixed velocity parameters, changes needed in the velocity model might not be completely absorbed by the station correction terms, therefore introducing a bias into hypocentral locations. However this, 92, 69 and 72 per cent of the events were relocated within 2 km from the original locations by Legrand (2010) in latitude, longitude and depth directions, respectively, suggesting the robustness of the obtained locations The largest discrepancies between the different locations approaches are found for the early aftershock data predominantly caused by the changes of the seismic network and less number of observations after the main shock of April 21 (Legrand 2010; see discussion later).
Fig. 10 shows our relocation of these events including 68 per cent confidence limits. For our further interpretation we will only use events with uncertainty ellipses' semi-axes smaller than °5 km, comprising in the case of the foreshocks 316 events out of 344 and for the early aftershocks 267 out of 615. The foreshock activity is located following the main trend of the ELOF along 26 km, mostly at depths between 4 and 10 km with also some incipient activity at the East of the main alignment. Early aftershock seismicity shows instead less reliable locations due to lack of appropriate stations coverage. These events are located mostly within ∼6 km to the South of April 21 main shock in the Aysén Fjord.
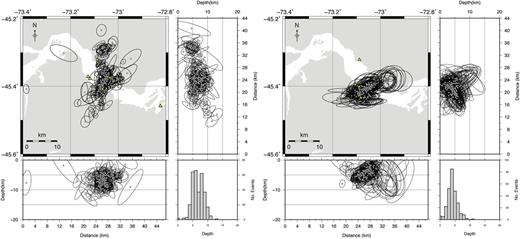
Re-location of foreshocks (left-hand side) and early aftershocks (right-hand side) previous to Liverpool deployment including 68 per cent location confidence limit. Only events with horizontal ellipses' semi-axes smaller than 5 km have been plotted.
5 Discussion and Conclusion
This study focuses on the Aysén seismic sequence of 2007 and in particular on the late aftershock activity of April 21 main shock, recorded between 2007 July and 2008 February. Additionally we present for the first time a 1-D local velocity model for this area. Previous studies (e.g. Mora 2010) focused on the foreshock activity and located it exclusively within the Aysén Fjord inferring a tectonic origin for the whole seismic sequence, while Legrand (2010) attribute the seismicity in the Aysén Fjord to a combined volcano-tectonic activity.
Here we show that seismicity was not exclusively constrained to the Aysén Fjord nearby area but it extends for ∼50 km in a NNE-trending alignment that coincides with the trace of the ELOF. Furthermore, the development of aftershock activity to the east of the main fault indicates that the sequence of 2007 and its main event, the April 21 Aysén earthquake, re-activated subsidiary faults located to the East of the main fault that belong to the same structural system. These subsidiary faults could correspond to NE- and NW-trending structures recognized by Sepúveda (2010), although given our location resolution we cannot support this hypothesis conclusively (see Fig. 7). Another possible approach to the eastern seismicity is to take it as a single WE-trending alignment subordinated to the main fault; however, such a structure has not been identified in previous studies in the Aysén Area. The occurrence of aftershock activity is exclusively constrained within and to the eastern side of the main fault, while to the west no events were detected. Sepúveda (2010) also found that a large number of landslides induced by the 2007 April Aysén earthquake were located to the east and north of the main event, which in turn is related to the presence of these secondary faults and higher topography at this side of the main fault. The EW-trending seismicity zone extends for ∼15 km east of the main fault giving an idea of the width of deformation across the master fault. It is important to note that in our belief these events occur on reactivated subsidiary faults. Certainly, better geological mapping of structures in the area is also necessary to address the spatial distribution of the aftershocks in relation to these structures.
By using empirical equations from Wells & Coppersmith (1994) we calculated a subsurface rupture length of 18 km for the Mw= 6.2 strike-slip fault of the main shock. Although we observe seismicity along ∼50 km, the bulk of the aftershock seismicity that occurs in the Aysén Fjord is contained in a 20-km-long segment which coincides with the above estimate. The only seismicity occurring outside this 20 km segment is the northern cluster of events (∼45.15 lat. S), which might or might not be related to the 2007 sequence and its April 21 main shock, but it is certainly aligned with the ELOF.
Additionally, the relocation of the foreshock and early aftershock activity contributes significantly to understand the whole seismic sequence. Unfortunately the disruption of the local seismic network by the landslide-induced tsunami of April 21 leads to greater uncertainties in locations of the early aftershock activity. Nevertheless, it is possible to conclude that the seismic activity immediately after the main shock was concentrated in the area around April 21 event (instead of along the trace of the main fault) with up to 400 events per day on 2007 May 5. The smaller Vp/Vs ratio of 1.69 calculated by Legrand (2010) in comparison with the ratio calculated by us for the latter part of the sequence (1.76) could suggest a change in time (pre- and after main shock) of the Vp/Vs ratio in the area. However, it is important to note that our value is the average over a much larger area including stations further North in comparison with the network of Legrand (2010).
Given the depth of the located events, it is possible to suggest a seismogenic zone restricted to the first 15 km of crust for the study area, which agrees with numbers postulated by Tassara & Ya°ez (2003) who calculate a maximum crustal thickness of 40 km for the segment between 39° S and 47° S.
We also correlated 14 of the biggest events during the sequence of 2007 that were located by the USGS and by Russo (2010), with our relocations (see Table 1). We found notable differences with previous locations, in particular in terms of depth provided by USGS. Fig. 11 shows differences in the epicentres of four of the biggest events proposed by Russo et al. and relocated in this work. Again, differences in locations are considerable, with all of our relocations placed within the Aysén Fjord. Specifically regarding the main shock of the sequence, the Mw= 6.2 event of 2007 April 21, our relocation indicates that it was placed within the Aysén Fjord at a depth of 8 km. Our relocations improve considerably previous locations by using local stations and a new 1-D local velocity model as well as the employment of a non-linear probabilistic location approach on the estimation of uncertainties.

From the six largest events of the sequence, two could not be relocated by our local network (January 23 and 28) as this was not yet installed. These events were located to the East of the Aysén Fjord by the USGS (see Fig. 2 and Table 1) but we believe they were misallocated given the high uncertainties on teleseismic locations especially for this remote area of the world. Instead, we believe these earthquakes occurred very close to the other large events relocated by us within the Aysén Fjord.
The two available focal mechanisms for 2007 April 21 main shock are those from the USGS and gCMT catalogues (see Table 1). They differ slightly (9°) regarding strike of the fault plane but agree well in the dip and slip angles. Therefore, both solutions show dextral strike-slip faulting orientated either NNW (GCMT, 84/86/2) or NNE (USGS, 93/87/-1). Other five focal mechanisms of the sequence are only available from the gCMT catalogue and shown in Fig. 2. Except for the event on February 4 that exhibits normal faulting, all of them show right lateral strike-slip faulting, most likely related to the activity on the ELOF. The normal faulting solution could be associated to activity on the en échelon faults that join both of the main traces of the LOFS. Regarding the focal mechanisms computed in this work, they clearly indicate for the Northern cluster right-lateral strike-slip faulting NNE-trending, just as for the LOFS-related focal mechanisms calculated in previous publications (e.g. Lange 2008) and also supported by the focal mechanism obtained from the gCMT and USGS Catalogue for the main shock of the 2007 sequence. On the other hand, the situation to the east of the ELOF is rather more complex as depicted by the diversity of rupture geometries obtained for these events.
The aftershocks sequence of 2007 April 21 Aysén earthquake was successfully recorded by our temporary seismic network. The seismicity analysed is clearly aligned with the ELOF and the event distribution suggests that this fault is currently seismically active in its southern end. Based on the previously exposed, we infer that the Aysén seismic sequence of 2007 had a tectonic origin, with activity on the ELOF as its main driving force. However, it is not possible to dismiss the potential action of hydrothermal fluids that could reactivate secondary structures and migrate along them generating minor seismicity that occurs besides the main tectonic events, especially to the East of the main fault. The presence of hydrothermal fluids and rock fracturing is also suggested by the high Vp/Vs ratio varying from 1.80 to 1.95 for the upper 3 km as observed in this study and the existence of several monogenetic cones and hydrothermal activity in the area described by D'Orazio (2003). We also demonstrated that teleseismic determined hypocentre locations can still have large associated errors in remotely located regions, even for the case of a joint hypocentre determination.
The whole Aysén Fjord earthquake sequence of 2007 and its effects including hundreds of landslides and a tsunami reveals that it is imperative to re-estimate the geological hazards for this region that was formerly believed a ‘seismically quiet’ region in Chile.
Acknowledgments
We thank the valuable comments and suggestions of Dr. Stephan Husen and an anonymous reviewer. We also thank the support of the Chile National Emergency Office (ONEMI), Chilean Navy and CONICYT, Chile through its program of scholarships ‘Beca Presidente de la República’. This project was partially funded by NERC grant NE/F001703/1. The seismic instruments and data management facilities were provided by SEIS-UK at the University of Leicester. The facilities of SEIS-UK are supported by the Natural Environment Research Council under Agreement No. R8/H10/64. Data collected will be available through the IRIS Data Management Center.
Note Added in Proof
Recently, on 2012 May 8, Chilean authorities approved the construction of a hydroelectric power dam on the Cuervo River, in the northern side of the Aysén Fjord. This structure will be built on the area of the 2007 Aysén seismic sequence, over the Liquiñe-Ofqui Fault System and next to the Macá volcano. The dam therefore will be clearly exposed to a significant geological hazard including volcanic activity, earthquakes on the active fault system and landslides with potential induced local tsunamis, which could all affect nearby populated areas. Another project (Central Cóndor), contemplating the construction of a dam in the southern side of the fjord, is in the pipeline exposed to similar conditions.
References
Supporting Information
Additional Supporting Information may be found in the online version of this article:
Table S1. Catalogue of events processed in this work.
Please note: Wiley-Blackwell are not responsible for the content or functionality of any supporting materials supplied by the authors. Any queries (other than missing material) should be directed to the corresponding author for the article.
