


Summary
We imaged the crust and uppermost mantle structure beneath northeastern (NE) China with fundamental mode Rayleigh waves recorded by 125 broad-band stations deployed in the region. Rayleigh wave phase and group velocities along more than 700 interstation paths were estimated using the wavelet transformation method and then these data were utilized to construct 2-D phase and group velocity maps in the period range of 15–60 s. Owing to the dense ray coverage and short ray path, our results provide better lateral resolution in the NE China region compared with previous phase and group velocity studies. The regularized Rayleigh wave phase and group velocity dispersions at each cell were jointly inverted to determine 1-D shear wave velocity structure using the linear inversion method and then assembled into a 3-D model. Our results show that obvious low velocities exist in the uppermost mantle beneath the Changbaishan volcanic region, which may be due to asthenospheric upwelling. The thin lithosphere with fast S-wave velocity in the lower crust of the Songliao Basin implies that the lithospheric mantle beneath NE China is partly removed.
1 Introduction
Northeastern (NE) China is located in the eastern segment of the Xingmeng Orogenic Belt, which is bounded by the North China—Korea Craton (NCC) to the south and the subducting Pacific Plate to the east. The Palaeozoic of NE China is composed of the Jiamusi, Songliao and Xing'an blocks, which are separated by the Mudanjiang and Nenjiang faults, respectively (Wu 2000; Ge & Ma 2007) (Fig. 1). During the Mesozoic to Cenozoic, this region has been tectonically active, as characterized by the formation of Songliao Basin and extensive intraplate volcanism, but the mechanism for these activities still remains unclear (e.g. Deng 1996; Zhao 2004, 2009; Niu 2005; Chen 2007). Investigation of lateral heterogeneity in the crust and upper mantle is expected to provide insights into lithospheric structure and tectonic evolution of this region.
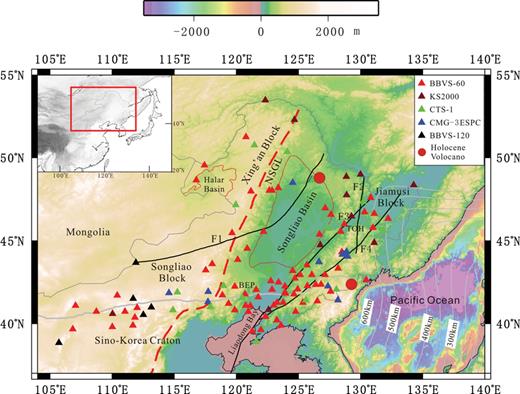
Map showing the major tectonic units and the locations of stations (triangles) used in this study. NSGL represent the North South Gravity Lineament. F1, F2, F3 and F4 represent the Nenjiang, Mudanjiang, Jiayi and Dunmi faults, respectively.
Surface wave tomography has proven to be a useful tool in determining lateral velocity variations in the crust and uppermost mantle (e.g. Trampert & Woodhouse 1995; Larson & Ekström 2001; Shapiro & Ritzwoller 2002). Numerous surface waves studies across NE China and its adjacent areas have revealed significant variations existing within crustal and mantle structures (e.g. Trampert & Woodhouse 1995; Larson & Ekström 2001; Huang 2003; Lebedev & Nolet 2003; Yi 2008; Feng 2010; Sun 2010). However, these studies use only a sparse distribution of national seismic stations in the region or global stations outside NE China and show poor resolution at shallower depths. As a part of the new generation digital seismological observation system in China, more than 120 broad-band stations were permanently installed in NE China beginning in early 2007 (Fig. 1). Most of these stations have operated for more than 3 yr. The availability of abundant seismic data substantially increases the ray path coverage of interstation Rayleigh wave dispersions and allows us to image crustal and mantle structure with better resolution.
In this study, the seismograms for 147 teleseismic events recorded by 125 broad-band stations were analysed to estimate the interstation Rayleigh wave phase and group velocity at periods from 15 to 60 s. Then, a tomographic inversion with traditional ray theory (Ditmar & Yanovskaya 1987; Yanovskaya & Ditmar 1990) was used to construct 2-D phase and group velocity maps of NE China using more than 700 Rayleigh wave dispersions with different two station ray paths. Finally, a 3-D shear velocity model of the crust and uppermost mantle in this region was obtained by jointly inverting the Rayleigh wave phase and group velocity dispersions.
2 Data Selection and Processing
The fundamental mode Rayleigh wave phase and group velocity dispersions were measured from vertical-component seismograms recorded at 125 broad-band stations, which belong to six regional seismic networks located within the region of 105°—135°E and 38°—55°N (Fig. 1). Each station is equipped with a three component broad-band sensor, CTS-1, KS2000, CMG-3ESPC, BBVS-60 or BBVS-120. More details about these regional seismic networks operated by China Earthquake Administration can be found in Zheng (2010).
All events that occurred from 2007 July to 2010 June with magnitude (Mb or Mw) greater than 5.5 were initially selected from the USGS NEIC catalogue. In order to obtain good surface wave energy excitation, the focal depths were constrained to be less than 70 km. Events with epicentral distances between 15 and 100° were retained to avoid near-source effects and interference from higher modes of Rayleigh waves. The two-station method for surface wave dispersion analysis is based on the principle that a given earthquake lies along a common great-circle path (GCP) joining the two stations. To validate the assumption of the GCP propagation of surface waves, we only used station pairs for which the angle between the back azimuths of the far station to the epicentre and to the near station was <3°. Although the two-station method is limited by the particular earthquake and station geometries, the dense distribution of seismic stations in this study enabled us to obtain many station pairs for a total of 147 teleseismic events (Fig. 2).
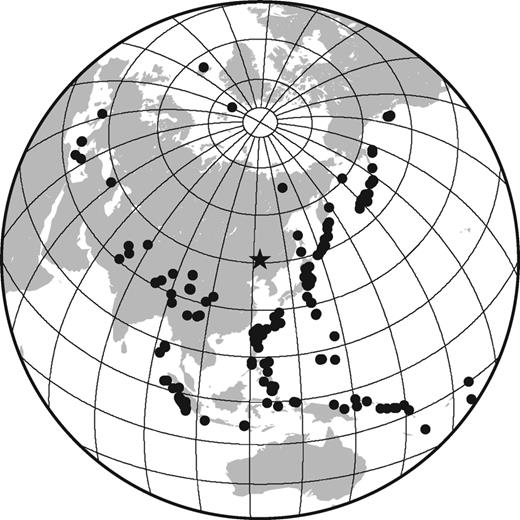
Azimuthal distribution of events used in this study. Distances between the earthquakes (solid circles) and the centre of the study area (star) ranged from 15° to 100°.
Before determining the interstation group and phase velocities, we processed the vertical-component seismograms for all available stations by correcting the instrument response, decimating to 1 sample per second and removing the average and linear trends. We then performed frequency—time analysis for each seismogram to assess quality of the group velocity spectrum. To avoid misrepresentation, all data displaying complex patterns (e.g. spectral holes, irregular group velocity) in the frequency—time plot were rejected. We also applied a phase-matched filter (Herrmann & Ammon 2004) to these seismograms to extract the signals of the noise-free fundamental mode Rayleigh wave (Fig. 3).
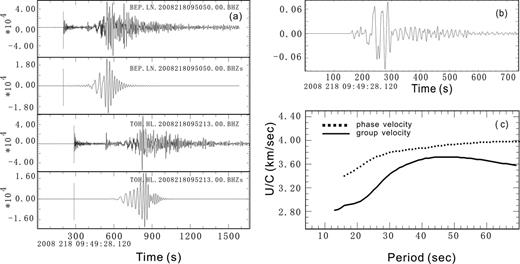
Examples of phase and group velocities determined using the two-station method. (a) Vertical component seismograms at BEP and TOH (location see Fig. 1) before and after isolation of the fundamental mode by phase-matched filter. (b) Interstation path response (Green's function) computed using Wiener filters. (c) Interstation group and phase velocity calculated for path BEP-TOH.
3 Interstation Phase and Group Velocity Measurements
In this study, interstation phase velocity dispersions were determined by applying the continuous wavelet transformation (CWT) method (Wu 2009) to filtered seismograms. Compared with the traditional narrow band pass analysis method (Herrmann 1973), CWT analysis uses bandpass filters with variable length for each period to obtain spectra with different widths and to ensure good dispersion measurements (Wu 2009). To determine interstation group velocity, we first used Wiener filters to construct the best estimate of the interstation Green's function, which is the ratio of the smoothed cross spectrum to the smoothed auto spectrum of the first station (Hwang & Mitchell 1986). Then, the interstation group velocities are measured by applying the CWT frequency time analysis technique (Wu 2009) to these Green's functions (Fig. 3).
The procedures described above were applied to data of all selected and processed events, leading to a collection of phase and group velocity dispersions with different period ranges. These dispersions were manually checked to ensure robust results and then the means for interstation phase and group dispersion curves along individual path were calculated, respectively. Finally, more than 700 Rayleigh wave dispersions with different paths were constructed. The path coverage and number of paths for Rayleigh phase and group velocity dispersions at different periods are shown in Fig. 4. The best coverage occurs between 20 and 50 s and the number of paths decreases at longer and shorter periods. Although the ray paths for phase velocity dispersions are slightly denser than that for group velocity dispersions, both of them cover a wide range of azimuths across this region, providing a dense sampling of NE China, especially in its central portion (Figs 4 and 5).
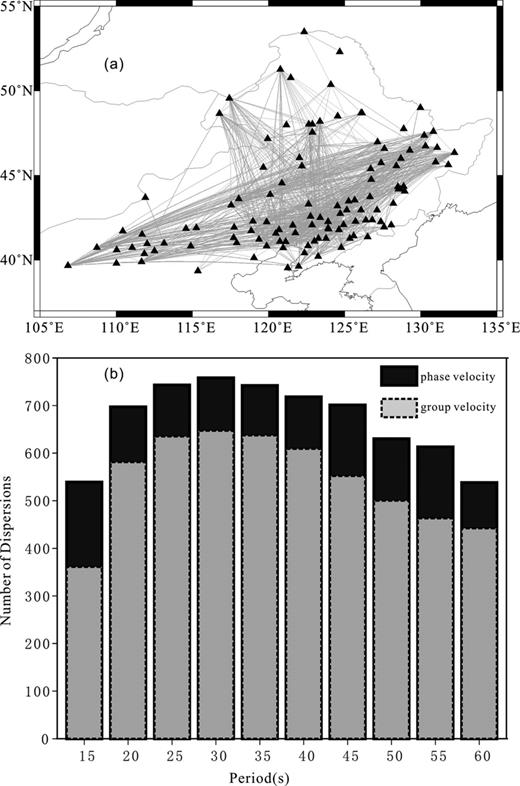
(a) Path coverage map for the complete data set. (b) Histograms of the number of dispersion measurements as a function of period for Rayleigh wave phase (solid) and group (dashed) velocities.
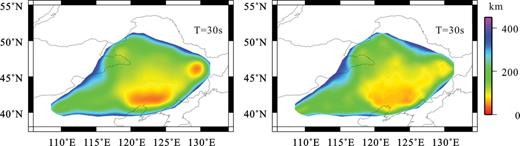
Horizontal resolution maps for Rayleigh wave group (left) and phase (right) velocity maps at 30 s.
4 Rayleigh Wave Dispersion Maps
4.1 Tomographic method
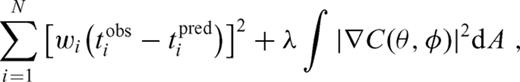
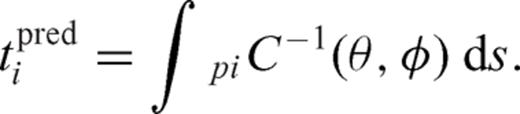
Here, pi represents the ith wave path; wi is the weight associated with the ith path, which is a function of the measurement uncertainty or the number of paths within the cluster that generated the measurement and a qualitative grade supplied by the analyst during measurement. Here, we use wi = 1, since only high-quality dispersions and path-averaged measurements characterize the input data. tobsi and tpredi are the observed and predicted phase or group traveltimes along the ith path and S is the region on which the inversion is performed. The regularisation parameter λ is a very important factor, which controls the trade-off between fitting the traveltime and smoothing the resulting maps. Tomographic maps for phase and group velocity are made for several regularisation parameters, λ = 0.02, 0.1 and 0.2. We prefer to use the value of λ = 0.2, which gives relatively smooth maps with small solution errors.
Another criterion evaluating the quality of the solution is the comparison of the initial mean square traveltime residual and the remaining unaccounted residual. If for one path the traveltime residual exceeds three times the unaccounted residual, then the corresponding path is eliminated from the data set and the solution is recalculated (Yanovskaya 1998). For different periods, the number of data before and after the selection and the initial and remaining mean square traveltime residuals are listed in Table 1.
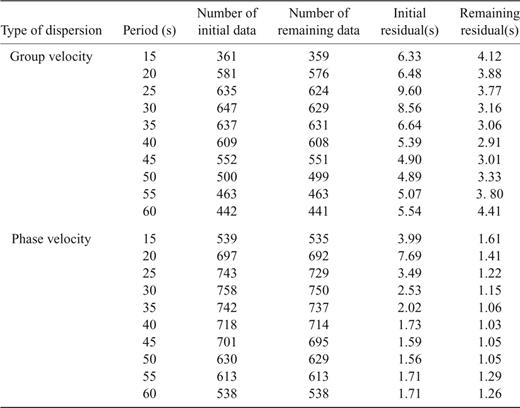
Number of measurements and values of the initial and remaining traveltime residual as a function of period for group and phase.
During tomography, spatial resolution also is simultaneously evaluated using the method described by Yanovskaya (1997), which is similar to that proposed by Backus & Gilbert (1968) for 1-D problem. Fig. 5 is the corresponding resolution for Rayleigh wave phase and group velocity maps at periods of 30 s. The average resolution across NE China is about 100—200 km for our tomographic maps at 30 s, but becomes degraded at longer or shorter periods and near the borders of the region where the path coverage is poor. The tomography also provides estimation of uncertainties in the phase and group dispersion maps (Fig. 6). The standard errors associated with the regionalized phase and group velocities at periods of 30 s also are presented in Fig. 5. The average standard errors phase and group velocities at periods of 30 s are 15 and 25 m s−1 and uncertainties increase near the edges of the maps.
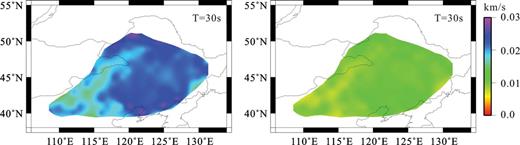
Standard errors estimated for the Rayleigh wave group (left) and phase (right) velocity maps at 30-s period.
4.2 Multipathing and finite frequency effects
Surface wave tomography used in this study is based on traditional ray theory. It assumes that surface waves propagate along the source station great circle without mode coupling and that the deconvolution of the near-station waveform from the far-station waveform is only sensitive to the structure along two stations. However, surface waves may deviate from GCPs, resulting in changes in propagation direction and focusing or defocusing of energy and multipathing (e.g. Li 2003; Zhou 2004). To overcome these problems, other surface wave tomography techniques (e.g. array based tomography) have been developed and applied in several regional studies. These studies (Li 2003; Forsyth & Li 2005; Yang & Forsyth 2006) suggest that array tomography methods, such as the two plane wave inversion, should improve the resolution and mitigate multipathing effects and the finite frequency effect. However, at periods shorter than 60 s, as in this study, the finite frequency effect is not very large (e.g. Zhou 2005) and may be ignored. In addition, our high-density seismic array allows us to select events with less multipathing. In this study, we have already removed the potential artefacts at the frequency—time analysis stage by rejecting events with complex group velocity patterns (see Section 3).
4.3 Lateral variations in Rayleigh wave dispersions
Using the tomographic inversion method as described in the previous section, Rayleigh group and phase velocity maps at periods from 15 to 60 s with an interval of 5 s have been produced. Fig. 7 shows the phase and group velocity distribution at Rayleigh wave periods of 15, 20, 30, 40 and 60 s. Only those areas where the spatial resolution is better than 400 km are shown. Owing to the dense ray coverage and short ray path, our results provide better lateral resolution in the NE China region compared with previous global (Trampert & Woodhouse 1995; Larson & Ekström 2001) and regional scale (Huang 2003; Yi 2008; Feng 2010; Sun 2010) phase and group velocity studies. Overall, the lateral variation patterns in our phase and group velocity maps for corresponding periods are quite similar. At the same time, different depth sensitivities of Rayleigh phase and group velocity dispersions are nicely imaged. For example, the pattern of phase velocity variations at a period of 20 s is similar to that of group velocity variations at a period of 30 s (Fig. 7).
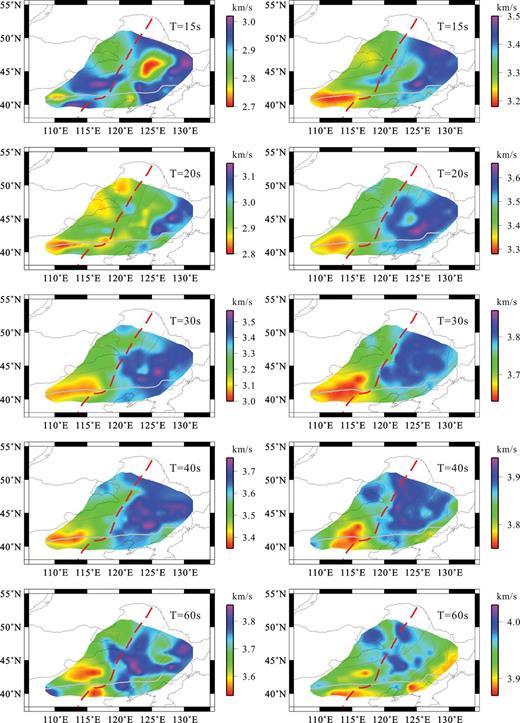
Rayleigh wave group (left) and phase (right) velocity maps for periods of 15–60 s.
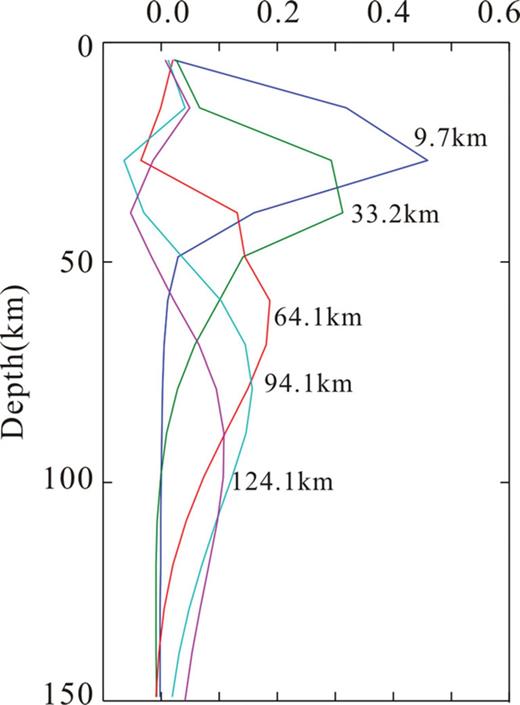
It is evident that the most sensitive depth of Rayleigh waves increases with period. In order to relate the maps of velocity dispersions at a particular period to depth range, the sensitivity kernels of Rayleigh phase and group were calculated (Fig. 8). The 1-D versus model used in the calculation of sensitivity kernels (hereafter, referred to as SR model) is taken at location 124°E, 44°N from the 3-D global shear-velocity model of Shapiro & Ritzwoller (2002). Fig. 8 shows that the maximum amplitude is located at about a 10 km depth for the 15-s sensitivity kernel of Rayleigh group velocity and at about 60-km depth for the 60-s interval. However, depth sensitivity kernels of Rayleigh phase velocity reflect a deeper depth than those of Rayleigh group velocity. Our Rayleigh phase and group velocity maps in the period range of 15—60 s reflect lithospheric structures between 10 and 120 km.
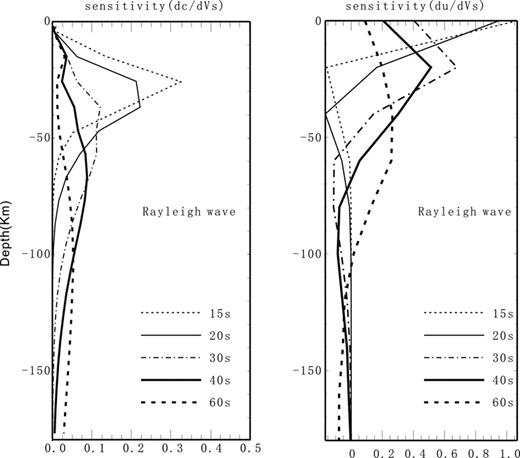
Depth sensitivity kernels of Rayleigh wave phase (left) and group (right) velocity for periods between 15 and 60 s.
The group velocity variations at short period (15 s) are mostly correlated with shallow geological features (Fig. 7). Lower group velocity was observed in the central part of NE China. A similar anomaly was reported in a group velocity map at 10 s period by Sun (2010). The low group velocity can be correlated with the thick sediments in Songliao Basin, with an average thickness of 5 km, which locally exceeds 15 km (Liu 2008). Other sedimentary basins (e.g. Halar Basin, Liaodong Bay, Bohai Basin) in NE China with lower average Q values (Zhao 2010; Sun 2012) also manifest themselves on the maps as low group velocities at 15-s periods, but were not shown in published group velocity maps (Larson & Ekström 2001; Huang 2003; Sun 2010). All these observations also verify the fact that our results provide better resolution than those given by previous studies.
Phase velocities at 20-s periods and group velocities at 30 s correspond to a layer at approximately 30—40 km depth and are strongly influenced by the velocity structure in the lower crust and upper mantle, as well as by crustal thickness. Passive seismic detection and receiver function analyses show that crustal thickness has a large variation across NE China. The Moho reaches a depth of 41 km beneath the Great Xing'an Range region (Liu & Niu 2011; Xiong 2011), whereas it is less than 28 km beneath the eastern flank of the Songliao Basin (Liu & Niu 2011). Our results show that there is a good correlation between the Rayleigh velocity maps at these periods and crustal thicknesses, with higher velocity in regions with thin crust and lower velocity in regions with thick crust (Fig. 7).
Rayleigh wave phase and group velocities with periods >30 s are primarily sensitive to depths between 30 and 120 km, but have peak sensitivity between 40 and 100 km (Fig. 8). A prominent high-velocity anomaly on the 40—60-s phase and group velocity maps appears in the Songliao Basin region, surrounded by lower velocities of the Jiamusi block and Sino-Korean Craton (Fig. 7). Similar distributions of Rayleigh phase and group velocities are observed on the tomographic images presented by Sun (2010).
5 Inversion for Velocity Structure and Results
5.1 Inversion for S-velocity structure
Although phase and group velocities are simply related, the simultaneous inversion of two types of velocities places tighter constraints on possible models than those from the inversion of either alone (Shapiro & Ritzwoller 2002). Rayleigh waves are mainly sensitive to vertically polarized shear wave speeds (Vsv), but for simplicity in this study we also refer to it as a shear wave speed or Vs model. The Rayleigh wave phase and group velocity dispersion curve for each grid node obtained above are jointly inverted for 1-D shear wave velocity structure using the inversion method of Herrmann & Ammon (2004). Then, a simple linear interpolation scheme is adopted to construct a 3-D structure in the NE China and its surrounding region.
The initial models determined the structure in the upper mantle of China from the global 1-D reference model AK135 (Kennett 1995) and structure in the crust from the 3-D shear-velocity models of Sun (2008) who reports a four layer crust model (sedimentary, upper crust, middle crust, lower crust) from body wave phase data. Layer thickness was set to 10 km below the Moho interface. We refer to this initial model as SEAPS. Since Rayleigh wave dispersion is primarily sensitive to S-wave velocities, only shear wave velocity was inverted. The thickness and Vp/Vs in each layer was fixed during the inversion and density was estimated from the P-velocity.
We used a differential inversion scheme, which minimized both the magnitude of the error vector between the observed and computed velocities and differences between adjacent layers, to avoid large velocity changes between adjacent layers. To stabilize the inversion, appropriate damping values were chosen at different stages. A slightly higher damping value of 10 was adopted to avoid an overshoot in the initial two iterations and then a damping value of 0.1 was chosen in the following iterations. The inversion was not stopped until the theoretical dispersion curve fell within the error bars of the observed dispersion curve (Fig. 9).
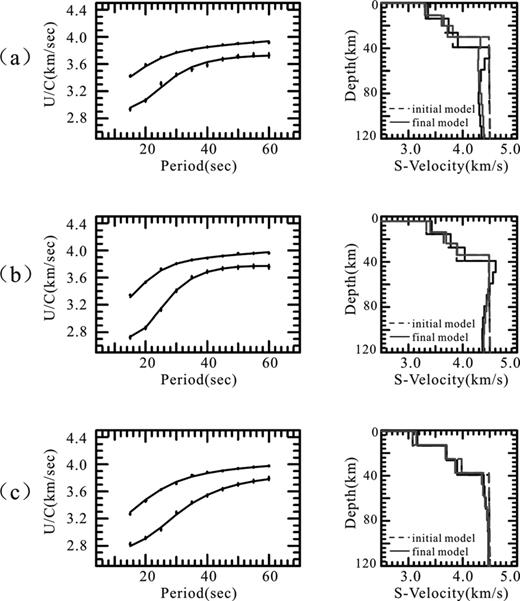
Inversion results and data fit for three different grid points in NE China. These estimated models and data fits shown here correspond to grid nodes located in (a) Jiamusi block (127°N, 43°W), (b) Songliao block (124°N, 46°W) and (c) Xing'an block (119°N, 47°W). The left panels show measured dispersions (circles with error bars) and theoretical dispersions calculated from the final models. The right panels show the reference (dashed line) and final (solid line) models for two different initial models: SEAPS model (black) and RFM model (gray).
Fig. 9 shows typical examples of the inversion results and data fit. These predicted dispersions show good fit with the measured dispersions. Our estimated models herein hardly modify the starting structure characteristics of the upper crust. This is expected because our dispersion data cannot constrain the first 10 km of the crust. The reliability of the estimated model is shown by resolution kernels obtained from the rows of the resolution matrix (Fig. 10). The resolution kernels plotted in Fig. 10 correspond to the velocity model of a point in the Songlia block (46°N, 124°E). As is known, a larger peak value indicates higher resolution to the model parameter. The peak values of the resolving kernels are larger at shallow and intermediate depths, up to 100 km and become smaller at greater depth, suggesting the resolution of shear wave velocity structure in the lower crust and upper mantle above 100 km is good, but poor for the deeper layers.
Normalized resolution kernels for the velocity models located in Songlia block (46°N, 124°E).
5.2 Influence of the initial Moho depth
Moho depths have turned out to be an important constraint for our inversion. A comparison of Moho depths from the SEAPS model (Sun 2008) and receiver function analyses (Liu & Niu 2011) reveals that there are differences of more than 10 km between the two models, especially in the eastern flank of the Songliao Basin (Fig. A1). To test the impact of the Moho depth on the shear wave velocity results and the trade-off between them, we constructed another initial model based on the SEAPS model (Sun 2008). Since we did not have an accurate P- and S-wave velocity in the crust, we applied P- and S-wave velocities at crustal depths directly in relation to the new initial model and only assigned differences of crustal thickness to the upper crust, middle crust and lower crust. The resulting initial model is referred to as RFM.
In Fig. 9, we also plotted the RFM initial models (grey dashed lines) and corresponding final (grey solid lines) models for the same cells. In the Xing'an block (Fig. 9c), the final models are very similar, because the Moho depths from two starting models are only slightly different. In Songliao and Jiamusi blocks (Figs 9a and b), discrepancies in the inversion results are observed in the lower crustal layer and shallow mantle. Our tests show the uncertainties are less than 0.2 km s—1 in the shear wave velocity using two different initial models.
In Fig. A2 we show four depth maps of the shear wave velocity model derived from the SEAPS starting model and the RFM starting model for comparison. We found that the resulting shear wave velocity models at most places are similar irrespective of the initial models, especially at mantle depths. The inversion results within the lower crust show similar high- and low-velocity characteristics, although the resolute velocities show some differences between the respective models (Fig. A2). Below, we present and discuss the models derived from the SEAPS model in more detail.
5.3 3-D S-velocity models
Fig. 11 shows the shear wave velocity model at four different depths: (a) in the lower crust, (b) 60 km, (c) 80 km and (d) 100 km beneath the surface. To better view our 3-D model, two transects along 124°E longitude and 46°N latitude were sliced and shown in Fig. 12. The main features of these models are described below.
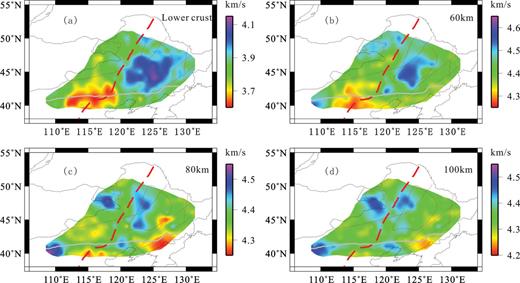
Horizontal slices of the 3-D S-velocity model at the depths of (a) lower crust, (b) 60 km, (c) 80 km and (d) 100 km.
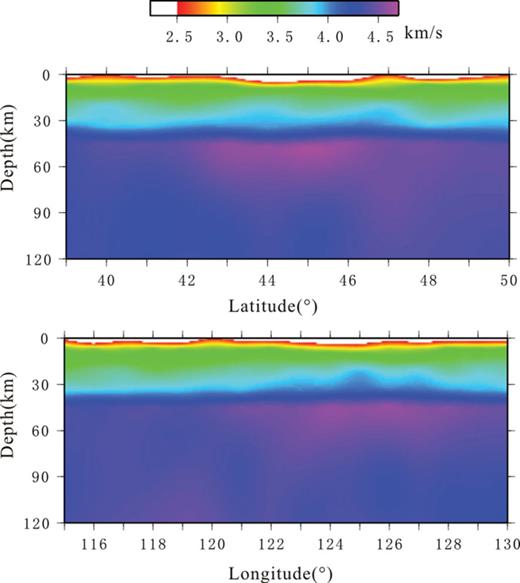
Vertical slices of the 3-D S-velocity model plotted along 124°E longitude (top) and 46°N latitude (bottom).
In the lower crust, a large area of high velocity (>3.9 km s—1) is imaged beneath the Songliao Basin, which matches that of typical cratonic regions (Shapiro & Ritzwoller 2002). Lower velocity (3.6—3.7 km s—1) is found beneath the northern part of the NCC. Such a low crustal low-velocity anomaly is similar to that of continental rift areas (Shapiro & Ritzwoller 2002) and has been previously observed by body wave and surface wave tomography studies (Tian 2008; Sun 2010; Pan 2011). Another interesting feature of our velocity model in the lower curst is the contrast between high velocities in the Songliao block and low velocities in the Xing'an block and the transition is close to the North South Gravity Lineament (NSGL).
High upper mantle velocity is observed beneath the Songliao Basin down to 70 km and is underlain by a normal-to-low uppermost mantle velocity for depths below 80 km (Figs 11 and 12). The high-velocity anomalies above 70 km indicate a thin lithospheric lid in this region compared with continental cratons (Shapiro & Ritzwoller 2002; Lebedev & Nolet 2003). This observation is in good agreement with some previous surface wave studies (Huang 2003; Feng 2010; Sun 2010) but differs from the body wave tomographic model made by Li (2006), which found a 200-km-thick high-velocity lithospheric root beneath the Songliao Basin. Although the northwestern part of NCC is only partially imaged in this study, high upper mantle velocity is also found beneath Ordos Block and extends at least to 100-km depth. This observation is consistent with many new published tomography results (Huang 2003; Li 2006; Tian 2008; Feng 2010; Sun 2010). Obvious low-velocity anomalies exist in the uppermost mantle beneath the northern part of the NCC and Jiamusi Block (Figs 11 and 12), which also were mapped in many tomography studies (Huang 2003; Li 2006; Zhao 2009; Feng 2010; Sun 2010).
6 Discussion and Conclusions
Newly deployed broad-band stations in NE China allow us to improve the path coverage and therefore image the lithospheric structure of northeastern China with higher resolution. We estimate the interstation Rayleigh wave phase and group velocity dispersions using teleseismic waveform data recorded by several regional seismic networks in NE China. These dispersions are used to construct phase and group velocity tomographic maps for different periods ranging from 15 to 60 s. Furthermore, a 3-D shear velocity model of the crust and uppermost mantle to a depth of about 120 km are determined by jointly inverting the Rayleigh wave phase and group dispersions. Our model verifies the existence of strong lateral variations of S-wave velocity in NE China and reveals many significant characteristic that are in good agreement with previous studies (e.g. Huang 2003; Li 2006; Zhao 2009; Feng 2010; Sun 2010), but also resolves a number of new features. We discuss below the feature of the velocity anomalies beneath the Changbaishan volcanic region and Songliao Basin and their implications.
6.1 Low velocity anomaly beneath the Changbaishan volcanic region
The Changbai volcano is part of a Quaternary volcanic field, located on the eastern margin of the Songliao Basin. A prominent feature in the Changbai region is the low velocity anomaly in the upper mantle (Figs 11 and 12). Previous studies (Huang 2003; Li 2006; Zhao 2004, 2009; Feng 2010; Sun 2010) show that the low-velocity anomaly extends down to about 410 km depth and suggest that the formation of the Changbai volcanic field is related to the upwelling of hot asthenospheric materials (Zhao 2004, 2009). However, expected low-velocity anomalies are not observed in the crust beneath the Changbai active volcanic region, where high-average crustal Vp/Vs ratio (Hetland 2004; Liu & Niu 2010) and low-velocity and resistivity anomalies (Tang 2001; Zhang 2002; Hetland 2004; Duan 2005; Zhan 2006) in the middle-to-lower crust are observed and have been interpreted as an evidence for partial melting and presence of magma chambers in the crust (Tang 2001; Zhang 2002; Duan 2005; Zhan 2006). We did not observe the low velocity in the volcanic areas either because of low resolution of our model or locally distributed partial melt.
6.2 Evidence for lithospheric removal of Songliao Basin
Many geologic and geophysical observations suggest that more than 100 km thickness of cratonic mantle lithosphere has been lost, in part or in whole, beneath the NCC during the Mesozoic and Cenozoic eras (e.g. Deng 1994, 1996; Huang 2003; Wu 2008; Li 2009). However, there is some debate as to whether NE China has been involved in the lithospheric removal (e.g. Huang 2003; Lebedev & Nolet 2003; Li 2006; Wu 2008), which would be pivotal to understanding the possible mechanism of lithospheric removal. For example, the removal of lithospheric mantle in the whole of eastern China would probably be related to the subducting Pacific Plate (Deng 1994, 1996). In contrast, the removal of only a limited amount of lithospheric mantle in the NCC can be explained by the collision of the Yangtze block and the NCC (Gao 2002).
Our S-velocity model (Figs 11 and 12) reveals a high-velocity lid with a thickness of ∼70–80 km overlying a lower velocity zone beneath Songliao Basin. This observation also is consistent with results of Wang (2001), who presented a regional thermal model based on numerous heat flow measurements in China and concluded that the lithospheric thickness of Songliao Block is about 70 km. A thin lithospheric lid in Songliao Basin implies that most of NE China has been involved in the lithospheric removal, similar to that in the central and eastern blocks of the NCC (Huang 2003; Li 2009). Such lithospheric thinning and low-mantle velocity in eastern China may result from hot material upwelling induced by Pacific subduction. Our model also shows a high S-wave velocity in the lower crust of the Songliao Basin, which is different from that of the NCC (e.g. Li 2009) but similar to that of typical cratonic regions (Shapiro & Ritzwoller 2002). This suggests that lithospheric rejuvenation may result in the removal of mantle lithosphere but not the lower crust.
ACKNOWLEDGMENTS
The authors wish to thank two anonymous reviewers who gave constructive comments that helped improve the manuscript. We are grateful to Yuanyuan Fu for proofreading the manuscript. Waveform data for this study were provided by the Data Management Centre of China, National Seismic Network at Institute of Geophysics, China Earthquake Administration. This study was supported by NSFC grant 90814013, 41074067, Sinoprobe grant SinoProbe-02—03 and the National Nonprofit Institute Research Grant of the Institute of Geophysics, China Earthquake Administration Grant DQJB11B04.
REFERENCES
SUPPORTING INFORMATION
Additional Supporting Information may be found in the online version of this article:
Figure S1. Difference in Moho depth between SEAPS model (Sun et al. 2008) and RF model (Liu et al. 2011) (smoothed on a 1° × 1°. grid).
Figure S2. Shearwave velocity model derived from SEAPS starting model at four different depths (left) and the models derived from RFMstarting model at corresponding depths (right) for comparison.
Please note: Wiley-Blackwell are not responsible for the content or functionality of any supporting materials supplied by the authors. Any queries (other than missing material) should be directed to the corresponding author for the article.
