


Summary
We study the influence of microstructural variables on seismic wave speed anisotropy in crustal rocks. The bulk elastic properties and corresponding wave velocities are calculated for synthetic rock samples with varying amounts of muscovite and quartz, different muscovite and quartz grain orientations and varying spatial distributions of the muscovite grains to investigate the sensitivity of seismic wave speed anisotropy on these characteristics. The asymptotic expansion homogenization method combined with finite element modelling is used to calculate bulk stiffness tensors for representative rock volumes and the wave velocities are obtained from these tensors using the Christoffel equation. The aim of this paper is to (1) demonstrate how wave speeds computed from the rigorous asymptotic expansion homogenization method compare with those generated using stiffness tensors derived from commonly applied analytic estimates, and (2) explore how different microstructural variables influence seismic wave speeds.
Our results show that the muscovite grain orientations have a significant influence on the wave speeds. Increasing the modal fraction and alignment of muscovite grains leads to greater seismic anisotropy of the rock. The P-wave speed at an incidence angle of 45° between the foliation and seismic wave path is dependent on all tested microstructural variables, with the orientation distribution of muscovite grains having the largest effect. This so-called P45 effect is an important measure of wave speed anisotropy and here we provide the first analysis of its sensitivity to microstructural variables. Although we have explicitly considered only muscovite grains in this study, the methodology and observations are expected to apply in general to other phyllosilicates.
1 Introduction
The distribution and spatial orientations of elastic anisotropy in the Earth's crust and mantle carry valuable information about gradients in thermal, mechanical and kinematic parameters arising from mantle–crust coupling and tectonic plate interactions (e.g. Silver 1996; Karato 2008). Causes for seismic anisotropy are (1) the presence of aligned fractures or cracks in the upper 10–15 km of the crust (e.g. Crampin 1981; Kaneshima et al. 1988), (2) the layering of isotropic material (e.g. Backus 1962) and (3) the development of mineral lattice- and shape-preferred orientations (LPO and SPO, respectively) during progressive accumulation of strain (e.g. Mainprice & Nicolas 1989; Mainprice 2007). Measurements of shear wave splitting in global tomographic studies are commonly attributed to anisotropy in the mantle (e.g. Silver 1996; Savage 1999). Mantle anisotropy is considered to reflect the development of LPO in anisotropic olivine grains as a function of mantle kinematics (e.g. Karato 1987; Nicolas & Christensen 1987; Silver 1996; Savage 1999; Mainprice et al. 2000; Tommasi et al. 2000; Montagner & Guillot 2002; Mainprice 2007; Karato et al. 2008).
Crustal anisotropy can affect the shear wave splitting values caused by mantle structures. To do so the degree of crustal anisotropy must be significant and appropriately oriented (e.g. Okaya et al. 1995; Godfrey et al. 2000). Seismic anisotropy in the continental crust has been observed in numerous seismological studies, and many workers seek to relate the observed seismic anisotropy to crustal deformation and metamorphism (e.g. Okaya et al. 1995; Weiss et al. 1999; Godfrey et al. 2000; Okaya & Christensen 2002; Okaya & McEvilly 2003; Vergne et al. 2003; Ozacar & Zandt 2004; Shapiro et al. 2004; Sherrington et al. 2004; Lloyd & Kendall 2005; Champion et al. 2006; Mahan 2006; Mainprice 2007; Xu et al. 2007; Lloyd et al. 2009; Readman et al. 2009).
Petrophysically determined data are commonly used to interpret velocity structures, and numerous velocity measurements have been made for rocks that form important constituents of the Earth's crust and upper mantle (e.g. Birch 1960, 1961; Simmons 1964; Christensen 1965, 1966; Ji et al. 2002). Another method for calculating bulk properties of polycrystalline rocks requires the measurement of crystallographic orientations of minerals in a polished thin section. Whereas earlier workers made crystallographic measurements using optical or X-ray techniques, electron backscatter diffraction (EBSD) techniques are rapidly growing in popularity (e.g. Mauler et al. 2000; Bascou et al. 2001; Lloyd & Kendall 2005; Valcke et al. 2006; Lloyd et al. 2009). Once the crystallographic data for a sample are processed, a variety of methods can be used to calculate a bulk elastic tensor, the most common and straightforward of which are the Voigt and Reuss bounds (e.g. Mainprice & Humbert 1994). Several means of these two bounds have been proposed, including the arithmetic mean or Voigt-Reuss-Hill (VRH) average (Hill 1952), the geometric mean (Matthies & Humbert 1993) and generalized mean (Ji et al. 2004). These analytical means commonly lead to results that are close to experimentally derived values, but the disadvantage of using them is that they do not explicitly account for grain shapes, grain distributions or grain-to-grain interactions, and as such have no real physical justification. In addition to the analytical methods described, several rigorous theoretical methods have been proposed that take into consideration the elastic interaction of the individual grains with the background medium, including the self-consistent (e.g. Hill 1965; Willis 1977; Mainprice 1997) and differential effective medium (e.g. Bruner 1976) methods. Mainprice & Humbert (1994) have demonstrated that the self-consistent method yields wave speeds that are very close to those obtained using the geometric mean. The theoretical methods are generally considered to be computationally too involved for practical application (Mainprice 2007), and the VRH average is mostly used in the Earth sciences' literature to calculate the effective elastic properties of polymineralic rocks (e.g. Lloyd & Kendall 2005; Valcke et al. 2006; Tatham et al. 2008; Lloyd et al. 2009).
In this paper we present a method that accounts not only for the modal fraction of the constituent minerals and their individual crystallographic orientations (texture of the microstructure), but also the spatial arrangement of the grains (stereology of the microstructure). Bunge et al. (2000) estimated that the stereological parameters may contribute up to 25 per cent of the maximum texture influence. The numerical method we present in Section 2.2 is based on asymptotic expansion homogenization (AEH) and finite element (FE) analysis for the computation of the bulk stiffness for polymineralic rocks.
Section 2 first provides background information on the determination of homogenized elastic constants of rock microstructures via common analytic estimates and bounds. This is followed by a review of the more rigorous AEH method and its FE implementation. A more extensive review of this method can be found in the Appendix. We also give background information on the determination of the three wave speed velocities in unbounded rock media given a propagation direction, and describe the measures of seismic anisotropy. Section 3 provides details of how the synthetic microstructures were created. Section 4 compares wave speeds calculated from the analytic- and AEH-derived stiffnesses and presents the findings from a quartz-muscovite rock parametric study. Microstructural characteristics that can contribute to the bulk elastic properties of a polymineralic rock are (1) the modal abundances, (2) the crystallographic and geometric orientations, (3) the spatial arrangements and (4) the shapes of its constituent minerals. Because natural rock samples show considerable variability in these characteristics we will assess their influence on elastic rock properties and seismic wave velocities by systematically varying (1) the modal abundance, (2) crystallographic orientation and (3) spatial distribution of a simplified, computer-generated, synthetic microstructure containing only quartz and muscovite grains. The bulk stiffness tensor is computed from the synthetic microstructure, which then is used to calculate seismic wave velocities and measures of seismic anisotropy such as P delay, shear wave splitting, percentage anisotropy of the P and S waves and the normalized P-wave velocity in the diagonal (45°) direction.
2 Background
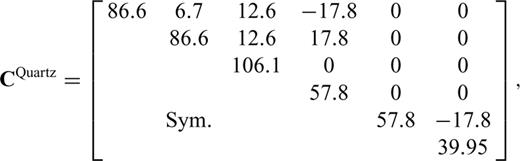
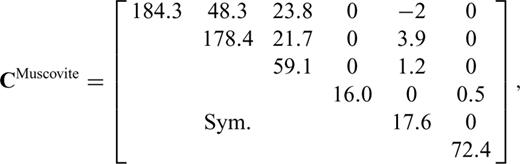
We consider polycrystalline rocks consisting of quartz and mica grains with a simplified microstructure, similar to that depicted in Figs 1(b) and (c). Each location within the microstructure has a phase and orientation description, so that a microstructure is created in which each mineral has its own single-crystal stiffness tensor relative to its principal crystallographic axes that is transformed to a common sample frame using the Bond matrix (Bond 1943).
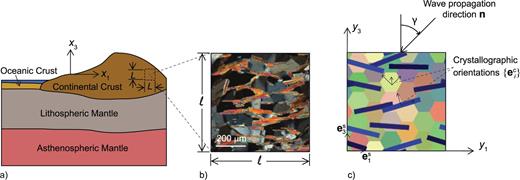
(a) Schematic of large-scale structure and relation between macroscale L and microscale ℓ. (b) Photomicrograph of a quartz-muscovite schist in cross-polarized light. The grey grains are quartz and the bright coloured grains are muscovite grains. (c) Representative synthetic quartz-muscovite microstructure. γ is the incidence angle, eSi and eCi indicate the reference orientations for the sample and crystal respectively. The macroscale is analysed using x-coordinates and the microscale is analysed using y-coordinates.
2.1 Analytic bounds and estimates
2.2 AEH formulation with FE implementation
All estimates presented in Section 2.1 depend only on the relative volume fraction and crystallographic orientation of mineral grains that constitute the rock, and do not take the elastic interplay among the different grains into account. Interaction between neighbouring grains result in intragrain heterogeneous stress and strain fields that may be resolved by solving the 3-D elastic equilibrium equations at the microscale while enforcing the continuity of displacements and tractions across grain boundaries. AEH is one such structure-based approach for the comprehensive micromechanical analysis of heterogeneous materials. An important difference between AEH and the averaging methods described in the Introduction is that AEH has explicit physical meaning; it provides a macroscale solution that arises from the intricacies of the microstructure, so it captures the effects of the grain distributions and resulting grain-scale interactions. AEH has a strong mathematical basis (Bensoussan et al. 1978) and has been extensively validated and successfully used to analyse fiber- and particle-reinforced composite materials (e.g. Guedes & Kikuchi 1990; Fish & Wagiman 1992; Vel & Goupee 2010).
The AEH method simultaneously considers two distinct scales, namely the characteristic length L of the large-scale structure of interest and the width ℓ of the polycrystalline sample (Fig. 1a). When the rock is subjected to a displacement or stress, the resulting internal stresses and strains will be distributed heterogeneously throughout the microstructure (e.g. Tullis et al. 1991; Johnson et al. 2004; Naus-Thijssen et al. 2010). If the microstructural geometry is periodic, the resulting stresses and strains will vary rapidly on the scale of the periodicity (Sanchez-Palencia 1981; Goupee & Vel 2010). Accordingly, all macroscale field variables are defined to have a periodic dependence on the microstructure. As long as the macroscale is much larger than the microscale (greater than three orders of magnitude), the bulk elastic properties of the rock can be evaluated using AEH. Although real rocks do not necessarily exhibit a strictly periodic microstructure, the synthetic microstructures considered in this work are periodic. Terada et al. (2000) have demonstrated that, for a given sample volume, periodic boundary conditions yield more accurate bulk stiffnesses than either displacement or traction boundary conditions even when the sample volume does not exhibit actual periodicity at the microscale. This is due largely to the boundary effects associated with displacement or traction boundary conditions. Thus, assuming a periodic microstructure, while not necessarily true for a given rock sample, leads to the most accurate results.

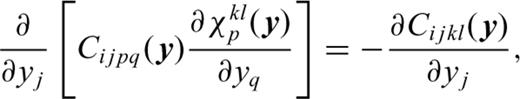
The characteristic functions χkli (y) are computed using standard FE techniques (e.g. Cook et al. 2002). The entire sample domain is discretized using six-noded triangular elements with quadratic shape functions (e.g. Cook et al. 2002). A FE mesh that conforms to the grain boundaries is used to model the complex heterogeneous microstructure (e.g. see Fig. 2d). The partial differential equations for the characteristic functions lead to a linear system of equations for the nodal values which are solved using periodic conditions on the four boundaries of the sample domain. The characteristic function values at an arbitrary point in the sample domain can be inferred from the nodal values and the shape functions. The characteristic functions χkli (y), once computed, are used to obtain the effective stiffnesses using eq. (4). In addition, it is possible to compute the grain-scale distributions of the strains and stresses for prescribed macroscopic deformation using the characteristic functions. Details of the AEH method and the FE implementation are presented in the Appendix.
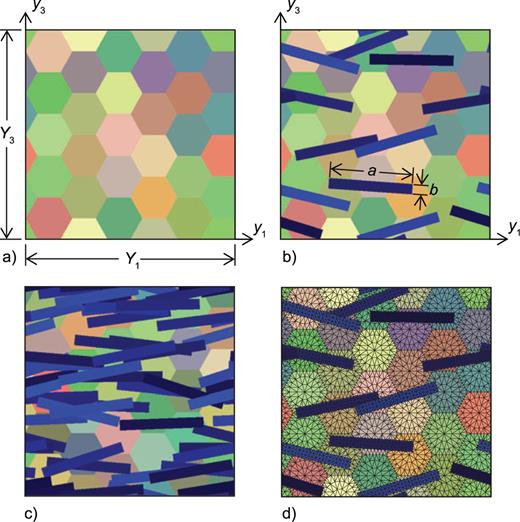
(a) Base cell of sample synthetic microstructure showing the grid of quartz crystals, the different colours indicate different crystallographic orientations. (b) Completed synthetic microstructure with rectangular muscovite grains yielding a muscovite modal fraction of 0.2 and α= 10°. The different colours of blue indicate different orientations for the a- and b-axes of the muscovite grains. (c) Sample synthetic microstructure with a muscovite modal fraction of 0.6 and α= 10° and (d) AEH finite element mesh corresponding to the microstructure in (b).
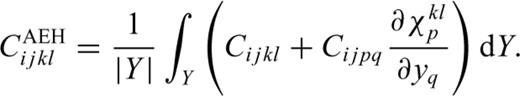
The AEH formulation is applicable to 3-D microstructures. However, due to the inherent uncertainty in microstructural topology in the third dimension, and the high computational cost involved in meshing and solving a full 3-D model, we concern ourselves here with 2-D microstructures for which the grain boundaries are projected into the third dimension (y2 coordinate direction). Since none of the desired field variables χkli vary as a function of the y2 coordinate, a 2-D FE mesh in the y1−y3 plane is sufficient for obtaining all the non-zero elastic constants in the 3-D homogenized stiffness tensor CAEHijkl as long as all three degrees of freedom are retained at each node.
2.3 Wave propagation and measures of seismic anisotropy
An elastically anisotropic rock will exhibit different P and S velocities when the propagation direction n of the incoming seismic wave is changed. Therefore we plotted our velocity data against a varying incidence angle γ. The incidence angle is the angle between the propagation direction and the y3 axis in the y1−y3 plane (Fig. 1b).
3 Creation of the Synthetic Rock Microstructures
To systematically investigate the role of different microstructural variables we created simplified synthetic rocks composed of (1) different amounts of quartz and muscovite, (2) with varying crystallographic orientations and (3) with varying spatial distributions of the muscovite grains. All created microstructures are periodic in both the y1 and y3 directions, as is assumed in the AEH method.
4 Results and Discussion
We used the AEH method, with an FE implementation, to study the influence of different microstructural variables on seismic wave speed anisotropy in a simplified quartz-muscovite rock sample. We also compared the results to values calculated with the more commonly used Voigt and Reuss bounds. A detailed FE convergence study was performed to ensure that the AEH results presented in the figures are accurate. Depending on the complexity of the microstructure, a mesh consisting of anywhere from 1000 to 9000 elements was necessary to obtain wave speeds that are accurate to three significant digits. A representative FE mesh is shown in Fig. 2(d) for the sample microstructure depicted in Fig. 2(b).
Two out of the 18 characteristic functions χpqk (y) required to compute the homogenized stiffness tensor are shown in Figs 3(a) and (b) for the sample microstructure depicted in Fig. 2(b). The characteristic functions χ111 (y) and χ131 (y) represent the fluctuation in the displacement component u1 for unit average normal strain  and unit average shear strain
  , respectively. The other 16 characteristic functions similarly exhibit intricate spatial variations due to the complex elastic interaction among individual grains with different crystallographic orientations.
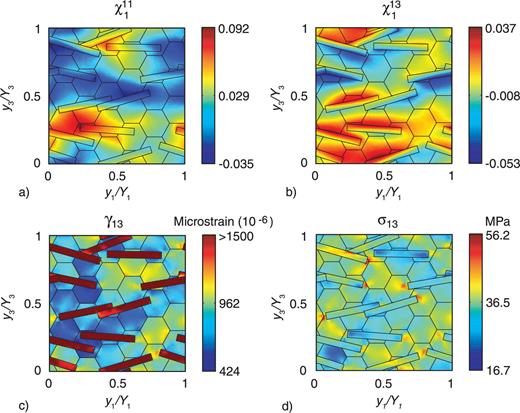
(a) Characteristic function χ111, (b) characteristic function χ131, (c) the microstructural shear strain γ13 and (d) microstructural shear stress σ13 corresponding to the microstructure shown in Fig. 2(b).
Calculation of the bulk elastic stiffness does not require deformation of the sample. However, to show that the AEH-FE method can be used to calculate the grain-scale distributions of stresses and strains during deformation, the microstructure from Fig. 2(b) is subjected to an average shear strain  of 0.1 per cent at atmospheric confining pressure. The characteristic functions are used to obtain the microstructural shear strains and stresses shown in Figs 3(c) and (d), and the bulk stiffness tensor. The muscovite grains experience a larger shear strain than the quartz grains due to their low shear moduli, and as a result, quartz grains off the tips of the muscovite grains show concentrations of shear stress.
As is evident from Fig. 3, the elastic stiffness tensors, modal fractions, crystallographic orientations and spatial arrangement of the grains throughout the model domain cause non-uniform displacement and strain fields. The resulting homogenized stiffness tensor reflects these grain-scale elastic interactions. All homogenized stiffness tensors, which are used to calculate the wave speeds, are generated via an ensemble average of 100 distinct synthetic microstructures with similar modal fractions and distribution statistics. This is done in lieu of meshing and analysing a single large microstructure since it is computationally more efficient to analyse several smaller microstructures and it gives the same homogenized stiffness tensor (e.g. Vel & Goupee 2010).
4.1 Comparison of AEH-FE and analytic estimates
To illustrate the importance of a method that includes the spatial arrangements of grains, in addition to the modal fraction of the constituent minerals and their individual crystallographic orientations, a comparison is made between results calculated with both the AEH method and the analytical averages described in Section 2.1 of some simple two mineral (quartz and muscovite) microstructures. We build three models in which the modal fraction of muscovite (0.2) and the orientations of both the muscovite (α= 0°) and quartz (c-axis//y2) crystals are kept constant, but the distribution of the muscovite grains is varied. In the first model the muscovite grains are grouped horizontally in a band, in the second model the grains are stacked vertically in a band and in the third model the muscovite grains are distributed randomly (Fig. 4). Because the Voigt and Reuss bounds and their means are only based on the modal fractions and orientations of the constituent minerals their results are the same for each model. The results calculated with the AEH-FE method are dependent on the arrangement of the grains, and therefore differ from model to model. Fig. 4 shows the P- and S-wave velocities, P delay and shear wave splitting versus the incidence angle for the three different microstructures.
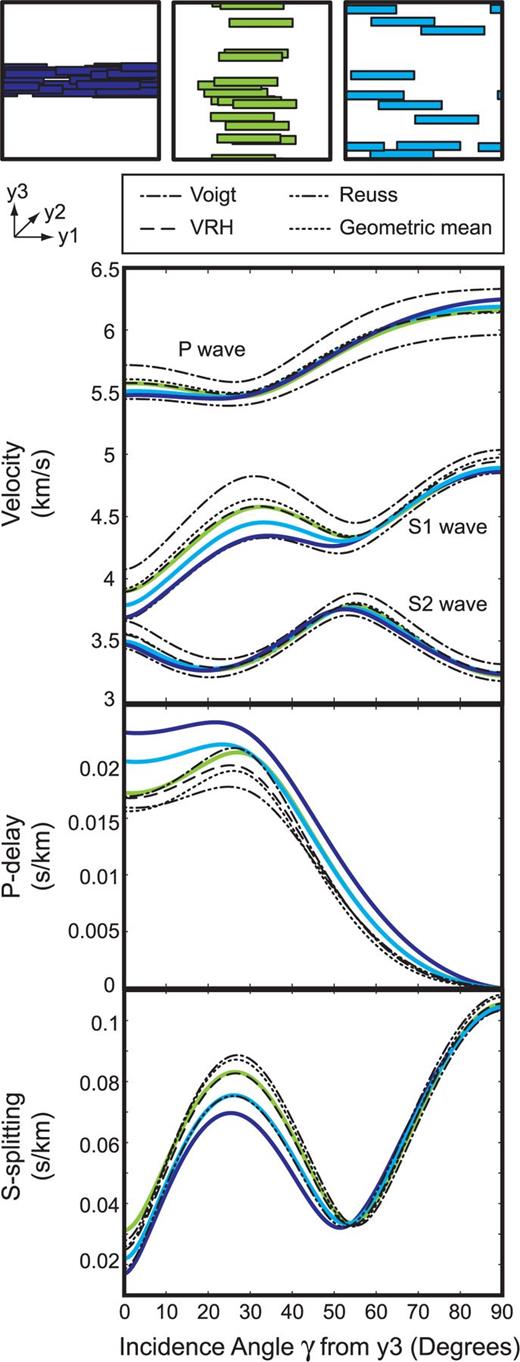
P and S velocities, P delay and shear wave splitting calculated for three separate microstructural models shown at the top of the figure. Each model has the same modal fraction of muscovite (0.2), and the same muscovite (α= 0°) and quartz orientations (c-axis//y2), but a different distribution of muscovite grains. Results for the AEH-FE method are microstructure dependent, and therefore colour-coded for each of the models. Results for the Voigt and Reuss bounds, and geometric and arithmetic means, are not microstructure dependent and therefore identical for each model.
The P-wave velocities calculated with the AEH-FE method for the different models are very similar to the means for incidence angles 30–60°. The sample with the vertically stacked muscovite grains gives AEH-FE results closest to the geometric mean. The model with the horizontally clustered muscovite grains is closest to the Reuss bound at low incidence angles (<30°), and closest to the Voigt bound at higher incidence angles (>60°).
The S1-wave velocities calculated with the AEH-FE method for the different models show the largest variation at incidence angles below 55°. Below this incidence angle the results from the model with the vertically stacked grains is best estimated by the geometric mean, and the model with the horizontally clustered micas is best estimated by the Reuss average. Above this incidence angle the AEH-FE results for the different models are very similar and range from being closest to the geometric mean result at 55°, to being closest to the Reuss result at 90°. The S2-wave velocities are very similar for the entire range of incidence angles. They vary in being closest to the result calculated using the Reuss bound (∼0°), the Voigt bound (∼40°) and the two means (∼25° and ∼90°).
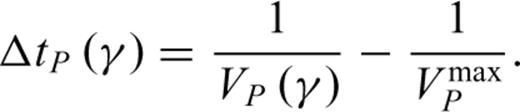
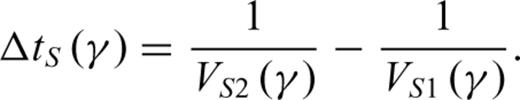
The resulting P-delay curves show a large variety at incidence angles below 30°. The P-delay difference between the models with vertically stacked and banded, horizontal muscovite grains is 0.005 s, or 20 per cent at γ= 0°. The resulting shear wave splitting curves show the largest variation at an incidence angle of approximately 25°, where the difference between the models is 0.015 s, or 18 per cent.
Overall the results for the P and S waves all fall within the Voigt and Reuss bounds, which is as expected. However the results show a non-systematic deviation from the bounds and their means. These results show that, when changing the distribution of grains within a microstructure, the P delay and S-wave splitting can change significantly. This change in values is not captured by the analytic methods.
4.2 Sensitivity analysis of modal abundances, orientations and spatial distribution
A comprehensive parametric study is performed on the synthetic quartz-muscovite rock to assess the roles of modal fraction and crystallographic orientation. To show the influence of both minerals we modelled rocks with no muscovite at all (pure quartz), to a rock consisting of almost pure muscovite. Pure quartz or muscovite rocks are relatively rare in nature, but provide useful end-members for the modelling. Similarly, uniform quartz c-axis orientations are not found in nature, but provide useful end-member configurations. The AEH method is used for our analyses, and the resulting bulk stiffness tensors are used to determine seismic wave velocities and the anisotropy measures as defined in Section 2.3. The microstructural symmetry of the model rocks allows the full incidence-angle behaviour to be evaluated over the range γ= 0–90°.
Fig. 5 shows the VP, VS1 and VS2 velocities, the P delay and shear wave splitting versus the incidence angle for different quartz-grain orientations at different ϕMs. To isolate the effects of ϕMs and quartz orientation, α is held constant at 0°. For pure quartz (ϕMs= 0), the rock behaves nearly isotropic if the quartz grains are oriented randomly, as expected. When the quartz c-axes are parallel toy2, the VP curve displays a fairly isotropic behaviour as well, due to the trigonal symmetry of quartz: the strong axis of the material is oriented perpendicular to the plane of the paper (//y2). The three a-axes all have the same compliance and are all oriented parallel to the plane of the paper (y3–y1), which is the plane in which the incidence angle is taken, leading to very similar velocities at the different incidence angles. The velocity profiles become progressively more similar as muscovite is added owing to its strong elastic anisotropy. For the no muscovite cases, the VS1 and VS2 values are very similar at either incidence angle 32° or 59°, depending on the quartz orientation. With increasing ϕMs these ‘crossover’ locations move closer to one another to eventually occur at about 37° when 90 et al. per et al.et al. cent of the model consists of muscovite. As expected, the P delay and shear wave splitting values increase with increasing muscovite. The greatest P delays occur at γ= 0° where the wave propagates subparallel to the compliant direction of muscovite (c-axis), and the greatest shear wave splitting occurs at γ= 90° where the wave propagates subparallel to the stiff directions of muscovite (a- and b-axes).
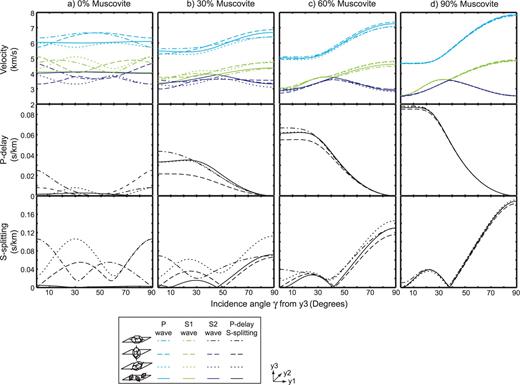
P and S velocities, P delay and shear wave splitting as a function of incidence angle γ for microstructures with muscovite modal fractions of (a) ϕMs= 0, (b) ϕMs= 0.3, (c) ϕMs= 0.6, (d) ϕMs= 0.9 and varying quartz orientations. The standard deviation of the muscovite orientation distribution is 0° for all plots. The axis of the quartz crystal shown in the legend is its c-axis and is oriented parallel to y1, y3 and y2, or oriented randomly in the plots. All results are calculated using the AEH-FE method.
Fig. 6 shows the VP, VS1 and VS2 velocities, the P delay and shear wave splitting versus the incidence angle for different α values at three different ϕMs. To isolate the effects of ϕMs and α, the quartz grains are randomly orientated leading to an effectively isotropic matrix. As in Fig. 5, increasing ϕMs leads to larger variations in the VP, VS1 and VS2 curves, which give rise to greater peak P delay and shear wave splitting values. Conversely, a progressive increase in α reduces the bulk anisotropy, which manifests as diminished P delay and shear wave splitting values for most γ. Another effect of increasing isotropy, caused either by decreasing ϕMs or increasing α, is that the γ at which VS1 and VS2 achieve similar values decreases. This can be seen clearly in the shear wave splitting curves where the ΔtS= 0 s km−1 occurs at an ever smaller incidence angle when either ϕMs is decreased or α is increased.
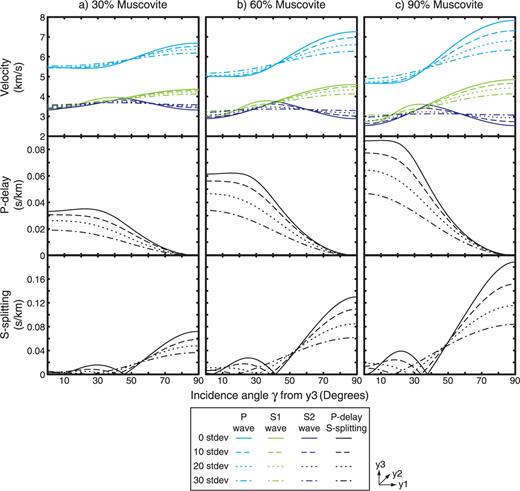
P and S velocities, P delay and shear wave splitting as a function of incidence angle γ for microstructures with muscovite modal fractions of (a) ϕMs= 0.3, (b) ϕMs= 0.6, (c) ϕMs= 0.9, and varying muscovite orientation distributions (α= 0–30). The quartz is randomly oriented for all plots. All results are calculated using the AEH-FE method.
Fig. 7(a) shows AP as a function of ϕMs for microstructures with different quartz orientations and α. It should be noted that the seismic anisotropy AP is calculated at 0 azimuth for incidence angle γ varying over the range 0° to 180° (i.e. wave propagation in the y1–y3 plane). When the quartz grains are oriented randomly or with c-axes parallel to y1 or y2, AP increases with increasing ϕMs. If the c-axes of quartz grains are oriented parallel to y3 the anisotropy decreases until ϕMs is approximately 15 to 22 per cent, depending on α, and then increases with increasing ϕMs. This dip in AP is largely due to the alignment of the stiff axis of the quartz with the compliant axis of the muscovite. Because of this alignment the initial anisotropy that is caused by the stiff axis of quartz being parallel to y3 is progressively overwhelmed by the more anisotropic muscovite, which ultimately dominates the bulk anisotropy. Increasing α has the predicted effect of decreasing AP across the range of ϕMs. As stated in Section 2.3, petrophysically determined AP values in foliated crustal rocks can be greater than 20 per cent. Our results show AP values as high as 50 per cent, but only for rocks consisting almost entirely of strongly aligned muscovite, which are only rarely represented in continental crust.
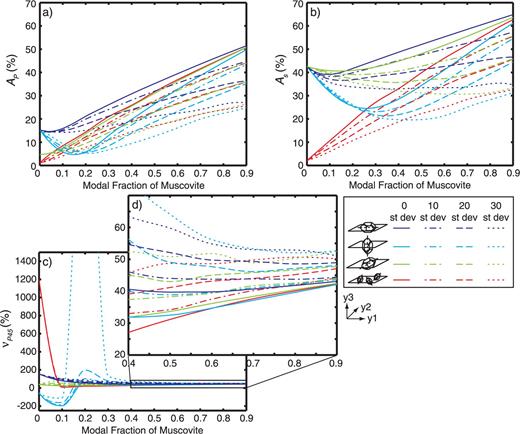
Percentage anisotropy of (a) the P wave, (b) percentage anisotropy of the S waves, (c)–(d) and VP(45°) as a function of the modal fraction of muscovite. All results are calculated using the AEH-FE method.
Fig. 7(b) shows the same information as Fig. 7(a) for AS. Similar trends are apparent between AP and AS, but the crystallographic orientations of quartz clearly have a larger effect on the AS than on the AP. For example, when the c-axes of the quartz grains are oriented parallel to any of the reference-frame axes, AS is 43 per cent for ϕMs= 0. When the quartz c-axes are aligned with y3, between 26 and 45 per cent muscovite is required, depending on α, for muscovite to overwhelm the effects of the quartz anisotropy. When the quartz c-axes are aligned with y1 or y2 this percentage ranges from 9 to 64 per cent. As stated in Section 2.3, petrophysically determined AS values in foliated crustal rocks can be as high as 37 per cent. Our results show AS values greater than 60 per cent, but only for rocks consisting almost entirely of strongly aligned muscovite.
The results plotted in Figs 7(a) and (b) demonstrate that the orientation of matrix grains in mica-rich rocks can play an important role in the bulk elastic behaviour, particularly at low ϕMs. Although the single-point-maximum quartz crystallographic orientations used here are extreme, it is evident that a strongly aligned crystallographic orientations in minerals such as quartz and feldspar in schists can have an important effect on seismic anisotropy measures in mica-rich rocks.
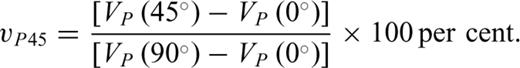
Figs 7(c) and (d) show νP45 versus ϕMs for different quartz grain orientations and α values. When ϕMs is less than approximately 33 per cent, the percentage magnitudes of νP45 are very high (≫100 per cent). These high values reflect the fact that the denominator in the νP45 calculation is the difference between VP(0°) and VP(90°), and at ϕMs values less than approximately 33 per cent, this difference is very small. For the microstructures containing the lower and intermediate amounts of muscovite, the quartz orientation seems to play a major role on vP45. With greater ϕMs, however, this influence starts to diminish and α begins to play a more important role as increasing α leads to increasing νP45. This is supported by the VP curves for ϕMs= 0.6 in Fig. 6, where although VP(0°) and VP(45°) are approximately the same for all α shown, VP(90°) diminishes significantly with increasing α. This trend maintains the numerator in eq. (9), whereas the denominator diminishes with increasing α, thus increasing νP45.
The causes for the P45 effect described in Section 2.3 are still incompletely understood. Okaya & Christensen (2002) reported that rocks of broadly similar mineralogy and microstructure (schists) had very different vP45 values. Our results show that all the microstructural variables we investigated (ϕMs, α and quartz orientation) can influence the vP45, with the orientation of muscovite (α) having the largest effect.
5 Conclusions
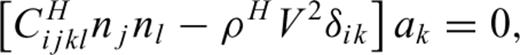
The effects of specific microstructural characteristics on seismic wave speed anisotropy of crustal rocks have been explored. We studied simplified microstructures consisting of quartz and muscovite with variable modal fractions and crystallographic orientations. The homogenized elastic stiffnesses were obtained via the AEH-FE method and were subsequently utilized to calculate the wave speed velocities via solution of the Christoffel equation.
The analyses performed in this work lead to the following conclusions:
- 1
When comparing the wave velocities obtained using AEH-FE with those obtained using the Voigt and Reuss bounds or geometric and arithmetic mean estimates, no systematic trend has emerged between the AEH-FE results and these other methods. The AEH results fall between the two bounds, but even though the geometric and arithmetic means seem to provide reasonable estimates, they generally over- or underestimate actual velocities and measures of anisotropy such as P delay and shear wave splitting. Our results show that grain-to-grain interactions are important in determining the bulk elastic stiffness of a material, and thus the AEH-FE method provides a more robust result than the means of the Voigt and Reuss bounds.
- 2
At minimal to low modal muscovite, the orientation of quartz grains plays a significant role on the shape of the VP, VS1 and VS2 trends as a function of the incidence angle γ. When the quartz grains are oriented randomly, the bulk rock exhibits quasi-isotropic seismic wave speed behaviour. If the quartz grains in the matrix have a strong crystallographic preferred orientation, the wave speeds show a more complicated dependence on the incidence angle.
- 3
For microstructures in which the stiff (c-)axes of quartz are aligned with the compliant (c-)axes of muscovite, AP and As values initially diminish as ϕMs increases only to rise again at a specific ϕMs. The initial anisotropy introduced by the quartz alignment is progressively overwhelmed by the more anisotropic muscovite, which ultimately dominates the bulk anisotropy.
- 4
The normalized VP(45°) value, νP45, is not strongly affected by quartz orientation for moderate and high muscovite modal fractions. Increasing α generally increases νP45for 0.33 < ϕM < 0.9. In addition, certain combinations of muscovite modal fraction, standard deviation of muscovite grain orientation, and quartz grain orientations can give rise to very high νP45 values.
Acknowledgments
This work was supported by the U.S. National Science Foundation through grants DMI-0423485, EAR-0911150 and EAR-1015349. In addition, the support provided by the University of Maine to FMJNT through a Provost Fellowship and to AJG through a MEIF Dissertation Fellowship is also gratefully acknowledged. We thank an anonymous reviewer and David Okaya for constructive comments that helped us improve the manuscript.
Appendix
Appendix: Details of the AEH Method
The AEH method simultaneously considers two distinct scales, namely the characteristic length L of the large-scale structure of interest and the width ℓ of the sample. The two length scales are related by a scaling parameter ɛ which is defined as the ratio of the width of the sample to the characteristic dimension of the large-scale structure, that is, ɛ=ℓ/L. The AEH method assumes a clear separation between the two scales, that is, ɛ≪ 1. In addition, the microstructure is assumed to be periodic and a microscopic coordinate y is used to identify points within the microscale sample. In this work, L is of the order of several metres to hundreds of metres and the sample size l is of the order of millimetres. The corresponding ratio ɛ is of the order 10−3 to 10−5 which is in keeping with the assumption of the AEH method.
 represent the average macroscale displacements and
  represent the microscale displacement fluctuations which are proportional to the scaling parameter ɛ.
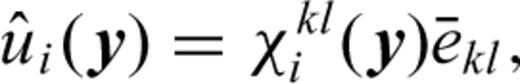
 to the three microscale displacement fluctuations at a point in the sample. Summation is implied over the repeated indices k and l in (A2). The 18 characteristic functionsχkli (y) =χlki (y) are continuous functions of the sample coordinates y due to the assumed continuity of displacements across grain boundaries. The strains at a point within the sample are related to the average macroscopic strains via the characteristic functions as
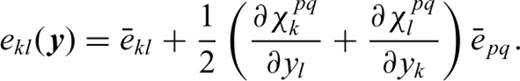

References
Author notes
Now at: Advanced Structures and Composites Center,University of Maine, Orono, ME 04469, USA.
