


Summary
Off northwest Libya the Cyrenaica foreland basin domain and its Pan-African continental crust, which constitute the African promontory, are overthrusted by the Mediterranean Ridge Complex. The thrust belt contact and its seismic stratigraphy have been analysed using pre-stack depth-migrated multichannel seismic (MCS) lines recorded during the MEDISIS survey (2002). The geometry and sedimentary distribution analysis through the wedge-top depocentres allow reconstruction of schematic cross-sections of the tectono-sedimentary wedge that includes two major thrust sequences separated by an apparently poorly deformed transition zone. Based on time–space variation of several piggyback basins, we propose that these thrust sequences relate to distinct phases of shortening. (1) A first event, which probably occurred just prior to the Messinian crisis in latest Miocene (Tortonian times?) and (2) A second event, that has finally led to the present-day overthrusting of the Mediterranean Ridge over the Libyan continental slope.
1 Introduction
Extending off Libya, the north Cyrenaica foreland basin (Fig. 1) results from a diachronous geological evolution including a passive margin stage and its subsequent tectonic inversion (and uplift), which originated from a still ongoing convergence between the African and Eurasian plates. According to DeCelles & Giles (1996) this area, extending along the southern Neo-Tethys border, can be regarded as part of a foreland-type basin which includes (1) a foredeep depositional system, the present-day Dernah-Tubruq and Benghazi basins and (2) a wedge-top depozone, the Mediterranean Ridge (Fig. 1).
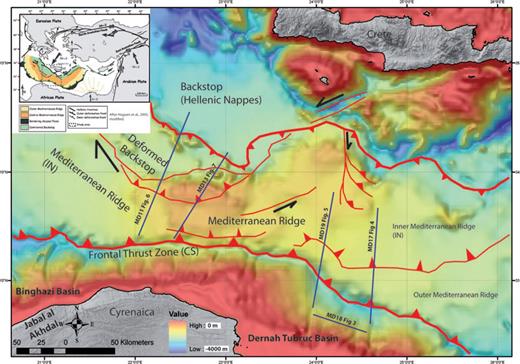
Main morphostructural elements of the studied area, including the Cyrenaica foreland basin and the bordering Mediterranean Ridge (modified from Chamot-Rooke et al. 2005) are shown on a shaded bathymetric map (from Gebco, 2003). Location of MCS lines MD11, 13, 17, 18 and 19, illustrated and discussed in this paper, are indicated in blue lines. In red, main thrust zones (frontal thrust and back thrust of the Mediterranean Ridge) and main strike-slip fault zones across the Mediterranean Ridge and its backstop. In upper left corner: plates, main kinematic, tectonic elements and location of the study area (after Huguen et al. 2005).
Up to now the foredeep region remains still poorly studied and it therefore remains difficult to properly locate, through the foreland basin, the seaward extension of the passive African continental margin. While considered for a long time as enigmatic, the geology of the Central Mediterranean Ridge has recently been clarified through the use of detailed swath bathymetric data (Huguen & Mascle 2005; Huguen et al. 2005), various academic seismic reflection data (Cita et al. 1989; Camerlenghi et al. 1992, 1995; De Voogd et al. 1992; Zitter 2004; Chamot-Rooke et al. 2005) including several multichannel seismic (MCS) lines (Finetti 1982; Chaumillon 1995; Kopf et al. 1998; Mascle & Chaumillon 1998; Costa et al. 2004) and ODP leg 160 drilling results (Emeis et al. 1996). Some of these studies have shown that the wedge complex includes stratigraphic mélanges made of Mesozoic to Plio-Quaternary sediments (Finetti 1982; Ahlbrandt 2001) emplaced on the subducting African basement. According to Huguen & Mascle (2005), the wedge can be divided into three different morphostructural provinces: (1) a southern front overthrusting the passive African continental margin, (2) a central, rather flat, domain and (3) a northern province in backthrust contact to the North with the Hellenic active margin. Whether this morphologic feature expresses only relatively shallow thrusted sequences within the wedge-top depozone, or deeply rooted structures of the subducting African crust, remains an open debate.
The few available geophysical data have always faced difficulties providing reliable images of the deep structure of the wedge-top depozone, mainly due to the presence, in the shallow section of the wedge, of thick Messinian salt deposits (Hsü. 1973; Finetti 1982; Mascle & Chaumillon 1998), and to its overall and intense tectonic deformation. In this study we have applied pre-stack depth migration (PSDM) techniques on five regional MCS lines to tentatively obtain better depth images of the geological structures and of the structural relationships of this accreted wedge with its foredeep domain, the passive Libyan continental margin.
Bosworth et al. (2008) proposed that a ‘strain shadow’ (see their Fig. 1) affects the shore area just south and southeast of Cyrenaica where only little shortening is evidenced. However, we can wonder whether some deformation may occur on the opposite side of the ‘strain shadow’ zone (offshore Cyrenaica), which has not been explored and evidenced so far. In this case, how this shortening is expressed and what its timing is are questions we are tentatively trying to answer.
2 Regional Geodynamic Setting
According to Janssen et al. (1995), the Apulian domain was, until Jurassic times, part of the African Plate, and was then bounded to the North by the Early Triassic Tethyan Ocean (Makhlouf 2006). Palaeogeographic reconstructions of the Tethyan-Mediterranean domain which extended from Northern Libya to Southern Aegean sea (e.g. Guiraud & Bosworth 1999; Stampfli & Borel 2000) show that the onset of the closure of the Tethyan oceanic space, generated by a left-lateral translation of the East Saharian domain with respect to the Hellenides-Rhodopes superterranes, probably initiated in Barremian times (Dercourt et al. 1986; Janssen et al. 1995). The northward drift of Africa relative to Europe, emphasized by the opening of the South and Equatorial Atlantic Oceans (Craig et al. 2008), led to (1) the collision, and subsequent suture, of different cratonic blocks across the remnants of the Tethys ocean, (2) the rifting of Apulia away from Africa (Janssen et al. 1995) and finally (3) the opening of the Mesogean Sea (Dercourt et al. 1986; Ricou et al. 1986; Le Pichon et al. 1988; Ziegler 1988). Geophysical and field data indicate that the late Mesozoic rifting phase of the North Africa basement (Guiraud & Bosworth 1999) was accompanied by a series of aborted rifts south of the actual continental margin (Tawadros 2001; Craig et al. 2008). A late Cretaceous regional high subsidence rate, possibly associated with the Sirte collapse (Rusk 2001; Carr 2003), is effectively recognized in the Atlas mountains (Zouaghi 2005) and in Libya's Kufrah, Murzuq, Ghadami and Tripolitania basins. Through Cenozoic times, the progressive shortening between the African continental margin (Cyrenaica) and the Hellenic arc (Kempler & Garfunkel 1994; Rosenbaum et al. 2002) has led to the creation of a tectono-sedimentary wedge, the Mediterranean Ridge complex (Fig. 1; McKenzie 1970), and even to some tectonic inversion of the Cyrenaica shore basins (Röhlich 1980; El Hawat & Abdulsamad, 2004). According to Bosworth et al. (2008), the stratigraphy of the Tubruq offshore basin includes Palaeozoic silico-clastic sediments, unconformably overlain by Triassic to Early-Cretaceous pre-inversion package, topped by foreland sequences, including Late Cretaceous to Eocene and Oligocene to Holocene sediments (Table 1). Seismic reflection profiles shown in this paper provide images of this thick sedimentary section within both the foredeep system and the wedge-top area.
![Synthetic stratigraphy of Mesozoic sequences (modified from Carr (2003)). NA, The Mesozoic succession of North Africa is divided into two sequences (NA 6, Early Triassic to Middle Cretaceous; and NA 7, Middle to Late Cretaceous); LST, lowstand systems tract; TST, transgressive systems tract; HST, highstand systems tract; MFS, maximum flooding surface; SB, sequence boundary; AP, second-order sequence stratigraphic framework for the Arabian Plate [Sequence AP 6 (Late Permian to Toarcian); Sequence AP 7 (Toarcian to Tithonian); Sequence AP 8 (Tithonian to Turonian); and Sequence AP 9 (Turonian to Palaeocene)].](https://oup.silverchair-cdn.com/oup/backfile/Content_public/Journal/gji/185/1/10.1111/j.1365-246X.2011.04928.x/2/m_185-1-65-tbl001.jpeg?Expires=1749824306&Signature=HWNdjQ2Fgiy7xPyjORZYftYGbV9TDT4hAeKFvwdFYZFPZ8uapNaPh3Cy4EJyWGTCn2vaBfTt3P-Abmpjrg~70dYrwf59PHbFBGcPTWvUKVflRCIwiguC3QattmRVcC9HAwP~veRgUHRoqzRzQtBoZq~82Yi-pjpa-w-AJns82XcpXMtNfxENeDAZe1yPZq4AJ3XQaxgrkr9-tQ1Sj3DhgE90tOjE9IYMvxTEGPPoPruGs~yna1Yc4DvSBVKmYNx0Mc0-VgQ0Qm9pLXpKInawcm1LLQI~8jVudO0GCddJSbj~jPFGz0mmSkW3-xgNlYng5Xt~HhWAwGFB1sT3GZVv2A__&Key-Pair-Id=APKAIE5G5CRDK6RD3PGA)
Synthetic stratigraphy of Mesozoic sequences (modified from Carr (2003)). NA, The Mesozoic succession of North Africa is divided into two sequences (NA 6, Early Triassic to Middle Cretaceous; and NA 7, Middle to Late Cretaceous); LST, lowstand systems tract; TST, transgressive systems tract; HST, highstand systems tract; MFS, maximum flooding surface; SB, sequence boundary; AP, second-order sequence stratigraphic framework for the Arabian Plate [Sequence AP 6 (Late Permian to Toarcian); Sequence AP 7 (Toarcian to Tithonian); Sequence AP 8 (Tithonian to Turonian); and Sequence AP 9 (Turonian to Palaeocene)].
3 Data Processing
During the MEDISIS survey (run in 2002) several MCS profiles were recorded across the Libya foreland basin to tentatively image, beneath the Mediterranean Ridge, the northward extension of this segment of the Mesozoic African passive margin and to evaluate the structure and nature of the sedimentary cover of both domains. These lines were recorded using a 4515 cubic inches air gun array, with shot spacing of 75 m, and a 360 channel, 4.5-km-long streamer; the source and receivers configuration resulted in a 30 common depth point (CDP) fold coverage. Before performing a pre-stack depth migration, a more conventional seismic processing sequence was carried out using Geovector software to improve the data signal-to-noise ratio. This sequence included minimum phase signal conversion, predictive deconvolution, Butterworth filtering (3–6 and 65–75 Hz), F–K antimultiple attenuation and normal moveout correction. Amplitudes of the data were preserved as much as possible. The velocity analysis was performed by both semblance panel techniques and variant stack corrections at every 100 or 200 CDP, depending on the length of each line and of the structural complexity of the area. After conversion into interval velocities, using Dix equations, the inferred velocity model was interpolated and subsequently smoothed for dynamic ray tracing (Lambaré. 1992) and for better estimate of traveltime, amplitude and ray-related parameters. PSDM (Rai–Born inversion tomography) was then applied on data sorted in shotpoint gathers. During the PSDM process (Thierry et al. 1999), common image gathers (CIG) and semblance panels are stored for each kilometre. These CIG were used for quality control of the final migrated image and to further refine the PSDM accuracy by iterative velocity analysis in the depth domain. The redundant image of reflectors for each offset, or diffraction angle in the CIG, must be flat and at the same depth position to guarantee optimal processing of the final section (Fig. 2). To improve the accuracy of the PSDM method used to migrate the MEDISIS data, we have performed two iterative migration-velocity analyses for each line shown and discussed in this paper.
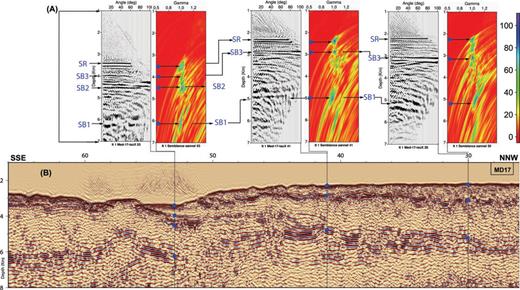
Examples of quality and accuracy controls of depth-migrated seismic line. (A): Common image gathers (in grey and white); iso-X-panels (in colour) show maximum coherence (green–blue), around one for the main reflectors on semblance panels; blue dots and arrows indicate the locations of main seismic discontinuities; SR, seabed reflector; SB, sequences boundaries (1, 2 and 3). (B): Example of pre-stack depth-migrated line MD17, from the Libyan continental slope to the Mediterranean Ridge.
4 The Different Seismic Sequences
4.1 Seismic sequences
Analysis of seismic sections obtained after PSDM processing has allowed us to distinguish through the study area three major seismic sequences respectively labeled A, B and C in Figs 4–8. These sequences correlate with a well-stratified sedimentary cover whose thickness varies between 2500 and 5000 m along the foredeep basin and may reach 6000 m in the distal domain of the wedge-top depozone.
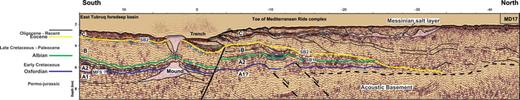
Seismic stratigraphy and structural style at the contact between the Mediterranean Ridge complex and the Tubruq foredeep sequences from PSDM line MD17. A, B and C indicate the different seismic sequences as indicated in the text. MFS: maximum flooding surface; SB1 and SB2: sequence boundaries. Blue arrows underline terminations against sequence boundaries. Bold line: thrust or extensional faults; regular lines: boundaries of main seismic reflectors.
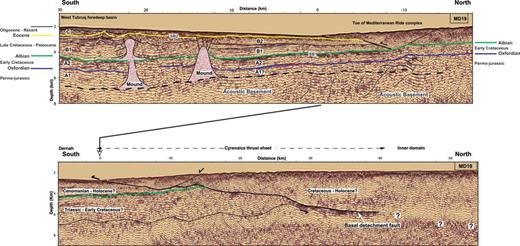
Seismic stratigraphy and structural patterns of the Tubruq foredeep basin/Cyrenaica thrust sheets and seaward extension of the foredeep sequence from PSDM image MD19. A, B and C indicate the different seismic sequences as indicated in the text, SB1 and SB2: sequence boundaries.
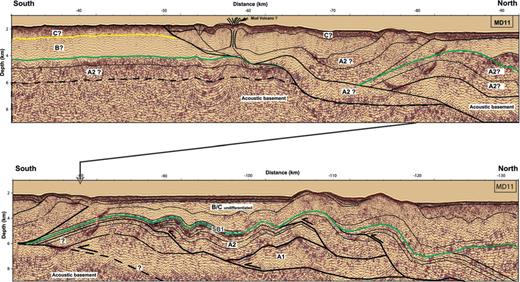
Seismic sequences and structural style of the inner Mediterranean complex as illustrated on PSDM line MD11. A, B and C indicate seismic sequences. Bold lines: thrust systems; regular lines: boundaries of main seismic reflectors.
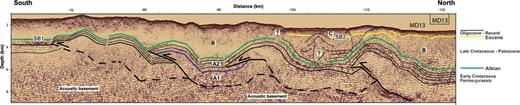
Seismic sequences and structural patterns of Neo-Tethys Duplex, as interpreted from PSDM lines MD13. Black bold lines: thrust or detachment level; regular lines: boundaries of main seismic reflectors. SB1 and SB2: sequences boundaries. A, B and C: seismic sequences.
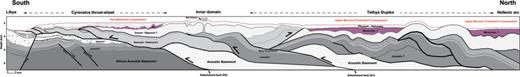
Schematic North–South regional cross-section across the Cyrenaica wedge-top depozone illustrating its main structural characteristics.
The strategy used to define these reflection packages is based on (1) their seismic stratigraphy, (2) some sequential stratigraphy analysis, as defined by Vail et al. (1977) and Van Wagoner et al. (1988); this technique recommends interpreting the depositional sequences on seismic sections by identifying discontinuities at the base of reflection terminations and (3) stratigraphy as derived from onshore observations and drilling (Duronio et al. 1991), and regional geological synthesis (Carr 2003; Bosworth et al. 2008). Based on these various approaches, three major bounding discontinuities were recognized: (1) a probable maximum flooding surface (MFS) lies between A1 and A2 seismic facies units; (2) a sequence boundary (SB1), which truncates the depositional sequence A2 and (3) a second sequence boundary (SB2) capping seismic sequence B. In the following section, seismic sequences are described from the oldest to the youngest one, and from the foredeep towards the distal wedge-top depozone area to facilitate stratigraphic correlation.
4.1.1 Seismic sequence A
This sequence represents the deepest observed seismic unit. Its base is not clearly imaged through the seismic data. However, a banded package of high amplitude seismic reflectors, seen at the base of a structural high on line MD18 (Fig. 3), possibly delineates sequence A basement. A can be divided into two distinct seismic facies units (A1, A2) with different characters, separated by a probable MFS. The lower interval (A1) is made of discontinuous parallel, fair and high amplitude seismic reflections, sometimes affected by extensional faulting (Fig. 4; line MD17). In addition, this unit displays local mound-shaped strata (shale? salt?) and lenses of chaotic reflection bodies (Figs 4 and 5) possibly indicating channel fills (Mitchum 1977).
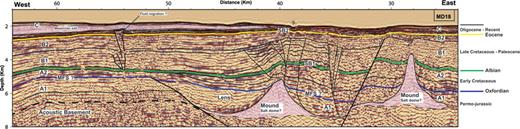
Seismic stratigraphy and internal structure of the Tubruq foredeep basin from PSDM line MD18. A, B and C indicate the different seismic sequences as indicated in the text. MFS, maximum flooding surface; SB1 and SB2, sequence boundaries.
Towards the distal foreland, A1 presents staircase structures associated with low angle northward dipping oblique faults (Fig. 4). Through the Benghazi wedge-top inner domain (Fig. 6; line MD11) the A1 seismic expression is less obvious. The poor quality of seismic information in this area may be due to fluid circulation along in-sequence thrust and released on the seafloor as mud volcanoes. Further north, a banded reflection package, similar to the one observed in the Tubruq foredeep basin, is found between 3.5 and 8.2 km depth on lines MD11 and MD13 (Figs 6 and 7). According to Bally (1987), sedimentary lenses are common in prograding facies units and in near deltaic environments. We thus interpret A1 as a probable parasequence set including a late low stands system tract and sediments deposited from the onset of sea level rise until the time of maximum transgression on the coast. Additional supports for such interpretation are the presence of potential failing stage salt deposits through the sequence and the presence of an overlying MFS (Fig. 3).
An upper sequence, A2, highlights aggrading (Fig. 3) and prograding (Fig. 4) seismic reflections with a bank-like external geometry. This package is characterized by more continuous, parallel and high amplitude seismic reflections (Fig. 3). Local disruptions of the A2 seismic facies unit, together with dispersed reflections, are observed in the area of deformation (i.e. high angle normal fault) or in dome-like rising features above the general level of surrounding strata, or in areas of potential fluid migration (Figs 3 and 4). Following Wilson (1975), the A2 layer-cake high amplitude reflectors (Fig. 4) can be interpreted as an aggrading shelf edge complex that builds out in deep water during sea level high stand (Vail et al. 1977; Sarg et al. 1999).
Among this high-stand systems tract (Vail 1987; Posamentier et al. 1988; Posamentier & Allen 1999), the eroded unconformity (SB1) displays a linear shaped seismic reflection pattern that extends north of the Cyrenaica foredeep basins and may define a major global sea level fall after the deposition of A2 sequence facies units.
4.1.2 Seismic sequence B
This seismic sequence shows a base-concordant relation with SB1 sequence boundary along the shelf edge (Fig. 3), and downdip succession of its lower strata against MFS in a basin-ward direction (Fig. 4). These bounding patterns suggest a parasequence set with bank-like external geometry (Kendall et al. 2003).
B is widespread on the study area and characterized by two different types of seismic reflections. A first group is seen along the present-day shelf edge and shows stratification patterns with good continuity, exhibiting high amplitude locally interrupted by discontinuous low amplitudes. A second type, observed in the deep water basin and through the wedge-top depozone, includes chaotic and blank massive shape sequences with intermittent internal reflections. This deep-water seismic facies unit displays strong variations in thickness associated with post-deposition deep normal fault reactivation and piggyback-basin development (Fig. 4).
Following Fontaine & Cussey (1987), the updip B made of parallel and high frequency reflections may indicate pelagic carbonates accumulation during the transgressive stage. We therefore interpret the B sequence as a potential carbonate parasequence (Van Wagoner et al. 1988; changing in the basin-ward direction to downslope mass flows) and dolomitic limestone associated with a post-deposition basin restriction. According to Deelman (1999) and Sarg (2002), tectonic settings prone to hydrographic restriction (such as foreland basin) provide favourable conditions for carbonate to evaporite transition during sea level low stands. A large-scale shelf unconformity surface (SB2), seen at the top of B seismic sequence, attests for a post-date sea level drawdown associated with uplift and thrusting (Fig. 4). This combined tectonic–eustatic event probably accommodated restricted conditions leading to B potential carbonate dolomitization. Our hypothesis is supported by the presence of diapiric-type structures observed within B in the distal foreland region (Fig. 7).
4.1.3 Seismic sequence C
C lies between the regional SB2 seismic sequence boundary and the seafloor everywhere in the foreland basin. Its internal pattern is also characterized by two seismic facies units: C1 and C2. A lower package (C1), well developed in the Tubruq foredeep depozone, shows subparallel and high amplitude banded reflections (Figs 3 and 4). An upper package (C2) is characterized by transparent weak seismic reflection. Both units form a stratigraphic melange with fill configuration in the toe of the Tubruq accretionary complex (Fig. 4) and linear shape along the distal part of the wedge-top depozone (Figs 6 and 7). This stratigraphic melange is characterized by interbedded, fine and high frequency continuous seismic reflections with which some weak transparent facies can be recognized. In addition, it exhibits evidence of active salt welts, created by salt flowage in the lowermost part of the sequence (Fig. 4).
In summary, the distribution patterns and internal reflections of C seismic sequence lead to interpret a shelf margin wedge (Homewood et al. 2002) including forced regressive salt deposits (likely Messinian) developed during stepped sea level falls.
4.2 Tentative correlation with the regional chronostratigraphy
An integrated approach, based on seismic stratigraphy analysis and previous geological synthesis (Duronio et al. 1991; Carr 2003; Bosworth et al. 2008), leads us to document three mega sequences within the Cyrenaica foreland depozone. (1) A lowermost one overlies an irregular acoustic basement expressed by series of tilted blocks along the shelf edge (Figs 3 and 4) and thick-skinned thrusting within the distal foreland; (2) an intermediate sequence is widespread and displays syn and post-deposition tectonic features along the wedge-top depozone and (3) a last depositional sequence reflects tectonic reactivation of foredeep extensional faults coeval with piggyback-basin development.
The sedimentary sequences deduced from the acoustic facies analysis are related to two parasequences (low stands and lower transgressive system tract) A1, topped by a high stand system tract (A2) and an upper transgressive system tract (B) overlain by a shelf margin wedge (C). Along the Eastern Mediterranean domain, as well as in Libyan shore basins, comparable seismic sequences and lithofacies interpretation have been proposed by several authors (Finetti 1982; Biju-Duval et al. 1987; Duronio et al. 1991; Shegewi 1992; Chaumillon 1995; Emeis et al. 1996; Gumati et al. 1996; Mascle & Chaumillon 1998; Ahlbrandt 2001; Rusk 2001; Tay et al. 2002; Carr 2003; El Hawat & Abdulsamad 2004; Bosworth et al. 2008). The regional history stemming from these studies includes Triassic-to-Early-Cretaceous crustal extension, followed by uplift and folding during Eocene–Oligocene times (Gumati & Nairn 1991). According to Gumati et al. (1996) and Bosworth et al. (2008), the stratigraphic succession of the Cyrenaica platform includes a Palaeozoic basement unconformably overlain by Triassic to Cretaceous sediments. Carr (2003) divided the Mesozoic succession across North Africa (including Sirte and Cyrenaica) into two sequences: (1) an Early Triassic to middle Cretaceous sequence, unconformably overlain by (2) a middle to late Cretaceous sedimentary cover. Despite a lack of control by well data, a comparison of its second-order sequences stratigraphy framework (Table 1) with our interpretation lead us to respectively correlate MFS to the Oxfordian maximum transgression, A2 to the Late Jurassic Early Cretaceous and SB1 to the top of the Albian unconformity. From this attempt, B can be assigned to the Cenomanian–Eocene sequence (Bosworth et al. 2008), SB2 to the top of an Eocene unconformity (Ceriani et al. 2002) and C to an Oligocene–Holocene sequence (Ahlbrandt 2001; Bosworth et al. 2008).
5 Tectonic Features of the Cyrenaica Wedge-Top
Interpretation of MD11, 13, 17 and 19 lines tends to indicate that several phases of tectonic activity have affected the Cyrenaica basement; they include the formation of NE–SW trending grabens during Triassic to Early Cretaceous (Fig. 3) and the development of regional highs and lows associated with Eocene–Holocene thrusting (Fig. 4). In the following section, we will focus on the structural analysis of the wedge-top depozone to tentatively reconstruct the post-rift deformation of the Cyrenaica foreland basin. As can be seen in Fig. 1, the Central Mediterranean Ridge complex includes two distinct mega thrust sequences; the two sequences are separated by an area characterized by thick-slip sliding structures (Fig. 4), and a high velocity (6.2 km s−1) according to PSDM iterative velocity analysis. We have named the northern thrust wedge, Neo-Tethyan-Duplex and the frontal prism, Cyrenaica thrust-sheet.
5.1 Neo-Tethyan Duplex
MCS sections MD18, 17, 19, 11 and 13 (Figs 3–7, respectively) indicate that the Neo-Tethyan Duplex extends between 70 and 130 km away from the base of the Cyrenaica continental slope (Fig. 1). These lines show that the Neo-Tethyan Duplex may include several ramps potentially at a crustal scale (Figs 6 and 7). According to the hypothesis of Bosworth et al. (2008) and Carr (2003), folds and thrusting in this area may involve sediments up to Jurassic to middle Cretaceous. Moreover, when considering the seismic features and thickness variations, as illustrated on lines MD11 and MD13, the Neo-Tethyan Duplex seems to be characterized by hinterland-direct shortening migration attesting probable back stepping of wedge accretion. This observation leads us to interpret a wedge over a critical profile (Dahlen et al. 1984; Muños et al. 1985; Zoetemeijer et al. 1992). This hypothesis is supported by the northward passive duplex (roof backthrust) that marked the structural front of the Neo-Tethyan Duplex. The flat bedding unconformity of likely Early Pliocene age, that caps the top of the Miocene fan shape sequence, leads to believe that the basal detachment (D1) of the Neo-Tethyan Duplex reached its critical dip position at that time, or just prior to the onset of Cyrenaica thrust-sheet accretion.
5.2 Cyrenaica thrust-sheet
Structural analysis of seismic profiles MD17 and MD19 shows that the Cyrenaica thrust-sheet spreads over nearly 40 km (Fig. 5) above late Cretaceous and Tertiary fore deep sequence, directly above the passive African continental margin. Unlike the Neo-Tethyan Duplex, the Cyrenaica thrust-sheet displays typical thin-skinned thrust system (Fig. 4) that may involve Upper Cretaceous to Holocene sedimentary units. This package is detached from its Jurassic to Early Cretaceous sole (the sedimentary cover of the African margin) along fault plane (D2) with ramp-flat-geometry. Its hinterland zone is characterized by tectonic denudation of foredeep sequence where exhumation of deep-seated rocks was accomplished by ramp-decollement geometry. The presence of a wide and thick Messinian piggyback basin behind the passive duplex indicates that the onset of Cyrenaica thrust-sheet accretion is most likely coeval with the latest Miocene deformation and uplift.
6 Discussion and Conclusions
6.1 The Cyrenaica margin
Tentative chronostratigraphic correlation tends to indicate that our interpretation is, in general, in good agreement with usually proposed Mesozoic evolution of the southern Tethyan margin. According to the MCS data interpretation the sedimentary pile of this margin segment may include Triassic salt, and evaporite accumulated during the Messinian crisis. Up to now no evidence of evaporite older than the Messinian ones has been reported offshore Eastern Libya; in western Libya however, salt deposits (Late Triassic to Middle Jurassic in age) constitute one of the major hydrocarbon plays within the Pelagian domain (Sabratah subbasin in Libya, Ashtart subbasin in Tunisia), where they generated domes-like structures that later affected both sedimentation and oil entrapment (Bosworth, 2009, personal communication). The lack of published well data needed to calibrate our seismic data makes uncertain the Triassic age we have tentatively attributed to deep diapirs-like and folded features observed beneath the Tubruq shelf basin (Fig. 3). Our hypothesis is however supported by several lines of reasoning. First, the mother layers of the postulated salt features, which can be seen in the deepest part of the cross-section, do not appear affected by superficial compression and do not show any structural relationship with identified Messinian sequences. Secondly, the North Tubruq Triassic salt basin shows some NE–SW sag similar to the early Mesozoic evaporite through known in the central Atlas of Tunisia (Bédir et al. 2001; Zouaghi et al. 2005). Finally, assuming an early stage, in late Palaeozoic, for the opening of the Tethyan ocean (Sengör 1979; Stampfli et al. 2004; Garfunkel 2004), it may not be surprising to observe salt deposits in confined depressions, as is usually the case during early rifting phases.
On our seismic lines we have tentatively recognized within the post-Jurassic cover of the eastern Libyan margin two main regional unconformities: a first one on top of the Albian, and a second on top of the Eocene. These unconformities and their erosional surfaces (see Figs 3 and 4) indicate that along the Tubruq region foredeep the depocentres shifted from south to north prior to Tertiary times and maybe before a Santonian event (Guiraud et al. 2005) indicating a tectonic inversion of the Neotethyan basins. Such a scenario is supported by a continuous uplift and erosion time and shift during Campanian and Maastricthian of the southern Neo-Tethyan margin, which is supported by the deposition of thick Palaeocene pile directly overlying late Jurassic strata (Fig. 3). This observation is in good agreement with the hypothesis of Bosworth et al. (2008), which indicates a global change in the kinematic of the North African terrains in Santonian times. The sedimentary distribution and observed tectonic features indicate that the Cyrenaica foreland basin can be divided into domains: (1) the Dernah-Tubruq basin and (2) Benghazi (Jabal al Akhdar) foredeep, separated by a master, NNE–SSW trending, strike-slip fault zone (Fig. 1).
6.2 The northern bordering Mediterranean Ridge
From the tentative reconstructed cross-section shown in Fig. 8 we may distinguish two different thrusted sequences: (1) a northern one, or Neo-Tethyan Duplex, characterized by ramp anticlines and (2) a southern one, or Cyrenaica thrust sheets, overthrusting the foredeep sequences. The identification of Messinian salt sequences, the discrimination between regional seismic sequence boundaries and the architectures of both thrust domains allow us to identify two main and successive phases of shortening, respectively during late Miocene time (possibly the Tortonian event of Guiraud et al. (2005)) and just after the Messinian time. Our results are somewhat consistent with what is known from the evolution of the Southern Apennines (Ori & Friend 1984; Bonini et al. 1998; Piedilato & Prosser 2005) and of southwestern Turkey margin (Alçiçek & Veen 2008) where comparable events have been described, including a relative out-of-sequence thrusting during the Miocene (post-Aquitanian). This seems to support the occurrence of a regional shortening event sometimes during upper Miocene (Tortonian?) times affecting most of the Eastern Mediterranean domain. An important issue concerns the interpretation of the inner domain of the Mediterranean ridge (Figs 3–7 and 8); due to its relatively elevated position with respect to the southern thrust-sheet, we suspect that this thick-slip sliding domain correlates with a faulted acoustic basement bulge. Accordingly, the specific acoustic response of the overlying sediments may result from fluid circulations along in-sequence thrusts or along normal faults reactivated by compression events. If correct, this would indicate that mud expulsion and gas chimneys observed through the inner part of Mediterranean ridge Complex are controlled by deep-seated tectonic features such as thrusts or reverse faults as already proposed by Huguen et al. (2001, 2005).
Besides their scientific impact, the results presented in this paper may also provide interesting issues for petroleum exploration along the Cyrenaica foreland basin. Further investigations, involving wide-angle seismic data, should be undertaken especially within the central domain of the Mediterranean ridge to improve our knowledge of its internal structure and lithology.
Acknowledgments
This work is part of the L. Mbida Yem’ Ph.D., supported by a grant from Institut de Recherche pour le Developpement (IRD). The authors gratefully acknowledge the chief scientist and staff onboard the N/O NADIR during the Medisis cruise. We express our thanks to P. Thierry, G. Lambaré and S. Operto, who developed the preserved amplitude pre-stack depth migration software used for this study; special thanks to G. Lambaré for providing his dynamic ray tracing code. The first author is also grateful to F. Sage-Khadir for her assistance during pre-processing of seismic data on Geovector, and to E. Lopez for stimulating discussions. We are grateful to Ben Yates for his proofreading and English comments.
References
