


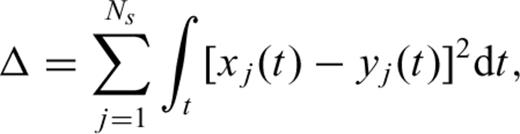
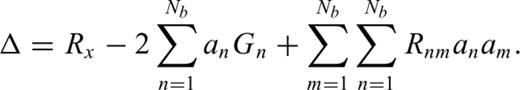
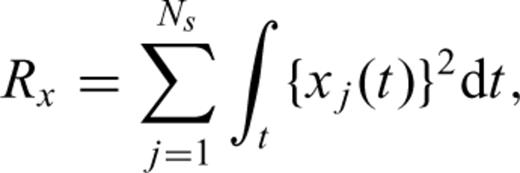
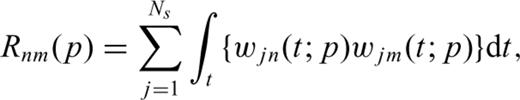
Summary
The Koyna–Warna region in western India is the best example of reservoir triggered seismicity. The world's largest triggered earthquake of magnitude 6.3 occurred in Koyna in 1967, followed by several moderate to small earthquakes ever since. A digital seismograph network deployed for seismic monitoring during 2005 August to 2008 December has indicated a shift in concentration of seismicity towards south in the Warna region including a new zone of seismic activity to the southwest. During the observation period 13 earthquakes of magnitude 4 and greater have occurred of which 11 occurred near the Warna region while only two occurred in Koyna. In this study we modelled broad-band waveform data of six of these earthquakes near Warna using waveform inversion approach. Initially a new velocity model was determined using a joint hypocentral determination approach that simultaneously solves for the velocity structure as well as the hypocentral parameters. A trap thickness of 1.2 km with a P-wave velocity of 4.40 km s−1 and an upper crustal layer down to 10 km with a velocity of 5.96 km s−1 are obtained. The new model not only provides the minimum residual error for the traveltimes, but consistently provides the least mismatch error in the waveform inversion of all the events, performing better than any of the previously determined velocity models. In general, focal mechanisms of normal type with NS to NNW–SSE oriented fault planes are obtained for all these events that are correlated with probable faults inferred from satellite images and aeromagnetic anomalies. Focal depths in the range of 5–6 km are obtained for earthquakes in the Warna region based on the sensitivity of whole waveform inversion at local distances. It is felt that joint inversion of waveform data of several earthquakes with a wider spatial distribution, along with the velocity structure would help in precisely characterizing the faulting mechanism and seismogenic depth range for the Koyna–Warna region in future.
1 Introduction
The Koyna–Warna region lies in the Western Ghats, in the southwestern part of the Deccan volcanic province of the Indian subcontinent. It contains extensive volcanic basalts of the Deccan trap formation of the Palaeocene age, around 1- to 2-km thick (Gubin 1969) characterized by many fractures and tensional joints. The region is well known for seismic activity related to the reservoir trigger mechanism (Gupta et al. 1969; Gupta & Rastogi 1976; Talwani 1997a,b). The largest triggered earthquake of M 6.3 occurred here on 1967 December 10, (Gupta & Rastogi 1976; Chander & Kalpna 1997; Mandal et al. 1998) and over the years several thousand smaller earthquakes have occurred.
1.1 Seismic activity
The seismic activity in the Koyna–Warna region has been shallow (up to 10-km depth) and confined to a small area of 20 × 30 km2, with no other seismic source within a radius of 50 km. Continued seismic activity in the Koyna–Warna region has been observed following the impoundment of Shivajisagar lake behind the Koyna Dam in 1962 and subsequently after the impoundement of Warna reservoir in 1985. Since then intense seismic activity is found every year, mainly from August to December, subsequent to filling up of the reservoirs (Gupta et al. 1972a,b). The significant activity since 1967 includes 19 earthquakes of M≥ 5 including the largest earthquake of 1967 December 10, and over 170 earthquakes of M≥ 4 (Gupta 2002, 2007). Most of the M≥ 5 earthquakes have been confined to the Koyna region. Interestingly, in the recent times, much of the activity is found to be shifted to the Warna region, as indicated by data from a digital seismic network of 11 stations operated since 2005 (Fig. 1).
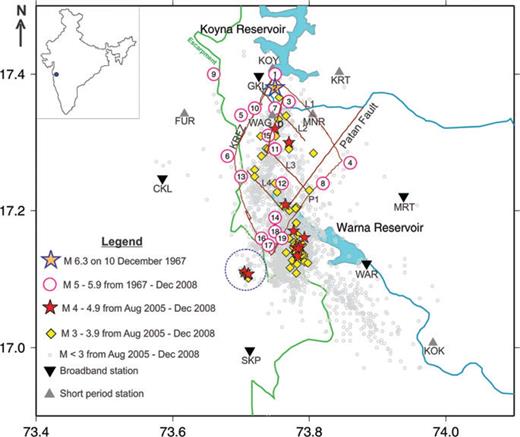
A map of the Koyna–Warna region in western India indicating the current and past seismicity along with the seismograph network used in this study. KRFZ, D and P1 represent the Koyna River Fault Zone, Donichiwada Fault and a NE–SW trending fault parallel to the Patan Fault, respectively. L1, L2, L3 and L4 are NW–SE trending fractures representing steep boundaries of crustal blocks (Fault geometry Talwani 1997b). The encircled region indicates the new seismic zone identified. Inset: Map of India indicating the study region.
1.2 Faults and lineaments
In the Koyna–Warna region, mapping of faults associated with seismicity has been a difficult task in view of the extensive presence of the Deccan trap exposures that are 500–600 m thick in the eastern region reaching a thickness of 1500 m in the west, 10 km east of the west coast (Kaila et al. 1981). Hence, most inferences of faults/lineaments have largely depended on indirect methods. Several faults and lineaments have been derived from LANDSAT images (Langston 1981), which give a general impression that the Western Ghats are the locus of a large zone of en-echelon faults parallel to the coast. Most faults strike in a NNW–NE azimuth range. There are also several faults and lineations near the dam with NNE trend, one of which may have caused the largest Koyna earthquake on 1967 December 10 (Langston 1981).
The major tectonic features of the Koyna–Warna region deduced from detailed field observation and interpretation of detailed aeromagnetic, geophysical and geological mapping of the area (Talwani 1997b) are the Koyna River Fault Zone (KRFZ) that bounds seismicity on the west. Slightly east of KRFZ is the NNE–SSW trending Donichiwada Fault (D) that dips 60°WNW. In the east is the NE–SW trending Patan Fault and another satellite parallel fault (P1) confining the seismicity. The area between KRFZ and Patan Fault is intersected by a number of NW–SE fractures extending to hypocentral depths, shown as L1, L2, L3 and L4 (Fig. 1). More recently interpretations of anomalies from residual total intensity aeromagnetic data (Agrawal et al. 2004) have indicated an important set of NNW trending faults close to the Warna Reservoir.
1.3 Focal mechanism solutions
Two main types of faulting mechanisms govern the Koyna–Warna region—strike-slip and normal. While most earthquakes in Warna have focal mechanism solutions of the normal type, the Koyna region seems to be controlled by the strike-slip mechanism, including the largest (M 6.3) earthquake of 1967 December 10 (Talwani 1997b). Several studies attempted to determine the fault plane solution of this earthquake as discussed in Talwani (1997b). In general, a left-lateral strike-slip faulting mechanism was inferred with the fault plane striking about N20°E with a steep northwesterly dip of 66–80°. Fault plane solutions were also obtained for foreshocks and aftershocks of the 1967 December 10 Koyna earthquake (Rao et al. 1975; Langston 1981; Langston & Franco-Spera 1985; Dziewonski et al. 1988). Based on the spatial distribution of about 300 events occurring between 1967 and 1973, Rastogi & Talwani (1980) identified three trends and obtained composite fault plane solutions for them. Two solutions suggested left-lateral strike-slip faulting while the third solution suggested normal faulting. Gupta et al. (1980) obtained composite fault plane solutions for eight earthquakes of Ms ≥ 4 during 1973–1976. Talwani (1997b) obtained fault plane solutions for eight events with magnitudes between 3.7 and 5.4 that occurred during 1993–1994. Seven of the eight earthquakes are located near Warna while the eighth one was the M 5.4 Koyna earthquake of 1994 February 1. Multiple solutions were obtained for some events due to lack of constraints.
1.4 Waveform inversion studies
While focal mechanism solutions using small number of first motion data generally have limitations of accuracy, waveform inversion approach with a few stations based on modelling of seismic waveforms can provide accurate results. However, not many such studies exist for the Koyna–Warna region. Langston (1976) obtained the focal mechanism for the 1967 December 10 Koyna earthquake using a generalized inversion technique applied to long period teleseismic P and SH waveforms. A large aftershock of mb 5.3 was also modelled using amplitude ratios of short-period teleseismic and near-regional long-period waveforms (Langston, 1985). Using regional broad-band data Rao (1999) first carried out waveform inversion for four Koyna–Warna earthquakes of magnitude 3.6–4.4 that occurred during 1997 April–1998 February and obtained normal faulting mechanism. Bhattacharya (2007) obtained moment tensor solutions for nine earthquakes of magnitude range Mw 3.5–5.0 in the Koyna region that occurred during 1997 April–2001 May using broad-band seismograms from observatories at Karad and Pune at distances of nearly 50 and 150 km, respectively. In general a normal faulting mechanism with strike-slip component was obtained for all these earthquakes.
1.5 Crustal velocity models
Previously several crustal velocity models were derived for the Koyna–Warna region (Fig. 2) based on earthquake data and controlled source seismology (Dube et al. 1973; Kaila et al. 1979; Gupta et al. 1980; Rastogi & Talwani 1980; Bhattacharya 1981; Langston 1981; Srivastava et al. 1984; Krishna et al. 1989; Krishna 2006). Some of the models may be considered regional since they used traveltime data at larger epicentral distances, while the local models are mostly based on controlled sources at shorter distances. Kaila et al. (1979) obtained their crustal model based on a deep seismic sounding survey along two profiles in the east–west direction in the Koyna region, one passing through the Koyna Dam and the second to the north of the dam. A deep-seated east dipping fault separating two crustal blocks on the west and east was inferred. The Moho depth in the eastern block was inferred around 39 km, which becomes shallow towards west. Srivastava et al. (1984) inferred their velocity model from explosion records at stations close to these profiles. The model of Rastogi & Talwani (1980) is a rather smoothened version of a previous model by Kaila et al. (1979), while Gupta et al. (1980) adopted a model that gave the best hypocentral locations for the Koyna earthquakes. Dube et al. (1973), however, obtained a crustal model from the signature of the Koyna earthquakes at stations distributed in the Deccan Trap and its immediate neighbourhood, which is similar to that of Bhattacharya (1981) based on surface wave dispersion studies. Using an inverse vertical seismic profiling approach with local earthquakes, Krishna (2006) inferred a six-layered model including low velocity layers.
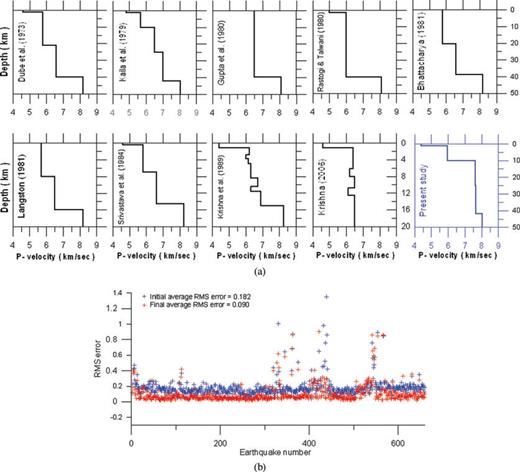
(a) Crustal P-wave velocity models for the Koyna–Warna region obtained by previous researchers as indicated alongside. The new velocity model obtained using the VELEST approach in this study is indicated in blue. (b) rms residual errors in locations of 658 earthquakes during 2005 August–2010 August in the Koyna–Warna region using the VELEST approach. Improvement of the residual errors over the model of Kaila et al. (1979) (blue) can be seen in the new model (red).
2 This Study
2.1 Data
A network of 11 digital seismograph stations (Fig. 1) has been operated by the National Geophysical Research Institute (NGRI) since 2005 in the Koyna–Warna region. This includes five broad-band and six short-period three-component seismometers with Guralp CMG-3-ESP (natural period 30 s) and L4–3D (natural period 1 s) sensors, respectively, while REFTEK data loggers were used. Data were sampled at a rate of 100 samples per second. While most stations were used for precise locations of the events, only three stations with a good signal-to-noise ratio were used for the waveform modelling study, aided by first motion polarity data from others.
2.2 Seismicity
Previously, it was observed that most of the moderate-sized earthquakes used to occur near the Koyna region. Among 19 earthquakes of M≥ 5.0 observed since 1967 the first 13 occurred north of latitude 17.2°N where as subsequent to 1980 September 20, the remaining events with just one exception, occurred near Warna to the south. During 1993–1995 an increase in seismicity followed the impoundement of Warna reservoir in 1985 (Rastogi et al. 1997). The recent seismic activity observed using a near real time network during 2005–2008 also shows a clear shift towards the Warna region. Out of 13 earthquakes of magnitude 4 and greater that occurred during the observation period (Table 1), 11 occurred near the Warna region whereas only two occurred in Koyna in 2008. In this study we report the development of a new seismic zone to the southwest of Warna reservoir with a prominent presence of three earthquakes of M≥ 4.0 during the observation period (Fig. 1).
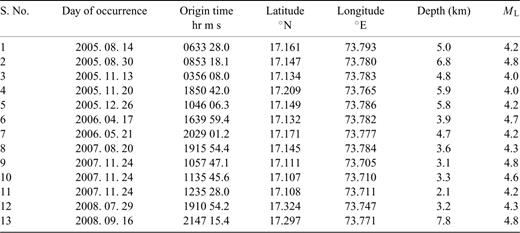
List of earthquakes of M ≥ 4.0 in theKoyna-Warna region recorded during 2005 August-2008 December by a network of digital seismic stations in this study.
2.3 Joint hypocentral determination
Joint modelling of hypocentral locations and velocity structure for the Koyna–Warna region using the VELEST program (Ellsworth 1977; Kissling 1988) has been carried out in this study. The program iteratively solves for the coupled hypocentre-velocity model problem for local earthquakes. The five-layered velocity model of Kaila et al. (1979) is used as the starting model. A data set of 658 earthquakes during 2005 August to 2010 August was selected using the best P- and S-wave arrival times based on a selection criteria of magnitudes greater than 1.6, five or more stations for each event and a station azimuthal coverage of more than 200°. The VELEST approach has provided an improved P-wave velocity model compared to the previous models.
2.4 Waveform inversion approach
Several methods exist for waveform inversion for earthquake source estimation. Zhao & Helmberger (1994) used a cut and paste (CAP) method that differentially weights the body waves and surface waves at regional distances while Zhu & Helmberger (1996) used amplitude differences in different phases like Pnl, surface waves, SH and SV to improve the stability and resolution of inversion. The individual portions of the waveforms are also differentially shifted in time while matching, to eliminate errors due to traveltimes of each phase. Dreger & Helmberger (1993) developed an inversion method for sparse network data at regional distances. However, the above methods are generally applicable for stations at regional distances.
The cut waveforms include the whole seismograms and are low-pass filtered at 0.5 Hz, resampled at 5 Hz and integrated to obtain the displacement seismograms. In view of this the P-wave onsets lose their prominence but the long period surface waves with larger amplitudes get enhanced. The observed and synthetic waveforms are then matched using the cross-correlation approach as above with the criterion of obtaining minimum mismatch error.
3 Results and Discussion
3.1 New crustal model
Joint inversion of earthquake data and the velocity structure using the VELEST program (version 3.1) has provided better constraints on the locations of the earthquakes and also refined the initial velocity model of Kaila et al. (1979). The new model is listed in Table 2 and plotted in Fig. 2(a) (blue) along with all the previous models (black). A distinct improvement can be seen in the traveltime residual error from 0.182 for the initial model to 0.09 for the final model (Fig. 2b). The new velocity model is characterized by a 1.2-km-thick trap with a P-wave velocity of 4.40 km s−1 underlain by an upper crustal layer down to 10 km with a velocity of 5.96 km s−1. The resolution of the lower crustal layers including the Moho is ambiguous since most of the earthquake hypocentres are confined to the upper crust.
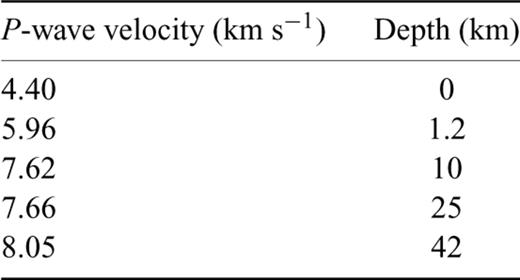
New P-wave velocity model for the Koyna-Warna region obtained using the VELEST approach.
3.2 Focal mechanism solutions
This study is perhaps the first attempt in obtaining focal mechanism solutions using waveform inversion of earthquake data at local distances in the Koyna–Warna region. Earlier waveform modelling was attempted by Rao (1999) and Bhattacharya (2007), although with sparse data from stations at regional distances. The focal mechanism solutions comprising strike, dip and rake parameters of both the nodal planes obtained for the six selected events are listed in Table 3 and plotted in Figs 3(a)–(d). The stations used in waveform modelling for each event, their epicentral distances and azimuths are listed in Table 4. The consistency of the obtained solutions is further confirmed by the superposed polarities of the first motion data from other stations not used in the waveform matching. The polarity data are in agreement with the compression and dilatation quadrants of the focal mechanism obtained from waveform matching with very few exceptions like SKP. In general, fault plane solutions with predominantly normal-type mechanism, typical of this region, are obtained for all these events. However, while in the southern cluster all the solutions indicate pure normal fault mechanism, similar to those reported in previous studies, the three events in the SW cluster indicate normal fault mechanism with a strike-slip component. The fault planes are generally oriented NS to NNW–SSE.
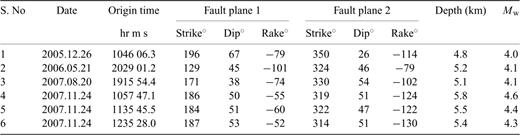
Fault plane solution parameters of selected events in the Warna region obtained using the waveform inversion approach in this study.


Waveform inversion results of four out of six events of M≥ 4.0 in the Warna region during 2005–2007, using the inversion approach of Kikuchi & Kanamori (1991). The waveform match between the observed (red) and synthetic (blue) filtered displacement seismograms is shown along with the source time function and focal mechanism obtained. Short-period stations with first motion polarities are also superposed on the mechanism. Red-filled triangles represent compressions while the white unfilled triangles are the dilatations. The numbers on the left above the seismograms represent the maximum displacement amplitudes of each trace (in mm) while those on the right indicate the weights used for the corresponding traces. (a) 2007 August 20 (b), 2007 November 24–A, (c) 2007 November 24–B and (d) 2007 November 24–C.
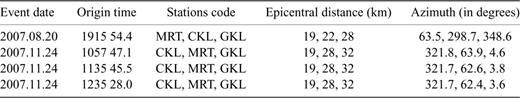
Epicentral distance and azimuths of earthquakes at stations used for waveform inversion in this study.
3.3 Resolution of focal depths
In this study we apply the waveform matching technique for accurate determination of focal depths. This is attributed to the presence of depth phases in the waveforms, which have a strong dependence on the focal depths as discussed by Langston (1987). A wide range of focal depths from 1 to 10 km has been tried for each event. Fig. 4 shows plots of normalized misfit error as a function of focal depth for each of the six events. Similar plots with the previous best model by Kaila et al. (1979) are superposed for comparison. It can be seen that the focal depth is a very sensitive parameter and can be clearly delineated based on the normalized misfit error function that varies by up to 50 per cent within 10 km. For the six events modelled in this study, the minimum focal depth obtained is 4.8 km and the maximum is 5.8 km. The discrepancies in focal depth estimates from the routine hypocentral estimates (Table 1) are seen as errors, possibly due to the smaller number of stations and to a lesser extent errors in phase picking.
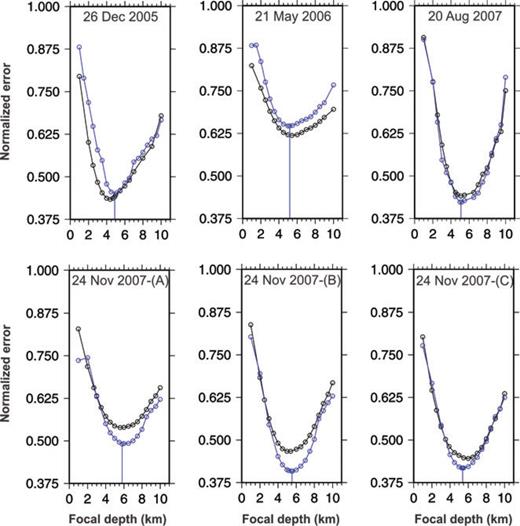
Variation of error in the waveform match as a function of focal depth varied from 1 to 10 km by using the velocity model obtained in this study (blue). The curves obtained using the model of Kaila et al. (1979) are also superposed for comparison (black).
To assess the accuracy of the estimated focal depths, a similar analysis was done using all the velocity models listed in Fig. 2. The plot of error variation with respect to each velocity model is shown in Fig. 5, for the events corresponding to Fig. 3. Even though the error levels pertaining to each model are different, the focal depth estimates inferred from the minima of each model curve for any event tend to be close and can be resolved within about ±1 km. This also indicates that the focal depth estimates are sensitive to changes in waveforms but not so sensitive to changes in velocity structure, especially when modelling in the low-frequency range. Also, for a given velocity model the variation in the focal mechanism solution itself with focal depth is quite low, except in the very shallow range, as seen in Fig. 6, indicating the robustness of the solutions obtained.

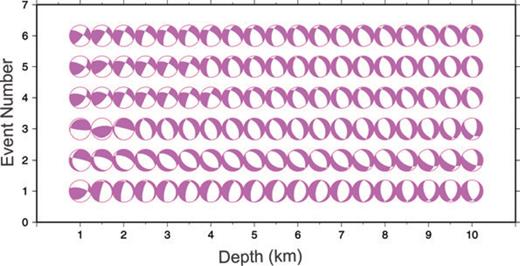
Variation of focal mechanism with focal depth varied between 1 and 10 km for the selected events using the new crustal velocity model. The mechanism is found to be quite stable except at very shallow depths.
3.4 Effect of crustal models
Detailed waveform modelling studies were carried out for all the events using all the velocity models listed in Fig. 2, including the new model. The model of Gupta et al. (1980), however, is excluded from this analysis since it has just a single layer for the entire crustal column. The new model obtained from the VELEST approach not only provides the least traveltime residual errors, but also a minimum waveform mismatch error consistently for all the events studied (Fig. 7) and has been, therefore, adopted for the final analysis in this study. The models of Bhattacharya (1981) and Langston (1981) do not provide the required level of waveform matching since they are more regional, devoid of the detailed shallow structure as compared to the other models. Some of the smaller differences could also arise from deviations in the locations of the study regions and the approaches used. The model of Krishna et al. (2006) is the most recent and comprises a detailed structure, including several low-velocity layers. However, it does not seem to provide the required level of waveform matching. Whether this can be attributed to local variation of structure between study regions cannot be verified with the present data. Similarly, verifying the issue of low-velocity layers would require waveform modelling at higher frequencies with a much larger data set and better control on the crustal structure. Similar to the focal depth parameter, the crustal structure also has a minimal effect on the fault plane parameters of the focal mechanism solutions as can be seen from Fig. 8. This is mainly attributed to the use of low-frequency waves in the modelling.

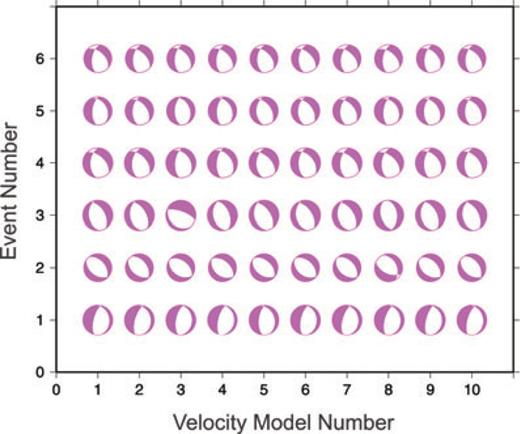
Variation of the focal mechanism for the selected six events using various crustal velocity models shown in Fig. 2. Mechanism corresponding to the best focal depth is plotted.
3.5 Seismo-tectonics
It is well known that the fault mechanism in the Koyna–Warna region is predominantly strike-slip or normal (Talwani 1997b). While the Koyna region earthquakes are mostly governed by strike-slip-type earthquakes, including the 1967 main shock of M 6.3, earthquakes near Warna to the south are governed by mostly normal fault mechanisms. Gahalaut et al. (2004) suggest that the fault geometry in Koyna–Warna is conducive to fault interactions through stress transfer, causing strike-slip and normal faults. In this study it is important to note that the NNW trending faults F1 and F4 inferred from LANDSAT data (Langston, 1981) and F2 and F3 inferred from interpretations of aeromagnetic anomalies (Agrawal et al. 2004) correlate well with the fault planes of the focal mechanism solutions (Fig. 9). The seismogenic depth range of 5–6 km inferred in this study for the Warna region is quite different from that inferred at 6- to 11-km depth from deep seismic sounding studies (Talwani 1997b; Reddy 2005). However, this depth range could be region specific to Warna as also indicated by Sarma & Srinagesh (2007). Several more earthquakes need to be studied to ascertain the true seismogenic depths in this region.
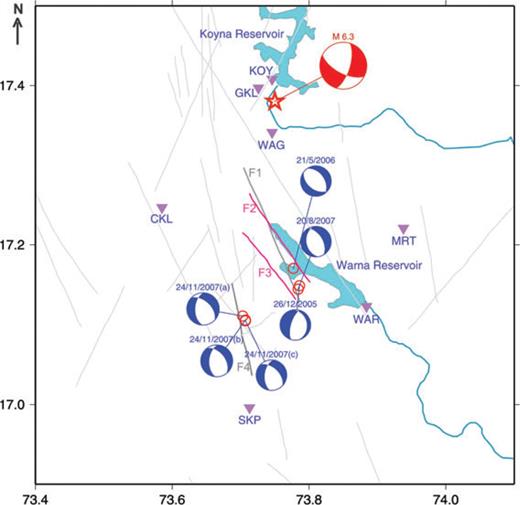
Focal mechanism solutions obtained in this study (blue) for the Warna region using the waveform inversion approach, along with the focal mechanism of the 1967 Koyna earthquake of M 6.3 (red) by Langston (1976). Also plotted are the lineaments F1 and F4 inferred from LANDSAT imageries (Langston 1981) and F2 and F3 inferred from aeromagnetic anomalies (Agrawal et al. 2004) that are seen to correlate well with the fault planes of the estimated focal mechanisms.
Detailed models of the mechanics of faulting in different tectonic scenarios have been discussed by Scholz (1991) along with the corresponding orientations of the principal stress vector components. In the case of Koyna region, it has the distinction of being an intraplate, reservoir triggered seismic scenario with an additional complexity of a thick trap cover overlying ancient cratonic rock types that host a series of pre-existing faults probably owing to isostatic vertical tectonics of the Western Ghats over long geological time periods. Hence, understanding seismogenesis at deeper levels of several kilometres in such a scenario is rather difficult.
The shift of seismicity since 2005 from the Koyna region to the Warna region further south indicated in this study is quite significant. The emergence of nascent seismic activity of moderate size, including a new zone of seismic activity to the SW of Warna in the 5- to 6-km depth range has implications for future seismicity of the Warna region. The three events of this zone have a significant strike-slip component compared to those near the reservoir that are close to pure normal mechanism. If the spurt of seismicity observed in this study is any indication, the occurrence of a larger earthquake in the Warna region in the near future cannot be ruled out (Gupta et al. 2007). Future efforts should focus upon joint modelling of focal mechanisms of several earthquakes as well as crustal velocity structure using differential seismogram methods (Zeng & Anderson 1995; Moinet & Dietrich 1998) or Genetic algorithm approaches to model waveform data from dense seismic networks (Stoffa & Sen 1991; Sambridge & Drijkoningen 1992).
4 Conclusions
- 1
A significant shift of seismicity in the recent years from the Koyna region in the north to the Warna region in the south and the development of a new seismic zone to the SW of the Warna reservoir are reported.
- 2
A new velocity model has been obtained using the VELEST approach for the Koyna–Warna region characterized by a trap thickness of 1.2 km with a P-wave velocity of 4.40 km s−1 and an upper crustal layer down to 10 km depth with a velocity of 5.96 km s−1.
- 3
Inversion of broad-band waveform data of Warna earthquakes indicates predominantly normal-type focal mechanism solutions, some having a component of strike-slip. The fault planes correlate well with those inferred from LANDSAT and aeromagnetic anomaly data.
- 4
Focal depths in the range of 5–6 km are estimated in the Warna region using the waveform modelling approach at local distances, indicating a much shallower seismogenic zone than that reported in previous studies.
- 5
Future efforts should focus upon joint waveform modelling of focal mechanisms of several earthquakes along with the crustal velocity structure to resolve issues of faulting mechanism and seismogenic depths in the Koyna–Warna region.
Acknowledgments
We are grateful to Prof. Pradeep Talwani and other reviewers for critical review and very valuable suggestions. We are very thankful to all the colleagues who helped in field investigations in the Koyna region. Masahiro Kosuga was generous in providing computer codes for waveform inversion. The project numbered MoES/P.O.(Seismo)/23(430)/2004 was funded by the Ministry of Earth Sciences, Government of India. HG acknowledges DAE for the Rajaramanna fellowship. We thank Dr D. Srinagesh and Dr M. Ravi Kumar for their constant support. The Koyna Hydroelectric Project authorities, Government of Maharashtra, provided immense support during the investigations.
References
