


Summary
The dependence of infrasound propagation on the season and path environment was quantified by the analysis of more than 1000 repetitive infrasonic ground-truth events at an active, open-pit mine over two years. Blast-associated infrasonic signals were analysed from two infrasound arrays (CHNAR and ULDAR) located at similar distances of 181 and 169 km, respectively, from the source but in different azimuthal directions and with different path environments. The CHNAR array is located to the NW of the source area with primarily a continental path, whereas the ULDAR is located East of the source with a path dominated by open ocean. As a result, CHNAR observations were dominated by stratospheric phases with characteristic celerities of 260–289 m s−1 and large seasonal variations in the traveltime, whereas data from ULDAR consisted primarily of tropospheric phases with larger celerities from 322 to 361 m s−1 and larger daily than seasonal variation in the traveltime. The interpretation of these observations is verified by ray tracing using atmospheric models incorporating daily weather balloon data that characterizes the shallow atmosphere for the two years of the study. Finally, experimental celerity models that included seasonal path effects were constructed from the long-term data set. These experimental celerity models were used to constrain traveltime variations in infrasonic location algorithms providing improved location estimates as illustrated with the empirical data set.
1 Introduction
Multiple infrasonic observations of the same source at different azimuths and ranges can increase confidence in signal detection, association and improve infrasonic location accuracy. Azimuth and traveltime estimates are fundamental outputs from infrasound array processing that constrain the location and impact its accuracy. For the most probable location, the azimuth deviation term resulting from the wind normal to the propagation direction is corrected using atmospheric models (Evers et al. 2007a). The traveltime of infrasound propagation, which determines celerity calculated by dividing the propagation range from source to receiver by the traveltime, is also used in inverse location procedures by estimating its value from ray tracing simulations using atmospheric models (Le Pichon et al. 2002) or constraining its possible range at certain distances (Arrowsmith et al. 2009). Thus, realistic theoretical or empirical traveltimes and celerity models are required to support reliable infrasonic phase identification, association and localization.
Infrasonic phases are usually classified as tropospheric (Iw), stratospheric (Is) or thermospheric (It), depending on their refraction height in the atmosphere. The stratospheric return is the dominant infrasonic phase observable at regional distances. Observations of this phase are frequently used for infrasonic source location and energy estimation (Whitaker et al. 2003) because of its efficient atmospheric propagation. The characteristic celerity for this phase is known to be 0.28–0.31 km s−1 (Brown et al. 2002). Evers and Haak (2007b) proposed a modification of the conventional celerity range of Is to 0.25–0.31 km s−1. Furthermore, they found fast stratospheric phases of 0.31–0.36 km s−1 due to head-wave like propagation in a high velocity acoustic channel at stratospheric heights. They noted that unambiguous phase identification cannot be made solely on the basis of celerity values as the range of celerity values can include multiple infrasonic phases including the thermospheric phase (0.23–0.28 km s−1) and the tropospheric phase (∼0.34 km s−1), direct acoustic arrivals propagating with the sound speed. The documented variation in celerity for a given phase may suggest that the characteristic celerity depends on both the season and large-scale atmospheric conditions.
Seasonal variations of infrasound propagation, especially in stratospheric winds, have been pointed out in several recent studies (Arrowsmith and Hedlin 2005; Le Pichon et al. 2008, 2009; McKenna et al. 2008). Le Pichon et al. (2008) noted that infrasound detection capability is strongly affected by the seasonal variability of prevailing stratospheric wind direction and strength based on a large range of infrasound amplitudes, either produced by natural phenomena or man-made events in Central Europe. Therefore, to validate the design goal of regional infrasound networks as well as the global infrasound network of the International Monitoring System (IMS) of the Comprehensive Nuclear-Test-Ban Treaty (CTBT), the quantification of the seasonal variations in atmospheric propagation at regional and global-scale with highly defined repetitive ground truth events covering full seasons is needed. Analysis of data associated with ground truth events can be used to document atmospheric effects on infrasound propagation and to demonstrate detection capabilities of infrasound networks.
The purpose of this study is to experimentally characterize infrasonic traveltime and construct quantitative celerity models that depend on the season and propagation path. We collected nearly daily repetitive infrasonic observations over a two-year time period from ground-truth events at an active mine. These events included more than 1000 surface blasts that occurred daily, with multiple events on active days, over the two years. Variations in infrasound propagation based on the data are quantified at the two infrasound arrays, both located at similar distances from the mine but with different propagation environments—one path dominated by the continent and the other by the ocean. Array processing based on the progressive multichannel correlation (PMCC) (Cansi 1995), is used to detect and analyse the blast-associated infrasonic signals and to construct a celerity model for each path. Characteristics of the two sets of experimental celerity models include seasonal dependent path effects to each array. Signal detectability at each array is investigated and quantified with the assessment of local atmospheric effects such as surface wind noise near the source and receivers as well as atmospheric sound velocity structure between the source and receiver. Ray tracing using empirical atmospheric models supplemented by shallow atmosphere constraints provided by weather balloon data was performed for comparison with the observations. Thus, variations in infrasound traveltimes were quantified, and the detectability at distance arrays with seasonally varying path environments assessed.
2 Collection of Long-Term Ground-Truth Data
Surface-blasting activities at industrial mines provide point sources that produce impulsive infrasonic signals. Well-defined blasting information can be used to study the characteristics of infrasound propagation through the atmosphere and to verify infrasonic source location methods at regional distances. In particular, the long-term collection of ground-truth events from mines that conduct daily blasts allow us to assess the spatial and temporal variations of azimuths and traveltimes along different propagation paths.
To characterize the variation of infrasound propagation with season and path environment, we collected nearly continuous infrasonic ground-truth data from an active open-pit limestone mine in South Korea for two years. Fig. 1 shows the locations of the mine, along the east coast of the peninsula, and the two infrasound arrays, CHNAR and ULDAR. The mine performed up to several blasts each working day for limestone extraction. Typically, several tons of explosives were used in blasts conducted in the main working zone with smaller explosions in an adjacent area (personal communication with mine office in 2008 and 2009). Two in-mine seismo-acoustic stations were deployed at the southern and southwestern boundaries of the main blasting zone, which covered an area of approximately 0.7 × 0.4 km. Individual-blasting points moved within this area depending on the daily mining requirements. The distances from the stations to the centre of the zone were approximately 0.5 km. A seismometer (CMG40T1) and acoustic sensor (Chaparral Physics Model 2 microphone) connected to a wind-noise reducer were deployed at each station to record near-field seismic and acoustic pressure changes. The two stations were used to ensure continuous recording with minimum data loss, unambiguously separation of signals from unwanted noise and observations to roughly locate the blasting point within the mine. Continuous data were recorded at 100 samples per second beginning in 2007 April and continued for two years.
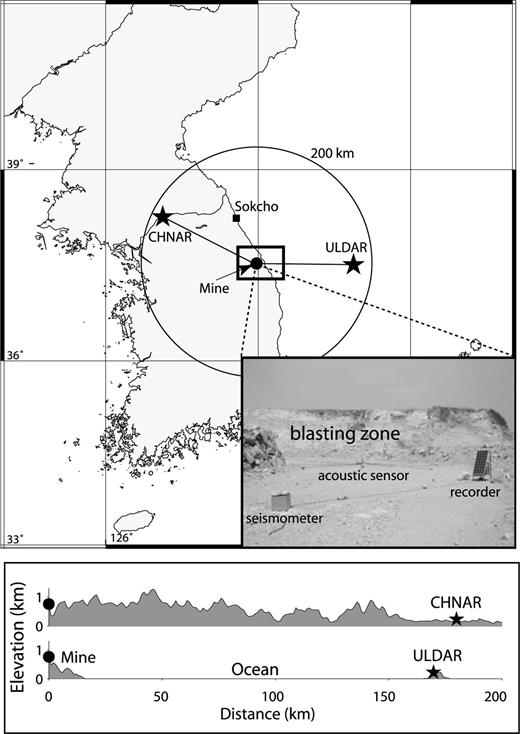
(Top panel) Locations of the open-pit mine (circle), two infrasound arrays (stars) and weather balloon station (square) used in this study. A photograph of one in-mine seismo-acoustic station is shown in the lower right. Topographic variations from the mine to infrasound arrays, CHNAR and ULDAR are displayed in the bottom panel.
3 Variations of Infrasound Propagation
During the two years of in-mine sensor operation, 1066 blasts were detonated, more than one blast per day on average. 97 per cent of the blasts occurred at or around 03 UTC (12 pm local time). Thus, the mine could be considered as an infrasonic bell generating daily repetitive signals. Most of the blasts were delay-fired, with the largest using 11.2 tons of explosives (personal communication with mine office). The origin time and approximate location of each event was estimated using the seismic and infrasound observations from the in-mine stations.
Seasonal variations in the infrasound propagation to regional distances were quantified using observations of the ground truth blasts at the two, infrasound arrays, CHNAR and ULDAR (Fig. 1). These seismo-acoustic arrays consist of colocated seismometers and acoustic gauges with an approximate 1-km aperture. CHNAR consists of 11 acoustic sensors and four seismometers that were deployed by Korea Institute of Geoscience and Mineral Resources (KIGAM), in collaboration with Southern Methodist University with the goal of detecting distant infrasound signals from natural and anthropogenic phenomena in and around the Korean Peninsula (Stump et al. 2004). ULDAR consists of seven acoustic sensors and five seismometers located on an island in the ocean, to enhance azimuth coverage of previous array distributions and to supply infrasound data recorded in an oceanic environment (Che et al. 2009). Acoustic sensor layouts are shown in Fig. 2.
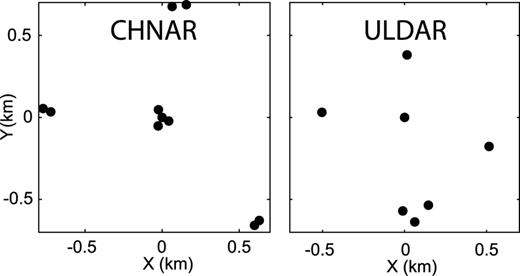
Acoustic sensors spatial distributions at the seismo-acoustic arrays, CHNAR (left-hand side) and ULDAR (right-hand side).
The arrays are located at similar distances from the mine, 181 and 169 km for CHNAR and ULDAR, respectively, but the propagation path environments were quite different. CHNAR is located northwest of the mine and the travel path is completely over the continent. The propagation direction to ULDAR is nearly opposite to that of CHNAR, with a path to the east across the ocean. As shown in Fig. 1, high topographic variation exists from the mine to CHNAR. The topographic elevations in some parts are higher than that of source, approximately 0.8 km above sea level. In contrast, no topographic blockage exists between the source and ULDAR. The two propagation directions are nearly coincident with strong zonal winds in this region, where prevailing stratospheric winds blow westward during summer and in the opposite direction during winter.
The origin time of each blast was estimated from in-mine seismic recordings. Infrasonic array data were analysed using the PMCC method, to detect blast-associated infrasonic signals. The wave parameters of each detected signal, including the arrival time and azimuth, were then estimated at each array. Fig. 3 displays the waveforms and analysis results for one set of ground-truth events. The upper left figure shows near-field seismic and acoustic signals recorded at the two in-mine stations (ACE3 and ACE7). The acoustic signals in this case were clipped due to the instrument dynamic range and the close distance to the 10-ton blast. Arrival time differences between the near-field seismic and acoustic signals are 1.01 and 1.38 s for the southwestern (ACE3) and southern (ACE7) stations. Although these measurements can refine the source location within the mine, we simply used the centre of the main blasting zone as a source location for all blasts, because location differences within the mine are small compared to the total propagation distances to the arrays. The near-field waveforms are used to identify the source of the regional signals and estimate the origin time of each blast. Blast-associated infrasonic signals observed at each regional array are reproduced in the box in the upper right figure. PMCC results are also summarized in the figure. WinPMCC v2.1 was used to make the regional wavefield estimates focusing on a phase velocity range of 0.25–0.40 km s−1 using a window length 20 s, and a frequency band 0.5–5 Hz. Signals at the two arrays were defined to be associated with the blast if they had arrival times that fell within the predicted range of infrasound arrival times using the ground truth seismic origin time. An additional constraint was imposed based on the consistency of the azimuth estimates and the mine location relative to the array. After signal association, we compiled traveltimes and wave parameters determined from PMCC. One significant result illustrated by this example is that the traveltimes of the two signals were consistently different, even though they propagated similar distances.
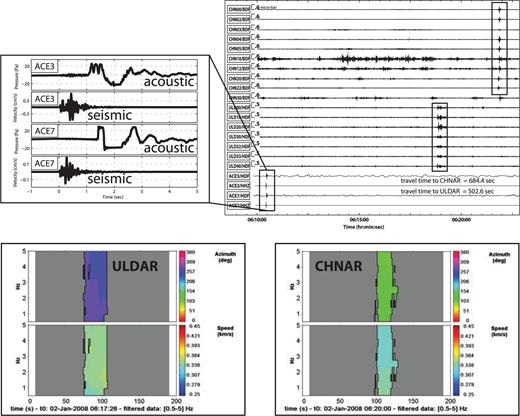
Example data for a 10-ton blast. The four waveforms from the blast are the near-field seismic and acoustic signals recorded in the mine (upper left-hand side). The blast-associated infrasound signals recorded at the two regional arrays are marked by boxes with the upper 10 waveforms from CHNAR, excluding one bad channel (CHN32), and the next seven waveforms from ULDAR (upper right-hand side). Measured traveltimes for both infrasonic signals are listed in the lower right. The corresponding PMCC results display the estimates of azimuth (upper part) and apparent velocity (lower part) for the detected signals.
Fig. 4 summarizes the variation of infrasound traveltimes and azimuths to the two arrays for all the ground-truth events that were observed over the two years. Despite similar propagation distances, the average traveltimes were significantly different to the two arrays, with arrivals at ULDAR on average 150 s earlier than those at CHNAR. The traveltime differences between the two arrays exceeded the expected difference based on a common celerity of 0.3 km s−1, a typical value for infrasonic waves propagating as stratospheric phase (Brown et al. 2002). The celerities calculated for CHNAR from the distances and traveltimes ranged from 260 to 289 m s−1 corresponding to values characteristic of stratospheric returns (Evers & Haak 2007b). In addition, the traveltimes showed systematic seasonal variations with signals arriving up to 68 s faster in the summer. Thus, the celerity data produced a temporal plot that documents a smoothly varying cyclical change with time, with velocities of ∼0.26, ∼0.29 and ∼0.27 km s−1 in the winter–spring, summer and fall seasons, respectively. This systematic variation in observed celerity is consistent with the contention that the traveltimes of infrasound signals are strongly dependent on the seasonal ambient sound speed along the path. In contrast, the infrasound signals arriving at ULDAR showed relatively large celerities (322 to 361 m s−1), characteristic of tropospheric returns. The traveltimes to ULDAR show little seasonal variation but document larger daily variations of up to 56 s in the traveltimes between individual days. These observations can be partially attributed to the dominant effect of the ocean on temperatures at the ocean–atmosphere boundary.
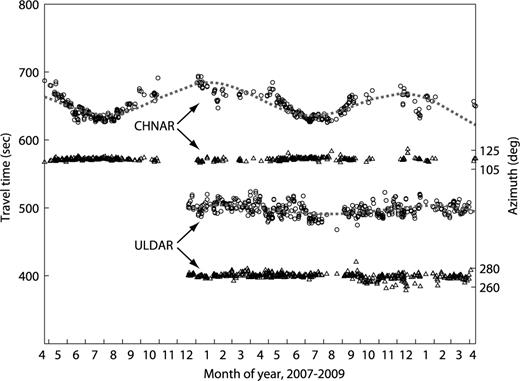
Variations of traveltime (circles) and azimuth (triangles) estimated at both arrays from the ground truth events recorded over the two years of the study. The dotted lines superimposed on the observed traveltimes are sinusoidal celerity models that were fit to the observations. Note that ULDAR was installed in 2007 December and so there is a shorter observing time period.
Path variations also impact the ability to detect the arrivals. Signals at CHNAR were most likely to be detected in the summer. Many signals were not detected during the fall–winter–spring seasons (Table 1), even though strong source signals were identified at the in-mine stations for these times. Detection at ULDAR was low in summer (i.e. August) but stable during the other seasons. Thus, the seasonal detection at the two arrays was complementary, as shown in Fig. 4, as result of the azimuthal differences of the two arrays relative to the mine. This variation in detection can be partially explained by seasonal changes in the atmospheric wave duct attributable to known seasonal wind in and around the Korean Peninsula with winds northwesterly in the winter and southeasterly in the summer. In contrast to the variation of traveltimes, the azimuth estimates showed little variation with season at either array. The mean and variance of the azimuth estimates were 115.6 ± 1.6° at CHNAR (115.8° of true azimuth) and 271.5 ± 3.1° at ULDAR (271.7°), respectively. The insensitivity of backazimuth to seasonal variations is consistent with the relatively weak meridional winds [5.9 per cent and 27.2 per cent of annual average zonal wind speed at 10 and 30 km above the mine, respectively, estimated from Horizontal Wind Model (Drob et al. 2008)] in the region, which are normal to the dominantly EW propagation paths in this study.

Monthly detectability (per cent) at CHNAR and ULDAR.
The detectability of signals at regional distances can be affected by atmospheric effects, near-surface background noise including the effects of winds at the location of source and receiver, as well as the sound velocity structure that determines the trajectory of the wave paths in atmosphere. Before investigating atmospheric path effects using ray tracing, we qualitatively compare the detectability of signals with the distribution of near-surface wind fields around the mine at the time the signals were generated and around the arrays at the time the signals arrived. For the comparison, we used near-surface meteorological data collected by Automatic Weather Station (AWS) operated by Korean Meteorological Administration (KMA, www.kma.go.kr), with stations closely located to the mine and the two arrays—CHNAR and ULDAR. We compiled 10-min average wind direction and speed at the time each blast occurred from the continuous meteorological data of an AWS located 9.9 km away from the mine and 658 m above sea level. In case of arrays, average wind data (3.9 km away from CHNAR and 2.1 km from ULDAR) were compiled 10 min after the origin time of each blast to account for propagation times to each array. Figs 5(a)–(d) display near-surface wind field estimates for the mine. The wind field is primarily distributed in NE–SES directions with wind speeds less than 5 m s−1 when the blasts occurred. Wind directions are compared with the preferable directions to the receivers at each array (thick lines) and signal detection is not significantly correlated with the relatively low near-surface winds at the source. Signal detections are also compared to the wind conditions at the arrays—CHNAR (Figs 5e–f) and ULDAR (Figs 5g–h). Under wind conditions at CHNAR opposite to the preferred propagation direction and in excess of 4 m s−1, a relatively large number of blasts were not detected. In case of ULDAR, winds are primarily in NW directions, nearly the preferred propagation direction and signal detection is slightly higher in the preferable wind direction under low wind speed.
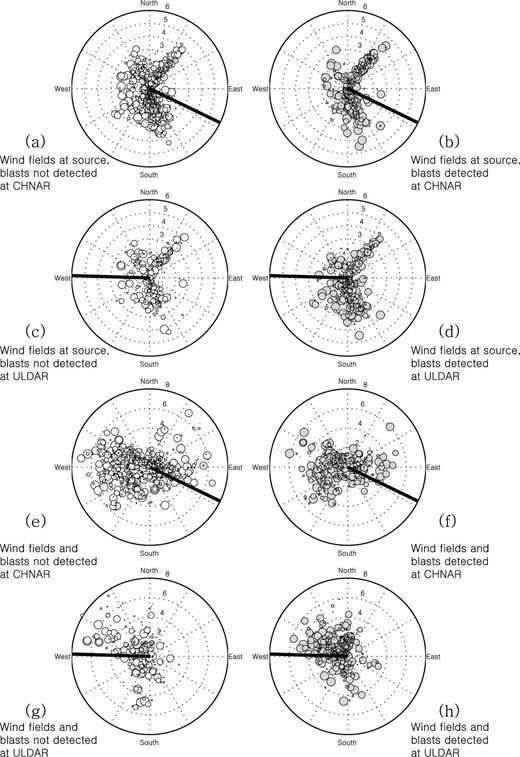
Polar plots of surface wind fields near the mine and the two arrays during the times when acoustic signals were generated (at mine) and were observed or expected to be observed (at arrays). The plots in the left-hand side column are for time periods in which the ‘blasts were not detected’ and the right-hand side column represents time periods when ‘blasts were detected’ at each array. (a and b) Wind fields around the mine with respect to signal detection at CHNAR, and (c and d) at ULDAR. (e and f) Winds fields around CHNAR with respect to signal detection at the array. (g and h) same plot for ULDAR. The size of the circles are proportional to the maximum acoustic pressure recorded at the in-mine stations. Thick lines indicate preferable wind directions to each array.
4 Ray Tracing Simulations
Atmospheric ray tracing was conducted for all the observations over the two years of the study using a combination of empirical atmospheric models [Horizontal Wind Model/Mass Spectrometer, Incoherent Scatter: HWM07 (Drob et al. 2008)/MSISE-90 (Hedin et al. 1991)] for the upper atmosphere and weather balloon data for the lower atmosphere, merged using cubic spline at boundary. The lower part of the effective sound velocity profiles (ESVP) used for ray tracing (Hagerty et al. 2002) was based on the weather balloon data from the Sokcho station (Fig. 1), which is closer to both the mine and arrays than other stations operated by the KMA. We consider the balloon data to be the most reliable source of information on the velocity structure in the lower atmosphere between the mine and arrays for testing purposes. Since there are no balloon stations near the arrays, we assume that atmospheric profiles are horizontally identical from the mine to arrays. The measurement height of the balloon data depended on the day, but data were usually available to an approximate altitude of 30 km and included temperature, wind direction and wind speed. Balloon launches occurred each day at 00 and 12 UTC (9 am and pm local time). Data acquired at 00 UTC was used for the modelling because it was within 3 hr of the average time of the blasts. Ray tracing was computed for each day of the experimental period and included models for 726 d at CHNAR and 484 d at ULDAR (smaller number of days for ULDAR reflects its more recent installation, 2007 December). Rays were shot with take-off angles from 60 to nearly 90° from the vertical with an interval of 0.1°. When trajectories of a ray passed within 1 km (capture radius) of the array, the ray was identified as an eigenray for the infrasonic phase. Of the eigenrays computed on a given day, the ray passing most closely to the receiver was selected as a representative eigenray for the day. We subsequently grouped the results of the ray tracing output based on the different infrasonic phases predicted at each array (Fig. 6). In the case of CHNAR, the total rays from the simulations were grouped into four dominant classes. (1) In 44.2 per cent of the cases there exists a thermospheric phase but CHNAR is located in a acoustic shadow zone for the rays, It_shadow (Fig. 6a); (2) in 36.2 per cent of the cases there exists a stratospheric phase but CHNAR is again located in a shadow zone, Is_shadow (Fig. 6b); (3) in 16.3 per cent of the cases there was a tropospheric phase that was predicted to return to CHNAR, Iw_eigen (Fig. 6c), and (4) in 3.3 per cent of the cases there was predicted a stratospheric phase that is predictable to return to CHNAR, Is_eigen (Fig. 6d). In the case of ULDAR, four dominant cases were identified and included It_shadow (9.9 per cent), Is_shadow (5.4 per cent), Iw_shadow (3.1 per cent) and Iw_eigen (81.6 per cent; Figs. 6e–h). Unlike the other shadowing phase, the Iw_shadow phases jumped ULDAR with bounces at the surface.
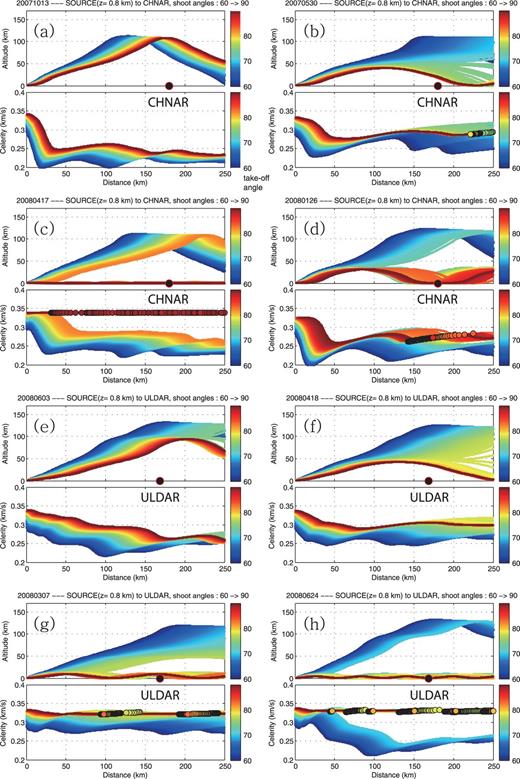
Typical examples of ray tracings results for CHNAR (a–d) and ULDAR (e–h). Each example has panels showing the variation of ray paths (upper part) and their celerities (bottom part) with respect to take-off angles. (a) CHNAR in a shadow zone with a thermospheric phase, It_shadow, (b) CHNAR in a shadow zone with a stratospheric phase, Is_shadow; (c) CHNAR with a tropospheric phase, Iw_eigen; (d) CHNAR with a stratospheric phase, Is_eigen; (e) ULDAR in a shadow zone with a thermospheric phase, It_shadow; (f) ULDAR in a shadow zone with a stratospheric phase, Is_shadow; (g) ULDAR in a shadow with a tropospheric phase, Iw_shadow and (h) ULDAR with a tropospheric phase, Iw_eigen.
Fig. 7 displays the variation of ESVP for the two years of the study along with the ray tracing results. The refraction altitudes of each daily eigenray from the mine to the individual arrays are superimposed on the ESVP. For CHNAR, ray tracing predicted a smaller number of eigenrays representative of stratospheric returns (Fig. 6d) than that documented in Fig. 4. Although many stratospheric returns were predicted from ray tracing (the black dots around 40 km altitude), CHNAR was in the so-called zone of silence in most of these prediction. This comparison implies that the ESVP, particularly the empirical models with stratospheric returns, were not sufficient to predict the real observations or that the capture radius was too small, even though the predictions for the Is_eigen are increased by widening the capture radius, for example, 5.5 per cent for 5 km and 15.1 per cent for 10 km of capture radius. In addition to the restricted resolution of the atmospheric model, the limitations of the high-frequency asymptotic method of ray tracing used in this study can also contribute to the lower estimates of signal detectability by the models (Kulichkov et al. 2010). Most Is_eigen phases at CHNAR were predicted during the winter (see January of 2008 and 2009) with refraction altitudes corresponding to heights sampled by the balloon data. These predictions can be explained by not only the lower sound speed at the ground relative to that at stratospheric heights but also by the lower refraction height which reduces the range of the shadow zone during this season. The higher level of signal detection predicted for the mid-winter (January) in comparison to the spring and fall seasons was consistent with the observations detailed in Fig. 4. The calculations also predicted many Iw_eigen phases that refracted at very low altitudes and experienced bounces at the ground surface (Fig. 6c), but the corresponding phases were not clearly observed in the ground truth data. This second result suggests that the Iw phase may have limited horizontal propagation along the continental path which includes significant topographic variation between the mine and CHNAR. In contrast, many eigenrays returned to ULDAR by refraction at altitudes lower than 20 km, Fig. 6(h). These altitudes were in the range where the balloon data were collected.
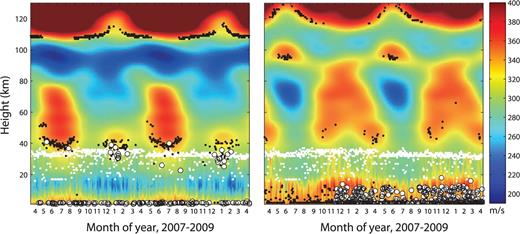
Ray tracing results using effective sound velocity profiles (ESVP) for the path from the mine to CHNAR (left-hand side) and to ULDAR (right-hand side) for the 2 yr of the study. White dots indicate boundary heights between balloon data and the empirical data used for the ray tracing. Black dots indicate the lowest possible refraction heights where the sound speed is larger than that at source. White circles indicate turning points in the atmosphere from the predicted eigenrays for each day at 00 UTC.
Fig. 8 compares the calculated traveltimes of the dominant phases, Is_eigen (CHNAR) and Iw_eigen (ULDAR) with the observations. Calculated traveltimes at CHNAR are consistent with the trends of observations, except for outliers (marked by arrows in the figure). Outliers with smaller traveltimes are due to lower refraction heights, that is, shorter ray paths in the atmosphere, and the one outlier with larger traveltime is due to bouncing at the ground surface along the path. In the case of ULDAR, although the calculations did not match the observed traveltimes in all cases, the predicted range of celerities, 313–363 m s−1, closely matches the observations (322–361 m s−1). Considering the temporal change in atmospheric sound profile during a day, the time difference between the balloon launch time and the typical blasting time at the mine could be a potential cause of the mismatch between the calculations and observations. These variations in celerity are partially a result of the wind speeds along the propagation paths to ULDAR, which reached up to 92 m s−1 in the troposphere. These calculations showed more daily and less seasonal variations than the CHNAR observations. The characteristics of signal detection from the observations are also explained by ray tracing, with a strong waveguide in the lower atmosphere, except in the summer, August.
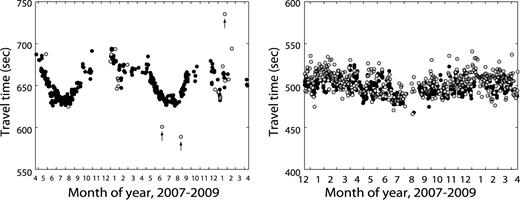
Comparisons of observed (black) and calculated (grey) traveltimes at CHNAR (left-hand side) and ULDAR (right-hand side).
5 Implications for Infrasound Locations
To quantify possible source location improvements that can be realized when seasonal path effects are taken into account, we performed infrasonic locations for selected ground-truth events whose infrasonic signals were detected by both arrays. The results of these infrasound locations are compared with locations determined using only seismic observations. The blasts, surface explosions at the industrial mine, were routinely detected seismically and located by the Korea Earthquake Monitoring System (KEMS) of the KIGAM. The infrasound locations were estimated using a least-square method that minimizes the residuals of observed azimuth and arrival time. Since we used two kinds of estimates at two arrays in this study, the optimum least-square solution (location and origin time) was iteratively refined by using four observation equations. Initial location was first determined by intersecting the azimuths of both arrays. Based on the initial location, we inversely estimated origin time at each array using the distances between the initial location and the two arrays with a constant velocity of 0.3 km s−1. The initial origin time for the least square was then determined by averaging the two origin times.
Infrasonic signals from 130 blasts were detected by both arrays. In this study, we calculated two different location sets for these selected blasts. The first set of location estimates were determined by assuming common stratospheric phase for both arrays with constant celerity of 0.3 km s−1 for all seasons in the least-square method. This approach disregards the variation in propagation velocity with azimuths and seasons during the location process, similar to many initial assumptions in seismological location. The second location estimates were calculated using a simple sinusoidal celerity model which were fit to the observation (dotted lines in Fig. 4), and includes seasonal dependences as documented in this study. The location results are summarized in Fig. 9 with the blue squares representing the first set of locations and the red ones the second location set using the seasonal dependent celerity models. 95 per cent confidence ellipses for each location set are also included in the figure. The centroid for the location of the first set is biased about 17.8 km to the east of the mine due to the discrepancies between the assumed constant celerity and real celerities shown in Fig. 4. The average location estimates using the experimentally determined celerity models that included seasonal path effects showed only a 1.7 km offset from the mine location, thus reducing the location offsets from the ground-truth by approximately 79 per cent compared to those that used constant celerities. The average origin times differences between the ground truth data and those from the second set of locations was 5.6 s, which is smaller than that of the first location set, 10.8 s. The NE–SW distributions in both location sets is attributed to azimuth deviations at the two arrays located along a nearly EW trend. This result suggests that, for infrasonic source location at regional distances, the dependence of infrasound propagation on seasons and path environments should be quantified and its effects incorporated into the infrasound location method to produce improved location estimates.
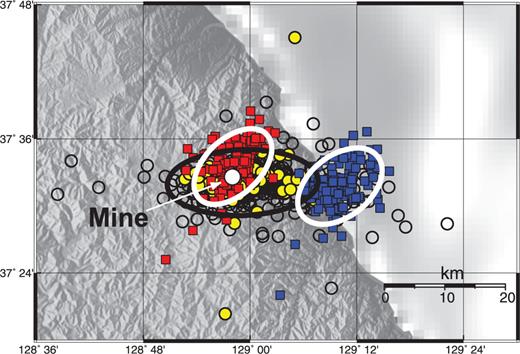
Two infrasonic locations results for selected ground truth events using constant celerity model (blue squares) and sinusoidal model (red squares). Circles indicate seismic locations of the ground truth events determined by the KEMS.
In Fig. 9, black circles indicate seismic locations for the blasts extracted from the seismological catalogue of the KEMS. Of the total ground truth data set used in this study, the KEMS detected 589 events (open circles) with local magnitude ranging from 0.5 to 1.8 ML. Yellow circles in the figure indicate the 100 seismic locations which correspond to the 130 blasts located using only the infrasound signals as described above. It is interesting to note that there were 30 events in the infrasound set that did not produce seismic events in the database. The scattered distribution of the seismic locations around the mine is related to seismic location errors resulting from the analysis of low signal-to-noise ratio (SNR) seismic data, possibly due to delay-fired blasts with several tones of explosives, reflecting the sparse and narrow-azimuth distribution of seismic stations. The EW distribution in location is probably due to picking errors for surface wave (Lg) arrivals in the data from the seismic station KSRS, which is one of the IMS primary seismic stations located to the west of the mine and a primary contributor to the seismic location of these blasts. Finally, comparing the infrasonic location with the seismic location, suggests that the infrasonic location including seasonal path effects are at least comparable to seismic location in case of small-magnitude surface explosions at regional distances.
6 Conclusion and Discussion
A two-year study of infrasound wave propagation has been conducted using ground truth events collected at an active mine in Korea. The data set included 1066 blasts and highlights the variation of infrasonic propagation due to the seasonal variation of atmospheric structures and propagation path environments. The data from the daily blasts were used to construct nearly continuous traveltime models for the observing period. The blast-associated infrasonic signals were analysed at two distant infrasound arrays, which were located at similar distances (zone of silence) from the mine but pointed in different azimuth directions over different path environments (continental and open ocean). Infrasonic waves travelling NW toward CHNAR over the continent propagated as guided waves between the ground and stratosphere, with a characteristic celerity range of 260–289 m s−1. These observations documented seasonal cyclical variations in traveltime. The infrasonic waves travelling East to ULDAR also propagated as guided waves, but observed celerities indicate that the wave ducts were formed at relatively low heights in the troposphere. The celerity range was correspondingly large (322–361 m s−1), even though the propagation distances to both arrays were similar. ULDAR showed more daily variation in traveltime than seasonal variation. The lower refractions were compared and verified by ray tracings with balloon data constraining the lower atmosphere. In particular, the observations at ULDAR support the existence of an ephemeral ‘SOFAR’ layer in the atmosphere (Herrin et al. 2006) throughout the year over the open ocean.
Statistically, CHNAR and ULDAR detected 35.5 per cent and 61.5 per cent of the infrasonic signals from the blasts, respectively. The higher detection capability for the path over the ocean was possible as a result of a relatively stable duct in the lower atmosphere as verified by ray tracing. The data also show that the signal detection was dependent on the season. Detection probability was higher in the summer than in spring, winter and fall at CHNAR, but opposite in trend for ULDAR. We interpret these variations with the seasons as partially controlled by variations in prevailing winds in and around the Korean Peninsula.
Finally, the data set illustrates that a celerity model that captures the seasonal path effects can substantially improve infrasound location procedures. The analysis of data like those reported here can be incorporated in a location algorithm by adopting empirically based bounding constraints for infrasonic location. In addition, the infrasound only location resulted in improved locations when compared to routine seismic locations for these small-magnitude surface explosions observed at regional distances. This location improvement is a result of the sparse seismic data from low SNR blasts. Therefore, we suggest that the infrasonic location method can be applied to an integrated seismo-acoustic monitoring system for small-magnitude surface explosions.
Acknowledgments
We would like to thank Mr. Kwan Kyo Chung, section manager of the mine office for his thoughtful supports during the experiment. We used atmospheric data collected by the Korea Meteorological Administration (). This work was supported by the Basic Research Project of the Korea Institute of Geoscience and Mineral Resources funded by the Ministry of Knowledge Economy of Korea. A portion of the work was also supported by the Air Force Research Laboratory under Contract FA8718–08-C-008.
References
