


Summary
We present results of a seismic refraction experiment which determines the crustal and upper-mantle structure of an oceanic core complex (OCC) and its conjugate side located south of the 5°S ridge–transform intersection at the Mid-Atlantic Ridge. The core complex with a corrugated surface has been split by a change in location of active seafloor spreading, resulting in two massifs on either side of the current spreading axis.
We applied a joint tomographic inversion of wide-angle reflected and refracted phases for five intersecting seismic profiles. The obtained velocity models are used to constrain the magmatic evolution of the core complex from the analysis of seismic layer 3 and crustal thickness. An abrupt increase of crustal velocities at shallow depth coincides with the onset of the seafloor corrugations at the exposed footwall. The observed velocity structure is consistent with the presence of gabbros directly beneath the corrugated fault surface. The thickness of the high-velocity body is constrained by PmP reflections to vary along and across axis between <3 and 5 km. The thickest crust is associated with the central phase of detachment faulting at the higher-elevated northern portion of the massif. Beneath the breakaway of the OCC the crust is 2.5 km thick and reveals significantly lower velocities. This implies that the fault initially exhumed low-velocity material overlying the gabbro plutons. In contrast, crust formed at the conjugate side during OCC formation is characterized by an up to 2-km-thick seismic layer 2 overlying a 1.7-km-thick seismic layer 3. Obtained upper-mantle velocities range from 7.3 to 7.9 km s−1 and seem to increase with distance from the median valley. However, velocities of 7.3–7.5 km s−1 beneath the older portions of the OCC may derive from deep fluid circulation and related hydrothermal alteration, which may likely be facilitated by the subsequent rifting.
Our velocity models reveal a strongly asymmetric velocity structure across the ridge axis, associated with the accretion of gabbros into the footwall of the detachment fault and upper-crustal portions concentrated at the conjugate side. Our results do not support a substantial increase in the axial ridge's melt supply related to the final phase of detachment faulting. Hence, the footwall rifting at 5°S may be a generic mechanism of detachment termination under very low melt conditions, as predicted by recent numerical models of Tucholke et al.
1 Introduction
There is ongoing debate concerning the relative importance of magmatism and faulting at slow-spreading mid-ocean ridges, in particular where long-lived detachment faulting and subsequent footwall rollover results in the formation of domal massifs, which are termed oceanic core complexes (OCCs). The abundance of gabbros and peridotites at the fault surface of these features demonstrates that their formation is often associated with the exhumation of lower-crustal and upper-mantle rocks (Cann et al. 1997; Escartin & Cannat 1999; Tucholke et al. 2001; MacLeod et al. 2002; Reston et al. 2002; Escartin et al. 2003). Because of their preferred localisation at segment ends in generally magma-poor environments, earlier studies argued for a pure denudation of the crust by tectonic processes, resulting in the exhumation of upper-mantle portions at shallower levels (Mutter & Karson 1992; Tucholke & Lin 1994). However, deep drilling into these features, two at the Mid-Atlantic Ridge (MAR) and one at the Southwest Indian Ridge, has recovered in each case a thick gabbro unit with virtually no serpentinized peridotites (Dick et al. 2000; Kelemen et al. 2004; Blackman et al. 2006). These observations clearly indicate an integral magmatic component during OCC formation. As a consequence, a set of revised models posits the accretion of gabbro plutons within a peridotite host into the footwall of the detachment fault (Reston et al. 2002; Ildefons et al. 2007; Dick et al. 2008; Tucholke et al. 2008). The initiation of the fault involves the localization of strain around the margins of the plutons, resulting in an uplifted gabbroic core surrounded by deformed serpentinite (Ildefons et al. 2007). The irregular along-axis shape of the intrusions is imprinted on the fault's footwall and forms the kilometre-scale corrugations exposed on a number of OCCs (Tucholke et al. 2008). However, many questions remain concerning the level of magmatism during the period of active fault slip and the possible processes which result in the termination of detachment faulting. Ildefons et al. (2007) noted that the formation of these features is related to periods of relatively enhanced melt extraction within overall magma-poor spreading. Tucholke et al. (2008) similarly concluded that long-lived detachment faulting can only be sustained within a limited ‘magmatic window’, when there is neither too much nor too little magmatism (30–50 per cent of total extension must be accommodated by magmatic accretion). Their numerical models show that if melt supply increases, it weakens the lithosphere at the ridge axis to the point that a new fault forms, which then accommodates plate separation instead of the detachment fault; in the alternative scenario of decreasing melt supply, advected heat weakens the flanks of the ridge and allows bending stresses to form a new fault off-axis that later takes up plate separation.
In this paper we use good quality refraction seismic data to explore the deep structure of a rifted OCC and its conjugate side at the 5°S ridge–transform intersection at the MAR. The obtained velocity structure and crustal thickness are used to evaluate the level of magmatism during detachment faulting, as well as for those times when OCC formation had already ceased. Our results may be used to revise recent models of melt extraction during detachment faulting and core complex formation (e.g. Buck et al. 2005; Ildefons et al. 2007; Canales et al. 2008; Tucholke et al. 2008).
2 Tectonic Setting
In 2000, R/V Meteor investigated two adjacent spreading segments, separated by a 70-km-offset transform fault, near 5°S at the MAR (GERSHWIN experiment: Geophysical Experiments to investigate Ridge-Segmentation: HoW INside and outside corners form; Fig. 1). Spreading here occurs perpendicular to the axial trend of 347° with a full spreading rate of 32 mm yr−1 (Demets et al. 1990). The northern segment is characterized by a regular ridge-parallel tectonic fabric and a couple of large seamounts, which are aligned along the flow-line of the segment centre, where a pronounced seafloor bulge is located in the median valley (Planert et al. 2009). Directly south of the ridge–transform intersection, seafloor morphology is rather irregular, showing as the most prominent features two pronounced massifs with a corrugated surface on either side of the median valley. Reston et al. (2002) demonstrated from the analysis of seafloor data that both massifs were conjoined originally and that their splitting was initiated by a ∼10 km westward jump in the location of active seafloor spreading. Hence, the outside corner high (OCH) represents a smaller fragment of a formerly intact OCC, which was formed at the inside corner of a fossil spreading axis located east of the OCH (see the abandoned axial volcanic ridge in the inset of Fig. 1). Dredging along the rifted flank of the inside corner high (ICH) recovered sheared serpentinites and gabbros from close to the corrugated surface and largely undeformed gabbros from the lower portions of the scarp. This is consistent with a concentration of serpentinites along the detachment surface, whereas the core of the massif might be largely plutonic in nature (Reston et al. 2002). It is unknown whether detachment faulting already ceased shortly prior to the ridge jump; the close proximity of the smaller fragment to the fossil ridge axis, however, suggests that the detachment fault was still active when the ridge jump eventually rifted the exposed footwall.
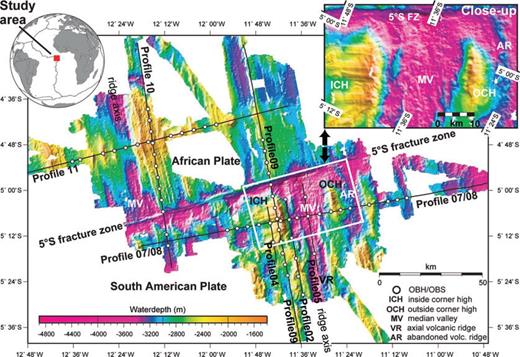
Hydrosweep swath bathymetry data of the work area. The 5°S fracture zone divides the Mid-Atlantic Ridge into two distinct spreading segments. South of the transform fault, two pronounced massifs with a corrugated surface are located on either side of the median valley (see close-up). The black lines indicate the seismic profiles shot during R/V Meteor cruise (GERSHWIN experiment). The locations of ocean bottom seismic stations are marked with white circles. A detailed analysis of the seismic data collected in the northern segment can be found in Planert et al. (2009).
Since the fossil ridge axis is blocked to the south by a major massif (Fig. 1), the area south of the OCC must be the locus of a second-order ridge axis discontinuity (RAD) prior to the ridge jump (Reston et al. 2002). The continuation of the spreading axis farther south at those times, however, is less clear due to the lack of high-resolution bathymetry.
Currently, the northernmost parts of the median valley do not exhibit an axial volcanic ridge and the observation of thin crust along the ridge axis on a refraction seismic profile (profile 05 in Fig. 1) suggests a relatively magma-poor phase of spreading (Reston et al. 2002). Results from a local microseismicity network reveal a concentration of earthquakes beneath the median valley and normal faulting down to maximum depths of 8 km below seafloor, associated with extension of the rift valley and unrelated to the detachment (Tilmann et al. 2004).
3 Seismic Data and Methodology
In this study, we present results for the wide-angle reflection and refraction seismic profiles 07/08, 02 and 04, as well as a new model for the median valley profile 05 (Fig. 1), which is based on the reprocessing and tomographic inversion of the data initially presented by Reston et al. (2002). Seismic profiles 09–11 and the detailed structure of the segment north of the 5°S fracture zone (FZ) are discussed in the work of Planert et al. (2009). Since line 09 is part of the dense seismic dataset in the area of the ICH, the corresponding results of this line are discussed in Section 4.2.3.
3.1 Input data
For the seismic data recordings, a total of 15 IFM-GEOMAR ocean bottom units (OBH/S) (Bialas & Flueh 1999) were deployed on profile 07/08 with ∼6 km instrument spacing. For the shorter along-axis profiles, up to 6 OBH/S were deployed at ∼10 km intervals. The seismic source used was an array of three 32 l Bolt air guns fired every minute, resulting in a nominal shot spacing of 120 m.
Data processing included the localisation of the instruments using the arrival time of the P wave and the exact shot point geometry. We applied a time-gated deconvolution (Wiener 1949) and a time and offset-variant Ormsby frequency filter in which the passband moves towards lower frequencies as record time and offset increases. An example of the data is given in Figs 2 and 3. Pick uncertainties for all profiles were assigned visually and range from 30 to 100 ms.

Seismic record sections (reduced with 8 km s−1) of profile 07/08 recorded by OBH21 and OBH36. Top panel: interpreted seismic arrivals are labelled: Pg (turning rays within the crust), PmP (reflected rays at the Moho) and Pn (turning rays in the upper mantle). Centre panel: computed traveltimes (red dots) and associated pick uncertainties (blue bars). Bottom Panel: corresponding ray paths through the final tomographic solution of profile 07/08. Velocity contours are annotated in kilometres per second. Only every third ray used in the inversion is shown.
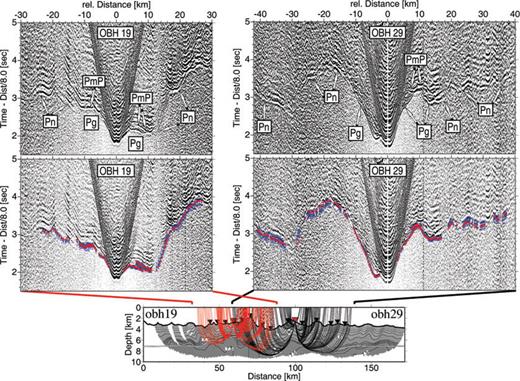
Seismic record sections (reduced with 8 km s−1) of profile 07/08 recorded by OBH19 and OBH29. See Fig. 2 for further explanations.
3.2 Tomographic inversion
For assessing velocity models we chose the tomographic method of Korenaga et al. (2000), which jointly inverts refracted and wide-angle reflected traveltimes for a 2-D velocity structure together with a floating reflector. In the forward ray tracing scheme, the method employs the graph method with additional refinements utilizing conjugate gradients in a ray bending approach.
3.2.1 Model parametrization
The velocity model is parametrized as a sheared mesh beneath the seafloor. We employed a horizontal node spacing of 250 m in the area of station coverage and 500 m at the edges of the models. Vertical node spacing linearly increases from 100 m at the seafloor to 250 m at 10 km below seafloor. A reflector is employed as an array of linear segments with a nodal spacing of 1 km. The horizontal coordinate of each segment is held constant, whereas its vertical value is updated in the inverse solution.
3.2.2 Initial model building
Initial velocity models were built by laterally expanding a 1-D velocity profile by hanging it from the seafloor. The starting models have a flat Moho reflector but variable crustal thickness due to seafloor topography. There is no velocity discontinuity at the Moho interface due to the floating reflector constraint, and consequently velocities at the Moho will be variable as 1-D models are referenced to the seafloor.
3.2.3 Inversion method
In the inverse step, smoothing and damping constraints are used to regularize the iterative inversion. The correlation length, which controls the smoothness of the tomographic solution (Korenaga et al. 2000), increases linearly from the seafloor to the model bottom from 1 to 5 km in the horizontal, and from 0.1 to 1.0 km in the vertical, respectively. We took the reflector correlation length scales from the horizontal 2-D velocity correlation lengths at the corresponding depths and employed equal weighting of the velocity and depth kernel.
For each profile, a set of smoothing weights for velocity and depth nodes is evaluated in a single-step inversion. The optimal weight, which minimizes the roughness of the tomographic output and at the same time decreases significantly the data variance, is then held fixed during further iterations (for details please refer to Planert et al. 2009). Perturbational damping was used to restrict the average perturbation of velocity nodes to less than 2 per cent and the average perturbation of reflector nodes to less than 6 per cent. To prevent outliers from dominating the data, rays with residuals of more than two standard deviations were temporarily excluded from the corresponding iteration.
3.2.4 Final model assessment
To systematically assess the influence of starting model variations and realistic pick errors on the inverse solution of profile 07/08 we performed a non-linear Monte Carlo uncertainty analysis (Korenaga et al. 2000). Within the applied approach 100 random initial models, built by 1-D velocity profiles hung from the seafloor, were inverted with data perturbed with random errors. The starting models have a flat Moho, randomly distributed between 5.7 and 8.5 km depth below seafloor. As a counterpart to the model ensemble, 100 data sets were built by adding two types of random errors to the picked traveltime data: (1) common-receiver errors, a random shift of maximum ±30 ms at all the shots to the same receiver and (2) a correlated phase-dependent error, which is caused by the traveltime picking uncertainty (Zhang & Toksöz 1998). The correlation length of (2) was chosen randomly between 5 and 15 km, resulting in a maximum amplitude of up to 50 ms, depending on the pick uncertainty of the trace (for details please refer to Planert et al. 2009). On average 11 iterations were applied for each of the 100 Monte Carlo inversions to reduce normalized χ2 to less than 1. The final velocity model and Moho was then derived from averaging all Monte Carlo solutions (Fig. 4a).

(a) Final velocity model and Moho for profile 07/08, derived from averaging all Monte Carlo solutions, and based on the inversion of 6050 refracted and 650 reflected picks (total rms = 40 ms). Black shaded areas are 90 per cent confidence intervals for Moho-depths within the applied uncertainty analysis. White Moho is directly controlled by reflection coverage. (b) Corresponding standard deviation for velocity and reflector nodes (dashed line, standard deviation is added to the corresponding reflector depth). Velocity contours are drawn at 0.05 km s−1. (c) Reflection coverage for the final velocity model. (d) Derivative weight sum for the final velocity model. Models are plotted at 5× vertical exaggeration.
An effective measure of the model uncertainty is the standard deviation of the model parameters (Fig. 4b), including both velocity and reflector nodes (Korenaga et al. 2000). Obtained values should be regarded as useful estimates of the quality of the inversion but not as absolute bounds on the possible differences between the recovered model and the underlying structure, mainly because uncertainties from Monte Carlo simulations are based upon simplified regularization assumptions. Moreover, due to averaging our velocity models do not include a velocity discontinuity at the Moho interface but a transition zone where velocity increases from lower-crustal to upper-mantle velocities. As a consequence lower-crustal and upper-mantle velocities are somewhat more suspect when constrained primarily by Pn arrivals.
4 Results
4.1 Across-axis profile 07/08
Fig. 4 shows the results obtained from the Monte Carlo uncertainty analysis. The final velocity model in Fig. 4(a) reveals an rms misfit of 38 ms for 6050 refracted picks and 56 ms for 650 reflected picks. It is characterized by strong lateral velocity heterogeneities, in particular associated with both massifs on either side of the median valley. The ICH is marked by anomalously high velocities of up to ∼5 km s−1 at the seafloor, which in case of the western and eastern flanks abruptly increase to >6 km s−1 in the uppermost kilometre. The velocities at the OCH crest are only slightly lower, starting with seafloor velocities of ∼3.7 km s−1 and reaching up to >6 km s−1 within the uppermost 1.5 km. Away from those model portions located beneath the two massifs, typical layer 3 velocities of 6.5–7.2 km s−1 are restricted to a ∼1-km-thick band, which often exhibits significant vertical velocity gradients.
In the median valley the velocities increase more gradually from ∼2.7 km s−1 at the seafloor to >7.0 km s−1 at the crust–mantle interface (Moho), which is located at ∼4 km depth. The uppermost mantle is characterized by velocities of 7.3–7.8 km s−1. Apart from beneath the inside corner massif, where velocities <7.5 km s−1 are consistently found, velocities increase with distance from the median valley in the well constrained mantle portions.
Standard deviations for velocity nodes are usually <0.2 km s−1 and in most cases drop below 0.1 km s−1 beneath the area of station coverage (Fig. 4b). Derived Moho depths are well constrained by reflection coverage between 35 and 125 km profile distance (Fig. 4c) where standard deviations of reflector nodes are usually smaller than 0.25 km. The average crustal thickness along these reflector portions is 3.4 ± 0.4 km with the thinnest portions (∼2.5 km thickness) located at ∼60 km profile distance.
Hence, the oceanic crust in the central model portions is well resolved, as is the uppermost mantle. Counter-intuitively, standard deviations do not increase with depth although model uncertainty should be higher here due to decreasing ray coverage and resolution (Fig. 4d). However, this does not take into account the lower standard deviation of the starting model ensemble and the greater impact of model regularization (correlation lengths) at greater depths (please refer to Fig. S1 for additional resolution tests with synthetic velocity and reflector anomalies).
4.2 Along-axis profiles 05, 02, 09 and 0
Fig. 5 shows the velocity models of profiles 02–05 and a section of profile 09 (Planert et al. 2009) in the bathymetric framework of the ridge axis and the adjacent inside corner. The tomographic solution for profile 09 was derived analogously to profile 07/08 by averaging 100 Monte Carlo solutions; the velocity models for the shorter profiles 02–05 are based on a single inversion approach, that is, no systematic assessment of starting model variations and traveltime errors was done. For these lines, the iterations started from a 1-D velocity model and a flat lying Moho, both obtained from the final solution of profile 07/08 sampled at the corresponding line intersection (pleaser refer to Fig. S2 for the ray coverage of the models).

View (from the east) of the along-axis seismic profiles in the bathymetric framework of the ICH area. From top panel to bottom panel: profile 04 covers the onset of the corrugated footwall (yellowish area); profile 09 (from Planert et al. 2009) covers the central portions of the OCC; profile 02 covers the rifted flank of the OCC; profile 05 covers the current median valley. Black (dashed) lines represent Moho, shaded areas are 90 per cent confidence intervals for Moho-depths within the applied uncertainty analysis. Red lines indicate seafloor projections of seismic profiles. Yellow circles denote seismic instrument locations. Coloured squares indicate dredge locations from Reston et al. (2002). Black-dashed vertical lines denote profile intersection with line 07/08. The perspective has been chosen such that velocity profiles are reproduced without distortion; the vertical exaggeration is ∼2. See text for discussion.
4.2.1 Profile 05 (median valley)
Profile 05 covers 44 km of the median valley (Fig. 5 bottom panel). The tomographic solution is based on the recordings of three stations and yields a final rms data misfit of 32 and 31 ms for a total of 570 refracted and 180 reflected arrivals, respectively. Velocities increase to 5.5–6.0 km s−1 within the uppermost 2 km and then rise somewhat more gently to 6.5–7.0 km s−1 directly above the Moho at 3.4–4.0 km depth beneath the seafloor. From the few available reflections and the often poorly constrained lower model portions it is difficult to assess the thickness variations of the crust. However, a crustal thickness of 3.4 km at the northern portions compared to 4.0 km at the southern portions suggests some crustal thinning towards the transform fault. The uppermost mantle is constrained for a small model portion between 20 and 30 km profile distance. Here, velocities up to 7.5 km s−1 are obtained a few hundred metres beneath the Moho.
4.2.2 Profile 02 (rifted ICH flank)
From north to south, profile 02 covers the eastern ICH slope and a complex area of faulted blocks associated with the southward bending of the median valley and its adjacent bounding faults. The tomographic model in Fig. 5 reveals an rms data misfit of 33 ms for 1000 refracted and 54 ms for 250 reflected arrivals recorded by a total of six stations. The obtained velocity structure of the crust suggests strong lateral heterogeneities. In the area of the ICH slope, velocities increase to 6.0 km s−1 in the uppermost few hundred metres. Farther south, seafloor velocities <3 km s−1 are consistently found and an almost linear increase results in velocities of <6 km s−1 for roughly half of the crustal thickness. Crustal thickness varies between 2.4–2.7 km at the ICH slope and 2.7–3.0 km in the southern portion of the profile. Beneath the Moho, velocities abruptly increase to 7.7–7.9 km s−1.
Compared to corresponding values of profile 07/08 at the line intersection, velocities for profile 02 are consistently higher (up to 1 km s−1 in the crustal portions) and the resolved Moho depths are ∼0.4 km shallower. Although the available data quality on profile 02 is rather moderate, which is likely related to the profile's location within an extremely tectonized regime, a tomographic artefact due to poor traveltime picks seems unlikely for the discrepancies. Possible causes include (1) 3-D topographic effects caused by the steep flank of the ICH, (2) the use of long (horizontal) correlation lengths in the tomographic inversion of profile 07/08, resulting in a suppression of locally higher velocities and (3) seismic velocity anisotropy. The first option is likely since slope angles of up to 24° suggest significant deviations of the true ray paths from the assumed vertical plane. Adopting the seafloor bathymetry extracted 500 m uphill for the 2-D tomographic modelling results in Moho depths similar to profile 07/08 and in lower velocities for the upper-model portions. However, it does not significantly affect the very high sub-Moho velocities. The use of shorter correlation lengths for profile 07/08 results in locally higher velocities beneath the eastern ICH slope, especially in the uppermost 1.5 km; it does not result in markedly higher-mantle velocities.
In conclusion, the discrepancy in mantle velocities between profile 02 and profile 07/08 at the line intersection is too large to be explained by 3-D topographic effects or tomographic artefacts. Mantle velocities of 7.8 km s−1 on profile 02 disagree with velocities of 7.5 km s−1 at depths of 4–5 km below seafloor on profile 07/08. Seismic velocity anisotropy, which is caused by a preferred orientation of cracks and fractures, could account for the velocity discrepancies, where the faster orientation is given by the strike of the ICH scarp.
4.2.3 Profile 09 (ICH crest)
The tomographic solution for profile 09 was derived analogously to profile 07/08 by averaging the 100 Monte Carlo inversions. Detailed resolution tests and a description of the model portions north of the transform are presented and discussed in detail in Planert et al. (2009). The most prominent model feature south of the transform is the pronounced Moho-bulge beneath the small subbasin located directly south of the corrugated massif, where the thickness of the oceanic crust is reduced to ∼2.5 km. Here, seismic velocities increase almost linearly from 3.5 km s−1 at the seafloor to >7.0 km s−1 at the Moho. Upper-mantle velocities can be resolved from available Pn rays and reach up to 7.8 km s−1. The crust thickens away from the bulge to ∼4.5 km at the southern model edge and ∼5 km at the transform-facing flank of the core complex. Beneath the northern portions of the corrugated footwall, velocities >6 km s−1 are found within the uppermost kilometre, followed by a sharp decrease in the velocity gradient and a more gradual velocity increase in the lower parts of the crust.
4.2.4 Profile 04 (western ICH flank)
Profile 04 covers the more gently dipping western slope of the ICH. Due to instrument failures, the tomographic solution is based on the recordings of only two stations. A total of 400 refracted and 120 reflected arrivals yield an rms data misfit of 42 and 48 ms, respectively. The recovered model structure shows velocities >6 km s−1 within the uppermost kilometre beneath the northern footwall, which subsequently decrease to the south. Virtually no turning rays in the lower portions of the crust suggest that Moho depths are only poorly constrained. However, the obtained crustal thickness ranges from 3.0 to 3.4 km.
5 Discussion
Based on the segment evolution proposed by Reston et al. (2002), our models are sampling two classes of events: an earlier phase of detachment faulting, which was associated with the formation of an OCC, followed by a phase of normal faulting, which was initiated by a change of the active spreading axis and continues until present (Reston et al. 2002; Tilmann et al. 2004). We have reconstructed the evolution of this segment, using the velocity model of profile 07/08 as a template, in closing the median valley (by horizontal motion) until the facing fault scarps match together. The restoration model in Fig. 6(a) shows a close match of velocities and Moho depths and supports strongly that both massifs were conjoint originally. We now discuss both stages and their implications for a generic model of OCC formation.

(a) Reconstruction of the OCC based on the final velocity model of profile 07/08. Lower panel shows corresponding crustal thickness with 90 per cent confidence bounds. The OCC was formed by large-scale detachment faulting at the inside corner of the (fossil) rift axis. A rifting event ∼0.75 Ma (Reston et al. 2002) resulted in the split of the massif. The red–black-dashed line marks the corrugated fault surface and its proposed continuation beneath the active ridge axis. B – fault breakaway; T – fault termination. (b) Present-day situation: velocity model (upper panel) and corresponding crustal thickness with 90 per cent confidence bounds (lower panel). The core complex is split into two massifs. Median valley normal faults (white–black-dashed lines) and earthquake hypocentres (black circles) from Tilmann et al. (2004).
5.1 Evidence for a gabbroic core of the massif
The OCC reveals an abrupt increase of crustal velocities at shallow depth, which coincides with the onset of the corrugations at the seafloor (Fig. 6a). Here, velocity depth profiles show velocities >6 km s−1 at 0.5 km beneath the surface and low vertical velocity gradients throughout the crustal section underneath (Fig. 7a). The velocity structure is consistent with the presence of gabbros beneath the corrugated fault surface and is supported by gabbros dredged at different levels at the rifted flank of the ICH (Reston et al. 2002), where almost identical velocity structures are found at shallow depths (cf. profiles and dredge locations in Figs 5 and 6b). The base of this magmatic unit marks the crust–mantle boundary, as indicated by a wealth of PmP reflections (Fig. 4c). Deep drilling into similar high-velocity bodies at Atlantis OCC, at MAR 15°45′N, and at Atlantis Bank OCC in each case recovered a thick gabbro unit (Dick et al. 2000; Kelemen et al. 2004; Blackman et al. 2006; Collins et al. 2009). We therefore argue for the OCC at 5°S that gabbros are the dominant bulk lithology at those model portions, characterized by high velocities (6–7 km s−1) at shallow depths and low internal vertical velocity gradients.

Velocity depth profiles and associated structural interpretation for the (a) OCC (high-velocity core) at 64-km-profile distance, and (b) conjugate side (palaeoridge axis) at 108-km-profile distance on profile 07/08. The grey-shaded envelope of velocity depth profiles for MAR crust aged 0–7 Ma (White et al. 1992) is shown for comparison. Black arrows indicate Moho depths with corresponding 90 per cent confidence bounds. Horizontal dashed lines indicate large-scale lithology changes in the structural interpretation. Numbers indicate percentage of serpentinization in the upper mantle based on the relations of Carlson & Miller (2003). Due to temperature effects within young oceanic lithosphere and due to the possible trade-off between the volume of gabbroic intrusions and the percentage of serpentinization in the mantle, the values represent maximum estimates. (c) Model sketch of OCC formation (across-axis section) at MAR 5°S. Upper-crustal portions are concentrated at the conjugate side. Gabbros are predominantly accreted into the footwall resulting in fairly equal crustal thicknesses for both sides.
It has been proposed that the rheological contrast between gabbros and serpentinized mantle is responsible for the localization of strain and subsequent initiation of detachment faulting along their borders (Ildefons et al. 2007). This process may imply that the along-axis shape of the magmatic intrusion at the ridge axis is imprinted as relief on the fault's surface, and later exposed at the seafloor due to footwall exhumation (Ildefons et al. 2007; Tucholke et al. 2008). This interpretation is strongly supported by our data, which reveal a direct match of the onset of corrugations and the apparent gabbro crust underneath (Fig. 6a). The presence of sheared serpentinites in the dredge from close to the exposed fault plane, but their lack in the hauls from deeper structural levels of the scarp (see Figs 5 and 6b for dredge locations) may imply that they are concentrated at the borders of the gabbroic intrusions, where they contribute to the weakening of the fault zone during detachment faulting (Cann et al. 1997; MacLeod et al. 2002; Reston et al. 2002; Escartin et al. 2003; Ildefons et al. 2007).
The continuous Moho reflector on profile 07/08 supports the presence of a magmatic crust beneath the OCC (Fig. 4c). The lateral variations of the Moho in our models as well as the weak amplitudes corresponding to this reflection in the seismic data suggest a heterogeneous boundary, defined by individual intrusive bodies with lateral dimensions only partly resolvable by seismic refraction data, rather than a sharp and uniform boundary.
5.2 Lateral variability and deeper geometry of the gabbroic core
The top of the ICH reveals well-developed corrugations (see close-up of Fig. 1), including one (at about 5°9′S), which is more pronounced (elevation change 400 m) and appears to divide the massif in two, the northern portion being considerably shallower and perhaps extending farther to the west than the southern one (Reston et al. 2002). Profile 07/08 runs close to this major corrugation on the southern portion. On this line, crustal thickness increases from <3 km close to the onset of the seafloor corrugations to ∼3.7 km beneath the crest of the massif (Fig. 6a). The final phase of detachment faulting is associated with a progressive decrease in crustal thickness to ∼3.2 km at the fault termination.
Unfortunately, there are no PmP reflections from beneath the northern portion of the massif on the along-axis profile 04, which would constrain the thickness of the northern gabbro core in the initial phase of OCC formation. However, a thickened crust in the central phase of OCC formation is found beneath the northern portion of the massif on profile 09 (Fig. 5). Here, Moho depths range from 4 km close to the transition to the southern portion of the massif to 5 km close to the transform-facing scarp. The obtained variations in crustal thickness show that, under low melt conditions during OCC formation, melt extraction and thus crustal accretion varies substantially in size with time and occurs unevenly in space along the spreading axis. The central phase of detachment faulting at 5°S was associated with periods of significant melt extraction within an overall magma-poor environment, which supports the models of Ildefons et al. (2007) and Tucholke et al. (2008).
At the northern portion of the massif, all along-axis profiles reveal high velocities beneath the corrugated surface (Fig. 5), which suggests the presence of a continuous gabbro core. At the southern portion, however, profiles 07/08 and 09 reveal an area of reduced subsurface velocities. The velocity heterogeneity could be due to basaltic intrusions in the upper part of the footwall (e.g. Kelemen et al. 2004; Tucholke et al. 2008). At Atlantis Massif, MAR 30°N, Collins et al. (2009) found velocity variations up to 1 km s−1 to occur over lateral distances of several hundred metres in the uppermost few hundred metres beneath the footwall. Their analysis suggests that the style or degree of alteration may be the dominant factor in controlling the shallow velocity structure. McCaig et al. (2007) provide a link between alteration on a detachment fault and hydrothermal fluid flow. They suggest that emplacement of gabbroic magma into the footwall of the fault is the driving mechanism for the vigorous convection of hot fluids, observed, for example, at the TAG black smokers vent field (Canales . 2007; deMartin et al. 2007). As the gabbro cools, circulation penetrates deeper, leading to alteration in the gabbro and surrounding ultramafic rocks (McCaig et al. 2007). By this view, enhanced fracturing, related to the north–south partition of the massif at 5°S, may have facilitated the deep percolation of fluids and subsequent alteration of the footwall.
5.3 Implications for a generic model of OCC formation
5.3.1 Implications for the initiation of OCC formation
A small ridge, which likely represents the breakaway of the southern part of the massif (Fig. 5 top panel), was identified by Reston et al. (2002) and is located ∼6 km west of the onset of seafloor corrugations (Fig. 6a). Between the breakaway and the corrugated fault surface, the crust on profile 07/08 is thinnest (∼2.5 km) and reveals significantly lower velocities, which increase almost linearly with depth. It is thus obvious that the fault initially exhumed low-velocity material, even if we consider a significant rotation due to footwall rollover. Assuming 45–70° dip of the active fault beneath the ridge axis at the time of detachment initiation (e.g. Toomey et al. 1988; Tilmann et al. 2004; deMartin et al. 2007), the gabbro pluton was ‘captured’ by the fault at 3–5.5 km depth. These depths could be further decreased due to roll over of the fault at shallower levels. The low velocities overlying the gabbroic portions prior to exhumation most likely represent volcanics and sheeted dikes, at least in the shallower portions (see Fig. 7c for schematic sketch). Blocks of volcanic crust and in situ pillow basalts have been observed near the breakaways of Kane OCC (Dick et al. 2008) and Dante's Domes OCC (Tucholke et al. 2001). Large horizontal velocity gradients in our tomographic velocity model, associated with the onset of the corrugated surface at the western flank of the massif (Fig. 4a), may imply that the basalt-gabbro contact has gone almost vertical as a result of rotation of the fault's footwall.
5.3.2 Implications for crust formed at the conjugate side
Crust at the conjugate side is characterized by typical layer 2 velocities and associated velocity gradients in the uppermost 1.5–2 km, which suggests the presence of a continuous basaltic upper crust (Fig. 7b). A change to a lower velocity gradient at the base of layer 2 may be interpreted as the transition to the underlying gabbro layer (Fig. 7b). The thickness of this unit is 1.7 km close to the palaeoridge axis and reaches 3 km farther east. As a consequence, crustal thickness ranges from 3 km near the fossil ridge to 4 km at the eastern model edge (Fig. 6a). Hence, our results for the conjugate side suggest the presence of a layered magmatic crust, which comprises a well-developed upper crust overlying a thin gabbroic portion, resulting in fairly equal crustal thicknesses for both sides of the ridge axis.
Seafloor spreading during OCC formation may occur largely asymmetrical (e.g. Allerton et al. 2000; Fujiwara et al. 2003; Okino et al. 2004; Dick et al. 2008; Escartin et al. 2008) and thus, in the absence of magnetic isocrons, it is impossible to distinguish between crustal portions emplaced at the conjugate side prior, during and after termination of detachment faulting, respectively. Within distances <15 km east of the fossil ridge axis, however, there seems to be no systematic change in crustal-velocity structure and thickness, which could, for example, be related to changes in the melt supply to the axial ridge, associated with the final phase of detachment faulting. A well-developed volcanic ridge is present at the fossil ridge axis (see close-up of Fig. 1). Long-lived detachment faulting and coeval magmatism is reported from a corrugated massif north of the Fifteen-Twenty FZ (MacLeod et al. 2002; Escartin et al. 2003). However, it is obvious that sustained dike injection across the fault zone would have intersected its mechanical continuity and resulted in its termination. Unfortunately, there are no reflections from the top of the footwall, which would constrain the continuation of the fault beneath the ridge axis, and in the absence of more detailed geophysical sampling, it is impossible to constrain the timing of axial volcanism.
5.3.3 Implications for the termination of OCC formation
Several authors have argued that increased melt supply will result in the abandonment of detachment faulting because heat weakens the lithosphere at the ridge axis to the point that a new fault forms which then takes up plate separation (Tucholke et al. 1998, 2008; MacLeod et al. 2002; Escartin et al. 2003; Canales et al. 2008). If melt supply increases, which could be due to natural variations in the magmatic cycle (e.g. Kuo & Forsyth 1988; Lin et al. 1990), we would expect the presence of a thickened seismic layer 3 and increased crustal thickness near the ridge axis, respectively. Support for crustal thickening related to the termination of OCC formation comes from the analysis of residual mantle bouguer gravity anomalies (RMBA) at Atlantis OCC (MAR 30°N) and Kane OCC (MAR 23.5°N; Blackman et al. 1998; Tucholke et al. 1998). However, a core complex north of the Fifteen-Twenty FZ shows an RMBA increase towards the ridge axis, which indicates that crustal thinning occurred coevally with the termination of detachment faulting (Fujiwara et al. 2003). For the conjugate side at 5°S, our results indicate a relatively constant layer 3 thickness of only ∼1.7 km for distances <15 km from the palaeospreading axis (see Section 5.3.2). Beneath the core complex, the final phase of detachment faulting is associated with a progressive decrease in crustal thickness from ∼3.7 km beneath the crest to ∼3.2 km beneath the fault termination (see Section 5.2). Canales et al. (2008) found high-velocity bodies, interpreted as magmatic intrusions, at shallow depth towards the termination of three MAR OCCs, which suggests that increased melt supply contributed to the abandonment of these detachments. At 5°S, the fault termination reveals intermediate velocities at shallow depth, related to the transition from the high-velocity core of the massif to the lower velocities beneath the axial ridge (Fig. 6a). Moreover, our results from the analysis of layer 3 thickness as well as crustal thickness across the palaeoridge axis do not support a substantial increase in the axial ridge's melt supply during the final phase of detachment faulting. Hence, the abandonment of the palaeoridge axis may imply the presence of a starving melt column.
On profile 07/08, the westward shift of the active spreading axis beneath the OCC is associated with further crustal thinning, in particular beneath the ICH scarp (Fig. 6b). The along-axis seismic profile 02, which investigates the first crust formed after the ridge jump, reveals the thinnest crust in this study (2.4–3.0 km; see Fig. 5). Moreover, there is no evidence for the presence of a magmatic centre directly south of the reconstructed OCC; thin crust beneath a series of subbasins instead indicates that this region is characterized by extremely low melt supply (see profiles 09 and 02 in Fig. 5). These observations suggest that the rifting of the massif occurred under very low melt conditions and likely was tectonically controlled.
It is unknown, whether the rifting of the core complex at 5°S was due to a regional reorganization of the segment geometry or whether this is a generic mechanism of detachment termination. A possible link between OCC formation and subsequent footwall rifting is predicted by recent numerical modelling work of Tucholke et al. (2008). Their results show that, under very low melt conditions, the thermal structure of the ridge can become highly asymmetric, resulting in the advection of heat beneath the flank of the spreading centre. In combination with increased bending stresses due to footwall rotation, the newly introduced heat constitutes the formation of weakness zones, such as secondary high-angle faults, which eventually take over plate separation. Moreover, these processes could stimulate decompression melting in the exhuming footwall and thus the secondary faults may be associated with magmatic intrusions and surface volcanism (Canales et al. 2008; Tucholke et al. 2008). At 5°S, a shallow high-velocity body, which we interpret as being of gabbroic origin, extends beneath the new rift axis (Fig. 6a) and beneath the ridge facing scarp of the western massif (Fig. 6b; see profile 02 in Fig. 5), where largely undeformed gabbros were recovered from three dredge hauls at different levels (Reston et al. 2002; see Fig. 6b for dredge locations). However, our study cannot add insight regarding the timing of the magmatic intrusion, whether it occurred during rapid exhumation and thus contributed to the ‘plutonic growth’ of the detachment fault (Dick et al. 2008; Tucholke et al. 2008), or whether it occurred in an earlier stage and at greater depth beneath the palaeoridge axis.
5.4 Post-detachment phase
The crust formed at the current spreading axis is 3.4–4.0 km thick and comprises a ∼2-km-thick seismic layer 2, indicative of a basaltic upper crust (see profile 05 in Fig. 5). The southernmost 10–20 km of profile 05 cover the flanks of an axial volcanic ridge (cf. Fig. 1), where basalts were sampled close to a volcano (Reston et al. 2002; see Fig. 5 for approximately dredge location). However, only weak shoaling of the Moho towards the transform implies not much variation in along-axis melt supply. Typical seismic layer 3 velocities on profile 05 are restricted to a 1–1.5 km thin band. These observations, as well the large axial depths (1000 m deeper compared to the palaeoridge axis), are typical for a ‘cold’ segment end (e.g. Hooft & Detrick 1995). The presence of a brittle upper mantle beneath the ridge axis is further supported by the depth distribution of earthquakes, which indicate tectonic extension along mantle-penetrating normal faults down to depths of 8 km beneath the median valley floor (Tilmann et al. 2004; see earthquake hypocentres in Fig. 6b).
Uppermost mantle velocities in this study are constrained by refracted phases to be in the range of 7.3–7.9 km s−1. Theoretically, such low velocities would be consistent with ∼20 per cent serpentinization of mantle peridotide (e.g. Carlson & Miller 2003). Alternatively, a greater volume of retained melts in the upper mantle could explain the velocities and would reduce the amount of serpentinization (cf. the ‘gabbro-pudding model’; Cannat 1993). At the ridge axis, where the large number of earthquakes implies brittle failure in the upper mantle (Tilmann et al. 2004), serpentinization is likely to be much weaker (cf. Escartin et al. 2001), as these estimates also ignore the effect of elevated temperatures of the young lithosphere. However, the very low upper-mantle velocities beneath the older portions of the OCC would argue for a more complex scenario rather than a simple thermal impact on the observed mantle velocities (Fig. 6b). The low-mantle velocities beneath the OCC may derive from deep fluid circulation and related hydrothermal alteration (e.g. Boschi et al. 2006; Canales et al. 2007; McCaig et al. 2007; Escartin et al. 2008). Circulation may be aided by the large free surfaces created by the rift and transform facing walls and by unloading due to mass wasting, and thus serpentinization is likely to be facilitated by the subsequent rifting.
6 Conclusions
The analysis of seismic wide-angle reflection and refraction data constrains the deep geometry and magmatic evolution of the OCC located at the MAR south of the 5°S ridge–transform intersection. The results suggest the following scenario:
- 1
We posit that gabbros are the dominant bulk lithology at those model portions characterized by high velocities (6–7 km s−1) at shallow depths and low internal vertical velocity gradients. This correlation is supported by gabbro samples dredged at the rifted flank of the OCC. As a consequence, major portions beneath the corrugated fault surface may comprise a gabbroic crust, which highlights an integral magmatic component during OCC formation at 5°S.
- 2
The base of the gabbroic crust beneath the OCC is defined by PmP reflections. Its thickness varies, in particular along axis, from 3 to 5 km. The thickest portions are associated with the higher-elevated northern portion of the massif. Our results demonstrate that the central phase of detachment faulting at 5°S was associated with periods of significant melt extraction within an overall magma-poor environment.
- 3
The fault breakaway is located at ∼6 km distance from the onset of corrugations and it is characterized by lower velocities and a ∼2.5-km-thick crust. Hence, the fault must have initially exhumed low-velocity material overlying the gabbroic portion. The direct match of the onset of the corrugations with the shallow high-velocity body supports the idea that the along-axis shape of the magmatic intrusion at the ridge axis is imprinted as corrugations on the fault's surface.
- 4
The conjugate side at 5°S comprises a well-developed upper-crustal portion overlying a thin seismic layer 3. The partitioning of gabbros seems to occur asymmetrically with the majority accreted into the footwall of the detachment, resulting in fairly equal crustal thicknesses for both sides of the ridge axis.
- 5
The analysis of layer 3 and crustal thickness suggests that the termination of detachment faulting was associated with a progressive decrease in melt extraction. Thus, the footwall rifting at 5°S may be an integral component of detachment termination under very low melt conditions, as predicted by recent numerical models of Tucholke et al. (2008).
Acknowledgments
We thank Wilhelm Weinrebe for the processing of the bathymetry data. R/V Meteor cruise M47–2 and subsequent data analysis was funded by the Deutsche Forschungsgemeinschaft. The GMT software package (Wessel & Smith 1998) was used in the preparation of this paper.
Supporting Information
Figure S1. Resolution test for profile 07/08 using different sets of synthetic velocity and reflector perturbations. Anomalies are imposed on the final tomographic solution shown in Fig. 4a, which also serves as the starting model for the subsequent inversion. Input anomalies and recovered anomalies after five iterations are shown in the left and right panels, respectively. (a) Shallow checkerboard comprising ±5 per cent velocity perturbation sized 15 km x 3 km. (b) Deep checkerboard comprising ±5per cent velocity perturbation sized 30 km x 6 km. (c) Reflector anomaly comprising a sinusoidal 20 km wavelength ±500 m perturbation. Obtained results demonstrate a rapid loss of resolution accompanied by higher leakage of velocity structure for velocity perturbations placed beyond the area of station coverage. However, a good recovery of velocity and reflector perturbations is proved for the central part of the model, which is covered by instrument locations. Here, even for the deeper model portions, there is no evidence for exceeding leakage of velocity structure, neither into adjacent model portions nor into reflector structure.
Figure S2. Ray coverage of the along‐axis profiles 02, 04 and 05. The derivative weight sum of profile 09 can be found in Planert et al. (2009).
Please note: Wiley‐Blackwell are not responsible for the content or functionality of any supporting materials supplied by the authors. Any queries (other than missing material) should be directed to the corresponding author for the article.
References
