


Summary
We have developed a novel absolute distance meter (ADM) for determining coseismic strain steps and analysed far-field crustal deformation caused by earthquakes. By measuring the optical resonant frequency of a 100-m-long optical cavity in relation to an accurate time standard, the absolute distance can be determined with a resolution of 2 × (10−9–10−10); absolute measurements ensure the detection of distance changes before and after an earthquake, even when encountering large seismic waves that can often hinder relative distance measurements. The proposed system, consisting of the ADM in combination with a conventional laser strainmeter (LSM), a relative distance meter having a resolution of 1 × 10⁻¹⁰ in strain, can successfully observe coseismic strain steps ranging from 1 × 10⁻¹⁰ to 3.5 × 10⁻⁸. We analysed strain steps of 10 earthquakes (M 5.8–7.4 and depths of 8–374 km) that occurred around the central part of mainland of Japan at hypocentral distances of 100–530 km from the Kamioka underground observatory. The observed strain steps were compared with expected strains calculated using a variety of fault parameters inferred from existing observations (both seismic and geodetic), assuming two typical models: a homogeneous elastic half-space (Case 1) and a spherically symmetric earth model with a modified PREM structure (Case 2). After correcting the estimated rigidity around the source region for calculating a point dislocation from a seismic moment, the observations strongly supported Case 2 rather than Case 1 for deep earthquakes (hypocentral depth >20 km). On the basis of our analyses, we concluded that the distance measurement system could detect coseismic strains with a resolution of 1 × 10⁻¹⁰ and a wide detection range of at least 3.5 × 10⁻⁸, and could also precisely determine crustal deformation far from the source region. The observation constrains dislocation theories, especially for the deep region, and may geodetically constrain fault parameters on the basis of far-field deformation even for deep and ocean earthquakes whose surface deformations are difficult to observe with conventional geodetic methods.
1 Introduction
Earthquakes are caused by fault motions in the ground, and the resultant deformation of the ground near a fault can be observed using ground positioning systems (GPS), synthetic aperture radars (SAR) and electromagnetic distance measurement (EDM) systems if the displacement to be measured is larger than the minimum resolution (∼1 mm) of the technique (e.g. Massonnet et al. 1993; Hudnut et al. 1994; Ozawa et al. 2004). At greater distances, the ground deformation can only be measured by using strainmeters (Benioff 1959). However, mechanical instruments with baselines of 10–100 m do not yield reliable measurements of strain changes associated with earthquakes because a large seismic motion induces apparent strain steps due to instrumental hysteresis and other non-linearities (Press 1965; Wideman & Major 1967; Stacey & Rynn 1970). Compact strainmeters cemented in boreholes provide coseismic measurements that are relatively consistent with dislocation models (Sacks et al. 1971; Hart et al. 1996). For long-baseline instruments, laser strainmeters function well with optical references (Vali & Bostrom 1968; Berger & Lovberg 1970; Wyatt 1988; Crescentini & Renzella 1991; Araya et al. 2002). However, in these instruments, any rapid change in fringe signals can cause a counting error that results in an apparent strain step of mλ/(2L), where m, λ and L denote the number of unknown miscounted fringes, laser wavelength and baseline length, respectively. Similar uncertainties affect frequency-locking systems such as that used by Levine & Hall (1972). Absolute distance can be determined by interferometry using a variable-frequency laser (Golubev 1993); however, this measurement needs to be intermittent to obtain the number of wavelengths in the baseline, thus making it unsuitable for continuous seismic observations.
To reduce these drawbacks, we have developed an absolute distance meter (ADM) that provides an absolute measurement of length with a resolution of 2 × (10−9−10−10) for a 100-m baseline. Conventional radio-frequency (RF) modulation techniques are limited by the uncertainty of the refractive index of air (∼10−7 in strain) and displacement resolution (∼1 μm) (Ciddor 1996; Fujima et al. 1998), resulting in a strain resolution of 10−7 to 10−8 for a 10- to 100-m baseline. Therefore, we used the RF wavelength measured with both a time standard as a reference and a 100-m-long optical cavity in high vacuum to improve the measurement resolution (Araya et al. 1999). By combining the ADM with a conventional laser strainmeter (LSM) as a relative distance meter in the same vacuum system, we observed strain steps at regions far from the source regions of the earthquakes. In this paper, we first describe the laser distance measurement system and then describe analyses of coseismic strain steps. We analysed strain steps for 10 earthquakes (M5.8–7.4) that occurred around the central part of mainland Japan at hypocentral distances of 100–530 km from the observatory.
2 System Description
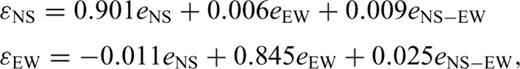
The system is located at the Kamioka mine (N36.43°, E137.31°, H= 358 m), Gifu prefecture, Japan (Fig. 1) (Takemoto et al. 2004). The site is 1000 m underground, where several scientific facilities such as neutrino detectors (Super Kamiokande and KamLAND) and a gravitational wave detector (CLIO) are installed (The Super-Kamiokande collaboration 2003; Ohashi et al. 2003; Araki et al. 2005). The ADM and LSM are installed in an L-shaped vacuum system having two 100-m-long perpendicular arms along the north–south (NS) and east–west (EW) directions (Fig. 2). Two Michelson-type laser interferometers are used for the LSM to measure the baselines and obtain the strain components ɛEW and ɛNS–ɛEW (Araya et al. 2007). A 100-m-long optical cavity used for the ADM is installed along the NS arm in the same vacuum system.
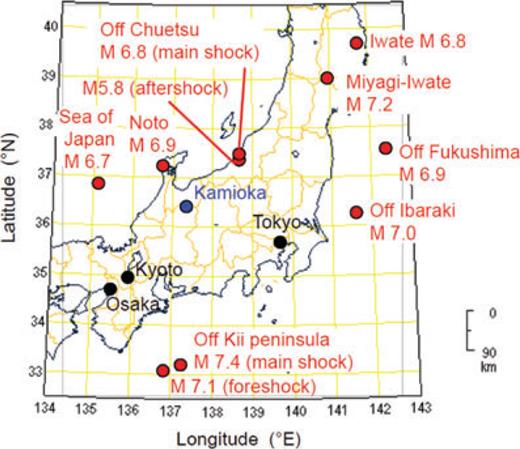
Location of the Kamioka observatory (blue circle) and epicentres of 10 analysed earthquakes (red circles) that occurred in 2004 (foreshock and main shock of Off Kii peninsula), 2007 (Noto, main shock and aftershock of Off Chuetsu, and Sea of Japan), and 2008 (Off Ibaraki, Miyagi-Iwate, Off Fukushima and Iwate). The Ms denote the earthquake magnitudes on the Japan Meteorological Agency (JMA) scale.
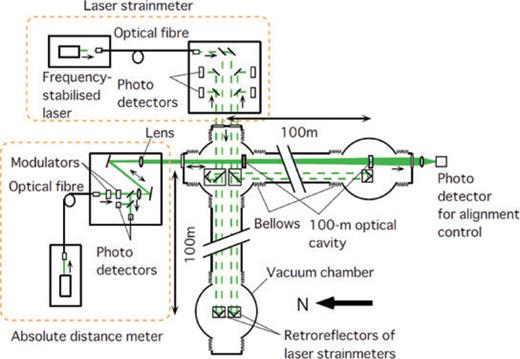
Schematic diagram of the ADM and LSM located at the Kamioka mine (1000 m below the Earth's surface). Two Michelson-type laser interferometers are used to measure two perpendicular 100-m baselines in vacuum, yielding the strain components ɛEW and ɛNS–ɛEW. An optical cavity (100 m long) is installed along the NS direction for performing absolute distance measurements.
Fig. 3 shows a block diagram of the ADM. A laser beam (λ= 532 nm) is introduced into the 100-m-long optical cavity in vacuum through an optical fibre, and the phase of the beam is modulated by electro-optic modulators (EOMs) at frequencies of 8 and 150 MHz. Beams reflected from the cavity are detected by photodetectors. A detected signal is demodulated at 8 MHz and used to control the laser carrier frequency to maintain resonance in the cavity. The other signal is demodulated at a modulation frequency of 150 MHz (νm), which is generated by a voltage-controlled crystal oscillator (VCXO); the signal is used to control the VCXO frequency to maintain the resonance of the resultant sidebands in the cavity.

Block diagram of the ADM. A laser beam (λ= 532 nm) is introduced into the 100-m-long Fabry–Perot cavity through an optical fibre and two EOMs. The first EOM modulates the phase of the laser light at 8 MHz; its demodulation signal is used to control the laser carrier frequency resonant in the optical cavity. The second EOM operates at a frequency of 150 MHz, which is generated by a VCXO. It is used to maintain the resonance of the resultant modulation sidebands in the cavity. In this situation, to determine the absolute cavity length, we need to measure only the sideband modulation frequency using a frequency counter that is locked to an accurate timebase.
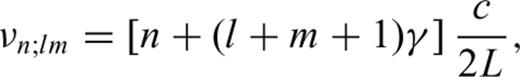
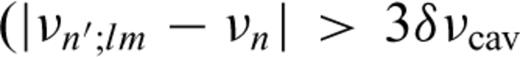 for any n, n′). Furthermore, the laser light incident on the cavity is mode-matched with lenses to reduce the off-axis resonances. Therefore, we consider only the fundamental mode (l=m= 0).
However, the sharp cavity resonance makes laser locking susceptible to external disturbances such as seismic vibrations. Although laser unlocking can be detected and locking can be automatically recovered by control circuits, the repeatability of the locking sideband frequency is much worse than its resolution. Fig. 4 shows the repeatability of the locking sideband frequency when laser relocking occurs due to disturbances during the period from 2007 February 26 to 2007 July 31, including those on days when four of the earthquakes under consideration occur. The repeatability is estimated from differences in the locking sideband frequencies before and after relocking occurs; using eq. (4), they are converted into apparent strain steps as a histogram. Real steps associated with the analysed earthquakes are removed from the histogram. The apparent strain steps in Fig. 4 can be regarded as the uncertainty in the distance measurements under the relocking process. The average and standard deviations (σ) for the 50 relocking data are −1.8 × 10⁻¹⁰ and 2.4 × 10⁻⁹, respectively. The repeatability of the ADM may be improved by applying low-offset electronics and using a higher sideband modulation frequency to enhance the frequency resolution. In summary, the resolution of the ADM is estimated to be δL/L= 2 × (10−9−10−10) for continuous locking and δL/L= 2.4 × 10⁻⁹ (1-σ estimate) for laser relocking. These resolutions are considered in the section on data analysis.
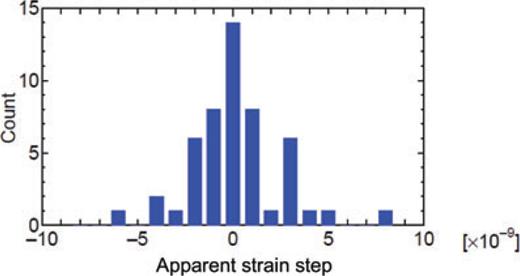
Repeatability of the locking sideband frequency of the ADM when laser relocking occurs due to disturbances during the period from 2007 February 26 to 2007 July 31, including the dates when four of the earthquakes under consideration occurred. The real steps associated with the earthquakes are removed from the histogram. The apparent strain steps shown in this figure can be regarded as the uncertainty of the distance measurements under the relocking process. The average and standard deviations for 50 relocking data are −1.8 × 10⁻¹⁰ and 2.4 × 10⁻⁹, respectively.
Finally, we evaluate the resolution of the ADM for long-term observations. To ensure stable long-term operation, the tilts of the cavity mirrors are controlled so that they are parallel to each other for optimum resonance. Because the transmitted power increases up to the maximum value only if the resonance is optimum, the transmitted power is detected and the tilts of both the cavity mirrors are controlled to maintain the transmitted power at its maximum value, as indicated by ‘Alignment control’ in Fig. 3. For stability in the optical cavity, we use dielectric multilayer coating mirrors. According to measurements of long-term drift of mirror reflectance (Fig. 7 in Ueda et al. 1996) and expressions of complex reflectance of a multilayer coating mirror [eqs. (1)–(8) in Miyoki et al. 1998], the phase change drift in the mirror coating is estimated to be less than 4.0 × 10⁻² rad per 2 weeks, which corresponds to less than 8.7 × 10⁻¹⁰ per year in effective strain. This value is significantly smaller than the typical strain change that occurs in Japan (10−8−10−7 per year; Sagiya et al. 2000). Therefore, the distance measurement system has potential not only for short-term coseismic observations but also for long-term strain observations based on a time standard, although the resolution is currently considered to be limited to relocking uncertainty (δL/L= 2.4 × 10⁻⁹).
3 Data Analysis
By combining the ADM used for measuring the NS distance (LNS) with the LSM that measures ɛNS and ɛEW, we observed strain steps associated with a number of earthquakes. As shown in Fig. 1, 10 major earthquakes occurred in 2004, 2007 and 2008 at hypocentral distances between 100 and 530 km from the observatory. Figs 5(a-1)–(d-1) show the observed seismic waves for four events that occurred in 2007, which have peak-to-peak strain amplitudes ranging from 10−7 to 10−6. To clarify the strain steps, strain data are averaged at 1-min intervals to reduce the large seismic components, and tidal components are subtracted.


Observed strain data, strain steps, and distance steps for earthquakes that occurred in 2007. The strain data from the Noto earthquake (a-1), enlarged views of the NS (a-2) and EW (a-3) components, and distance data (a-4). The green dashes in (a-2) and (a-3) indicate the inclusion of step uncertainty in fringe counting due to large ground motion. The orange dots in (a-4) indicate the occurrence of laser relocking in the ADM. The strain data for the Off Chuetsu earthquake (main shock) (b-1), averaged data for the NS (b-2) and EW (b-3) components, and distance data (b-4). (c-1)–(c-4) show the corresponding figures for the Off Chuetsu earthquake (aftershock) and (d-1)–(d-4) show those for the Sea of Japan earthquake. Because of the poor repeatability of laser relocking, (b-4) and (c-4) show steps larger than those expected from ɛNS, whereas (d-4) (without relocking) shows almost the same distance step as (d-2), associated with the Sea of Japan earthquake.
The tidal waveforms calculated using the topographic corrections are subtracted from the observed data [Figs 5(a-2)–(d-2) for ɛNS and Figs 5(a-3)–(d-3) for ɛEW]. In the ADM, modulation frequencies are obtained every 30 s and converted to absolute distances. These data are averaged at 1-min intervals, and the tidal components are removed [Figs 5(a-4)–(d-4)]. The observed peak strain amplitudes, strain steps using the LSM and distance steps using the ADM are listed in Table 1.
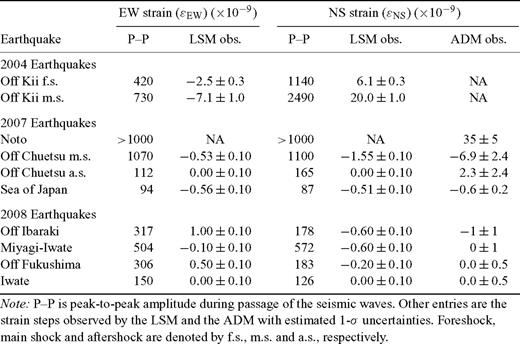
Observed strains associated with the earthquakes.
Note that the seismic waves of the Noto earthquake (2007 March 25) were of such high amplitude that fringe miscounts occurred in the LSM, which resulted in step uncertainties of mλ/(2L) [Figs 5(a-2) and (a-3), indicated by green dashes]. In addition, relockings occurred in the ADM [indicated by orange dots in Figs 5(a-4), (b-4) and (c-4)] because of seismic disturbances. In such cases, locking repeatability may have influenced the distance steps. As discussed in Section 2, the corresponding steps δL/L < ∼7 × 10⁻⁹ (= 3σ of the relocking uncertainty) should be rejected because they may be entirely due to unlocking and relocking. Therefore, we consider Fig. 5(a-4) to show a real step of 3.5 × 10⁻⁸, but with a relocking error that could be as large as 2.4 × 10⁻⁹, or 7 per cent in 1-σ estimate. Fig. 5(d-4) is obtained without relocking, and its step agrees well with that of the LSM in Fig. 5(d-2).
Because the resolution of the LSM (1 × 10⁻¹⁰ and 5 per cent of amplitude) is generally better than that of the ADM [δL/L= 2 × (10−9–10−10)] mainly because of the reference wavelength, the strain steps we analyse, except those for the Noto event, are taken from the LSM. In 2007, the ADM operated at almost its design resolution (δL/L= 2 × 10⁻¹⁰) for continuous operation, but the resolution declined [(0.5–1.0) × 10−9] in 2008, mainly because of secular degradation of the laser. Fig. 6 is an equivalent of Fig. 5, but for events that occurred in 2008. Because the coseismic distance steps for the 2008 events are below the ADM resolution limit, only the LSM strain step data are shown in Fig. 6(a-1)–(d-1) for ɛNS and Fig. 6(a-2)–(d-2) for ɛEW.
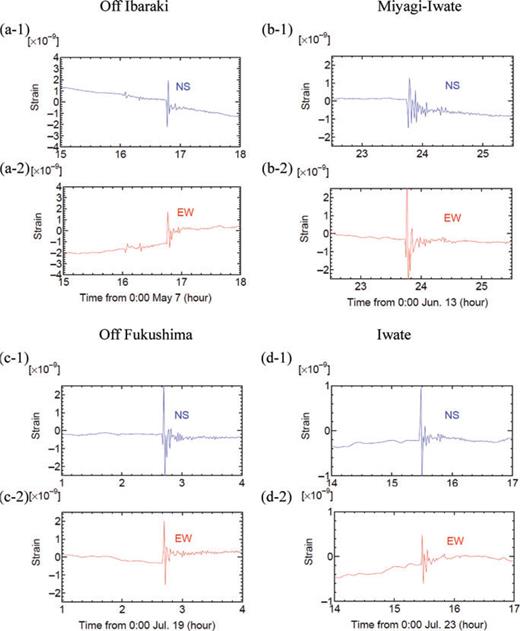
Observed strain steps for earthquakes in 2008. The averaged strain data of the Off Ibaraki earthquake for the NS (a-1) and EW (a-2) components. (b-1) and (b-2) show the corresponding figures for the Miyagi-Iwate earthquake; (c-1) and (c-2) show those for the Off Fukushima earthquake; (d-1) and (d-2) show those for the Iwate earthquake. Because of resolution degradation in the ADM, the coseismic distance steps for the 2008 events are below the resolution.
4 Results and Discussion
Before installation of the ADM, two major earthquakes occurred off the Kii Peninsula on 2004 September 5: a foreshock of M7.1 at 10:07 hr and the main shock of M7.4 at 14:57 hr. The strain steps were recorded using the LSM (Araya et al. 2007). The observed peak strain amplitudes and strain steps are listed in Table 1. We compared the observed strain steps of all 10 earthquakes (two in 2004 and eight in 2007–2008) with the expected values calculated from the inferred fault parameters. Tables A1 and A2 in Appendix list the inferred fault parameters released by several institutes and the expected strain steps in Kamioka for the fault models. The fault parameters in Table A1 were obtained from seismic wave analyses (e.g. Dziewonski et al. 1981) known as the centroid moment tensor (CMT) solution, and were released by the Japan Meteorological Agency (JMA), United States Geological Survey (USGS) and Global CMT project (GCMT). The fault parameters listed in Table A2 were determined geodetically by the Geographical Survey Institute of Japan (GSI), mainly from GPS observations.
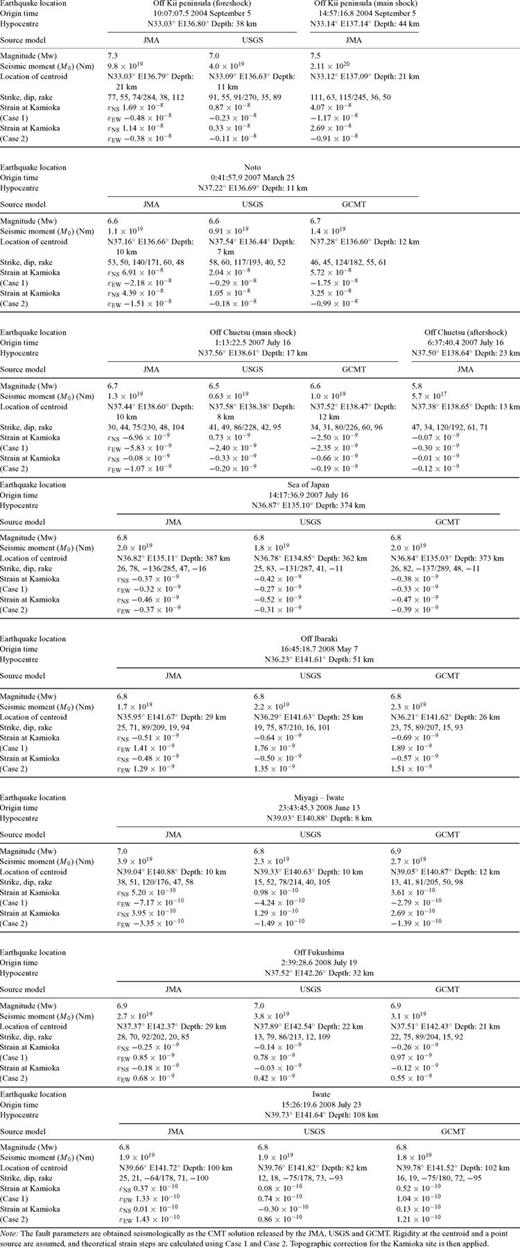
Inferred fault parameters and expected strain steps in Kamioka for seismologically inferred fault models.
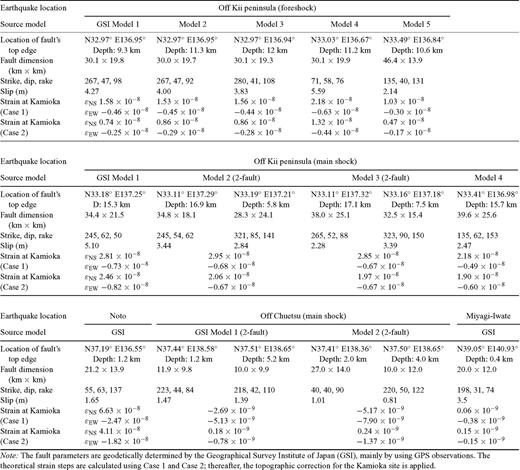
Inferred fault parameters and expected strain steps in Kamioka for geodetically inferred fault models.
 , where Δσ denotes a typical stress drop (6 × 10⁶ Pa) (Kanamori & Anderson 1975). The velocity structure in the source regions is taken from Matsubara et al. (2008), and the modified PREM shown later is assumed for the density structure. The values of μ range about three times over the depth to be analysed and must be used for the correction. Rigidities at the centroid are used to calculate the fault slips for the CMT solutions shown in Table A1.
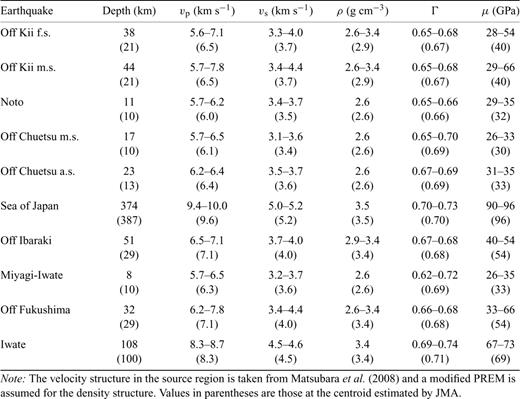
Hypocentral depth (depth) and estimated physical properties around the source region, defined as a sphere with its centre at the location of the centroid and a diameter of  where Δσ denotes a typical stress drop (6 × 10⁶ Pa).
The expected strain steps in Kamioka were calculated according to two typical models: a deformation theory of a half-space homogeneous medium (Okada 1992) for Case 1 and a spherically symmetric earth model (Sun 2004) for Case 2. The topographic correction in eq. (7) was then applied.
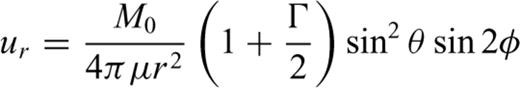
Fig. 7 shows the observed (in red, based on Table 1) and calculated (in blue based on geodetic results in Table A2, and in fault-model-dependent colours based on seismological results in Table A1) strain steps associated with the earthquakes. Because the proposed system measures only two of the three horizontal strain components, components ɛEW and ɛNS are simply plotted in the x–y plane. For the Noto earthquake, the red region indicates the NS component of the strain step inferred from the ADM data with measurement uncertainty [Fig. 7(c)]. Red circles indicate the measurement uncertainties for the other earthquakes. Triangles (indicating Case 1) are calculated using MICAP-G software, which gives deformation in a homogeneous elastic half-space medium of λ=μ. Solid circles (indicating Case 2) are calculated using a spherically symmetric earth model with the PREM structure (Dziewonski & Anderson 1981) but modified to have a solid outermost layer to enable analyses for continental shallow seismic sources.


Observed (in red, based on Table 1) and calculated (based on Tables A1 and A2) strain steps associated with the earthquakes. Two strain components (ɛEW and ɛNS) are plotted on the x–y plane. For the Noto earthquake (c), the red region indicates the NS component of the strain step inferred from the ADM data, with measurement uncertainty. For the other earthquakes, the red circles indicate the measurement uncertainties. The triangles represent calculations of Case 1, and the solid circles indicate those of Case 2. Hypocentral depth is shown in each figure.
Comparing the observations with the calculations, the observations appear to be confined within the uncertainty range of the calculations, except for two surface events: the Off Chuetsu main shock at a depth of 8 km and Miyagi-Iwate at a depth of 17 km. The difference in calculations for Case 1 and Case 2 arises mainly from the assumed structure (homogeneous and modified PREM) rather than the geometry (half-space and spherical). For these two surface events, the observations appear to lie outside the uncertainty range of the calculations. Although we have not found the reason for this discrepancy, it is possible that large uncertainties in both the fault parameters and structure for shallow events such as these may affect the calculated strains.
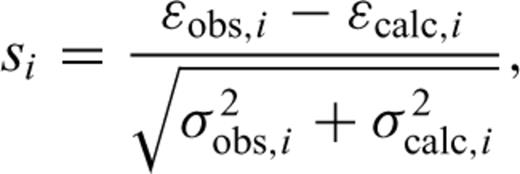
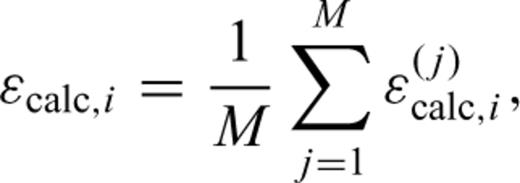
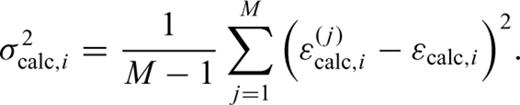
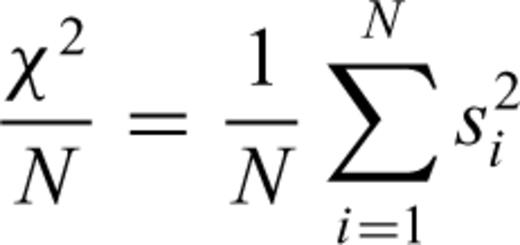
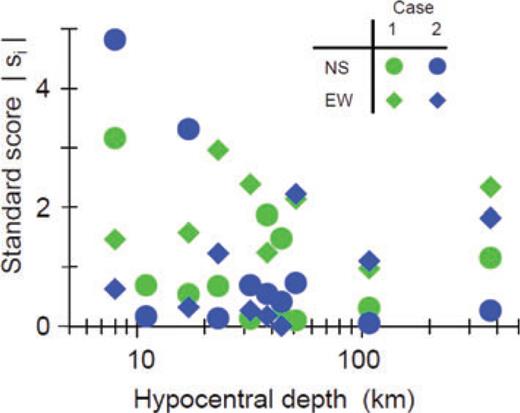
Absolute standard scores (|si |) of observations and calculations as a function of hypocentral depth. For deep events (depth > 20 km), 42.9 per cent of all the scores for Case 1 and 71.4 per cent of all the scores for Case 2 agree with the observations and the calculations (|si | < 1). Normalized χ2-values (number of data =N) defined by  are 2.47 (Case 1) and 0.90 (Case 2) for the deep events (N= 14).
It should be noted that in most strain data, the uncertainties of the observed strains are smaller than those of the calculation (σ2obs,i < σ2calc,i). Therefore, on the basis of coseismic strain observations with resolutions of 1 × 10⁻¹⁰, geodetic constraints on the fault parameters, such as M0/μ, may be posed, even for deep or ocean earthquakes where the surface displacement has been difficult to observe with conventional geodetic method (e.g. GPS and SAR).
5 Conclusions
We constructed a 100-m-long observation system based on laser distance measurement, which can detect strain steps at resolutions of δL/L= 2 × (10−9–10−10) for the ADM and δL/L= 1 × 10⁻¹⁰ for the LSM. This system enables crustal deformation to be measured at locations far from the source region. Although the repeatability requires improvement, we used the ADM to observe strain steps of 3.5 × 10⁻⁸ and 6 × 10⁻¹⁰ associated with two earthquakes (Noto and Sea of Japan, respectively). Using the total system with the LSM, we successfully observed a wide range of reliable coseismic strain steps, with amplitudes ranging from 1 × 10⁻¹⁰ to 3.5 × 10⁻⁸.
For 10 earthquakes that occurred in 2004, 2007 and 2008, we compared the observed strain steps with the calculated strain steps using two typical models: Case 1 (homogeneous half-space) and Case 2 (spherically symmetric Earth with a modified PREM structure). We adopted various seismologically and geodetically determined fault parameters for each earthquake. After correcting the estimated rigidity around the source region for calculation of a point dislocation from a seismic moment, the observations generally fell within the range of the calculations. For earthquakes deeper than 20 km, we found that the observations strongly support Case 2 rather than Case 1. Judging from small uncertainties in the observed strains, precise strain observations may constrain the fault parameters on the basis of far-field geodetic observations, even for deep and ocean earthquakes whose surface displacement has been difficult to observe with conventional geodetic methods.
Acknowledgments
For the calculation of theoretical strain steps, we used an elastic deformation analysis program, MICAP-G (C), released by the Meteorological Research Institute, Japan. We appreciate valuable discussions and a program for strain calculation arranged by Prof. Wenke Sun of the Earthquake Research Institute, University of Tokyo. We would like to thank two anonymous reviewers and Editor John Beavan for useful comments and suggestions. This study was partially supported by a Grant-in-Aid for Scientific Research (A) (18204039), Japan Society for Promotion of Sciences, by the Earthquake Research Institute Cooperative Research Program (2006-B-04) and by the Disaster Prevention Research Institute Cooperative Research Program (16G-01).
References
Appendix
Appendix: Fault Parameters and Expected Strain Steps
Tables A1 and A2 show fault parameters and expected strain steps at the Kamioka observatory. Table A1 includes fault parameters determined by seismological observation, whereas Table A2 shows those determined by geodetic observation, mainly from GPS.
