


Summary
Oceanic core complexes (OCCs) provide access to intrusive and ultramafic sections of young lithosphere and their structure and evolution contain clues about how the balance between magmatism and faulting controls the style of rifting that may dominate in a portion of a spreading centre for Myr timescales. Initial models of the development of OCCs depended strongly on insights available from continental core complexes and from seafloor mapping. While these frameworks have been useful in guiding a broader scope of studies and determining the extent of OCC formation along slow spreading ridges, as we summarize herein, results from the past decade highlight the need to reassess the hypothesis that reduced magma supply is a driver of long-lived detachment faulting. The aim of this paper is to review the available geophysical constraints on OCC structure and to look at what aspects of current models are constrained or required by the data. We consider sonar data (morphology and backscatter), gravity, magnetics, borehole geophysics and seismic reflection. Additional emphasis is placed on seismic velocity results (refraction) since this is where deviations from normal crustal accretion should be most readily quantified. However, as with gravity and magnetic studies at OCCs, ambiguities are inherent in seismic interpretation, including within some processing/analysis steps. We briefly discuss some of these issues for each data type. Progress in understanding the shallow structure of OCCs (within ∼1 km of the seafloor) is considerable. Firm constraints on deeper structure, particularly characterization of the transition from dominantly mafic rock (and/or altered ultramafic rock) to dominantly fresh mantle peridotite, are not currently in hand. There is limited information on the structure and composition of the conjugate lithosphere accreted to the opposite plate while an OCC forms, commonly on the inside corner of a ridge-offset intersection. These gaps preclude full testing of current models. However, with the data in hand there are systematic patterns in OCC structure, such as the 1–2 Myr duration of this rifting style within a given ridge segment, the height of the domal cores with respect to surrounding seafloor, the correspondence of gravity highs with OCCs, and the persistence of corrugations that mark relative (palaeo) slip along the exposed detachment capping the domal cores. This compilation of geophysical results at OCCs should be useful to investigators new to the topic but we also target advanced researchers in our presentation and synthesis of findings to date.
1 Introduction
Oceanic core complexes (OCCs) expose intrusive crust and lenses of upper mantle at the seafloor. Deep drilling results from three sites suggest that the footwall to the detachment fault that exposes corrugated, domal cores of fully developed OCCs is relatively intact, not pervasively deformed. Thus, documenting the geophysical structure of the domal cores provides an opportunity to understand the properties of a portion of the oceanic crust whose signature is usually partially overprinted by signals imparted by 1–2 km thick, variably fractured/porous upper crustal rocks that overly the intrusive section. Beyond the local structure within the domal core, regional (10–100 km, laterally) geophysical mapping can also illuminate the scales of lithospheric variability associated with OCCs, from which inferences about the balance between tectonic and magmatic processes at spreading centres can be inferred for time periods on the order of a few million years.
Recognition that detachment faulting plays a role in the rifting and evolution of new oceanic crust arose in the 1980s (Dick et al. 1981) and concepts were developed in the early 1990s on the basis of geological mapping, sampling and gravity studies (Karson 1990; Dick et al. 1991; Tucholke & Lin 1994) and multichannel seismic profiles showing crustal faults (Mutter & Karson 1992). Bathymetry and acoustic backscatter data obtained at the Mid-Atlantic Ridge 30°N (Cann et al. 1997) provided the first detailed view of each of the main morphologic components of an OCC: shallow, domal footwall block(s) whose corrugated, striated top surface coincides with an exposed, inactive detachment fault; juxtaposed volcanic block(s) inferred to be hanging wall or rider block(s), to the detachment (Fig. 1).
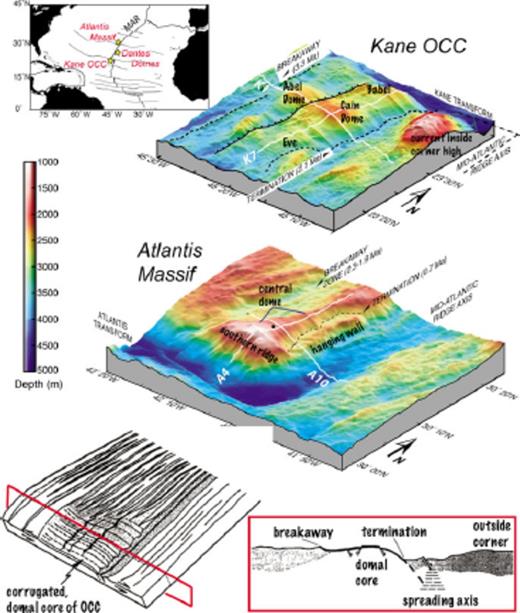
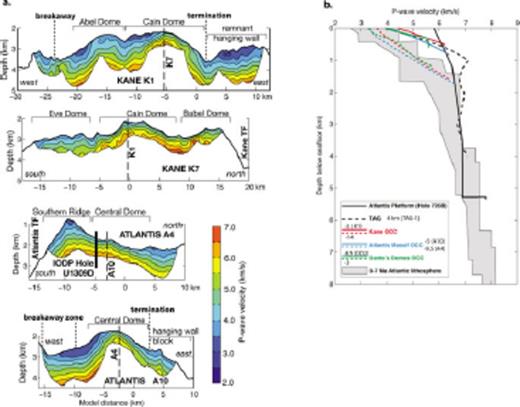
Examples of oceanic core complexes (OCC) on the flanks of the Mid-Atlantic Ridge (MAR). Perspective views of colour-shaded seafloor morphology show structural components of OCC: shallow, corrugated domal cores that vary in depth along strike; termination of exposed detachment fault; adjacent hanging wall blocks; interpreted breakaway zone. White lines indicate selected MCS profiles. Seafloor perspectives modified from Canales et al. (2004); models modified from Tucholke et al. (1998).
Other OCCs in the Atlantic were recognized at this time (Tucholke et al. 1998) and many were discovered over the next decade, due both to the strength of initial conceptual model (researchers knew the settings where they were likely to be found) and the relatively straightforward nature of the processing/visualization technique that allowed Cann et al. (1997) to document three OCCs in the MAR 30°N area where several investigators had previously worked without recognizing these features (Lin et al. 1990; Purdy et al. 1990; Pariso et al. 1995, 1996; Zervas et al. 1995). The availability of Generic Mapping Tools (GMT, Wessel & Smith 1998) and other visualization programs has also been a factor in the rapid morphological identification of OCCs over the past decade. Areas along a ridge-transform plate boundary where swath coverage was fairly complete were processed into grids of seafloor depths with binned values represented by an average or median every 100–200 m; the grids were displayed as colour, shaded relief maps, with illumination at an angle that enhanced visibility of the spreading-parallel, 10's-m amplitude corrugations on the shallow, domal cores (Fig. 1).
Models of why and how OCCs form, and also when and where they do, are still evolving (Ildefonse et al. 2007; Smith et al. 2008; Tucholke et al. 2008). The aims of this review are to compile geophysical observations from the past decade, to highlight systematic features/patterns in the data, to assess inherent limitations on subsurface resolution, and finally, to discuss the implications of the current results in terms of processes involved in formation of slow-spread oceanic lithosphere.
1.1 The basic geological model of OCCs
The main aspects of geological models of OCC formation (Karson 1990; Tucholke & Lin 1994; Cann et al. 1997; Tucholke et al. 1998) that are summarized in this section provide a framework in which to understand how geophysical constraints can be brought to bear on the problem. These evolving models have influenced the scope and aims of many of the existing geophysical studies and have in turn been influenced by the geophysical results.
OCCs form during episodes of rifting when a (system of) long-lived normal faults expose intrusive (diabase, gabbro) and/or ultramafic (peridotite, serpentinite produced through reaction with sea water) rocks at the seafloor. Relative slip between these footwall rocks and the overlying blocks occurs parallel to the plate spreading direction. A ridge-parallel ‘breakaway’ zone marks where the fault initiated and, with continued slip, more of the detachment becomes exposed at the seafloor over time, extending toward the spreading axis from the breakaway, and occasionally obscured by hanging wall blocks or klippe. The spreading-parallel corrugations and striations exposed on the domal cores, or megamullion (Tucholke et al. 1998), of fully developed OCCs (Figs 2 and 3) mark the relative slip between footwall and hanging wall blocks. The width of these large exposed surfaces in the end-member OCCs suggests that the detachment can be a main locus of plate spreading for periods of 1–2 Myr (Tucholke et al. 1998; Okino et al. 2004). The side of the exposed detachment nearest the spreading axis is called the termination, where the fault is inferred to dip and stay below the seafloor for the rest of its length (Fig. 1). The footwall block is envisioned to rotate as unroofing proceeds, significantly if the active fault is steeply dipping, rather than slipping at low angle (e.g. Wernicke & Axen 1988). Most models suggest the hanging wall block(s) will also rotate somewhat from their original orientation, in domino fashion if several adjacent blocks occur.
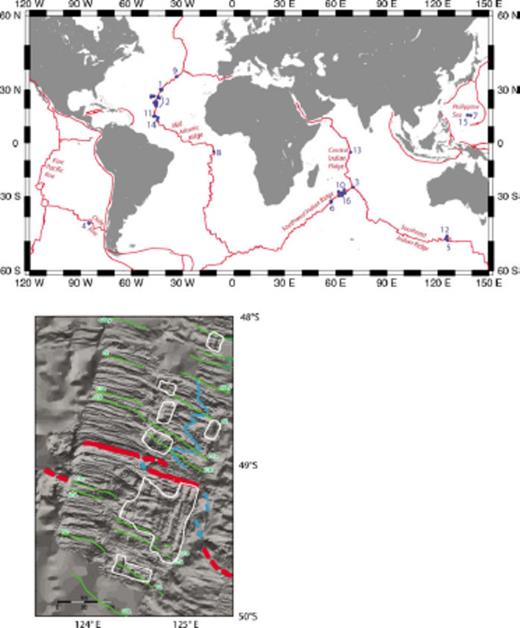
(Top panel) Location of known OCCs (blue dot) illustrates their predominant occurrence on slow-spreading Atlantic and Southwest Indian Ridge flanks. Numbers are keyed to OCC study and reference as listed in Table 1. Occurrence on intermediate-spread crust is indicated on the Chile Rise, the SEIR, and in the Philippine Sea. (Bottom panel) Illuminated seafloor morphology shows concentration of OCC within part of the AAD (corrugated seafloor enclosed by white line) and contrast with more typical lineated abyssal hill morphology (from Okino et al. 2004). Red line shows spreading axis; blue line marks (palaeo)offsets in the axis; green lines show magnetic anomalies.
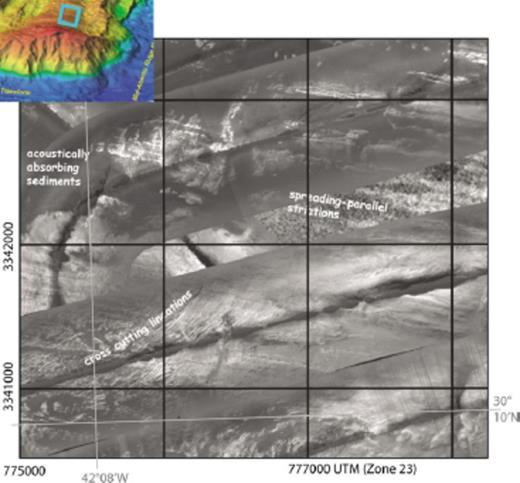
Striations imaged with sidescan sonar backscatter are shown for a portion of the central dome at Atlantis Massif, location shown by blue box on inset. DSL120 tracklines angle across this area and a small portion of underlying TOBI data (where striations are labelled) illustrates the difference in resolution, 2-m pixel versus 10-m pixel size, respectively, of these systems. Dark indicates low backscatter; white indicates high backscatter. Grid marks 1-km subareas aligned in the UTM reference frame.
The term OCC, initially used by Karson & Lawrence (1997) to depict gabbroic and ultramafic rock exposed via crustal detachment, was more broadly defined by Blackman et al. (2002) to include all structural blocks between the breakaway and the edge of adjacent hanging wall blocks that occur to the spreading centre side of the termination. Thus, OCCs comprise detachment fault(s) and various related lithospheric blocks whose composition may vary from extrusive basalt, typically capping hanging walls to the detachment, to gabbro and mantle peridiotite, exposed in domal core(s), which are footwall to long-lived detachments.
The main tectonic activity associated with development of OCCs appears to occur within the axial zone (broadly defined, to include the rift valley wall, up to ∼15 km from the rift axis (Cann et al. 1997; Smith et al. 2008); segment ends are often the site of OCC formation and in this setting the domal highs are usually unroofed on the ‘inside corner’ plate (Tucholke & Lin 1994). OCCs can also develop in other parts of a segment (Smith et al. 2006) and this suggests that the balance of magmatic and tectonic stresses ultimately determines when rifting enters this mode (e.g. Buck et al. 2005) with plate boundary geometry likely playing a role in the structural evolution but not controlling initiation. A factor in the preferential development of OCCs on the inside corner may be a greater decoupling from the adjacent plate along the plate boundary (spreading axis plus transform fault), allowing it to flex more than the outside corner which is coupled across the (inactive) fracture zone to older lithosphere (Severinghaus & Macdonald 1988). Differences in viscous stress associated with the offset in asthenospheric upwelling near an Ridge-Transform Intersection RTI may also contribute to inside/outside corner asymmetries (Bercovici et al. 1992; Blackman 1997). van Wijk & Blackman (2005) employ a coupled lithosphere/asthenosphere thermal/deformation model to confirm such RTI results and they also find that non-transform offsets, while likely to develop a slight asymmetry in crustal accretion, would not develop significant strength differences between inside and outside corner lithosphere if magma supply all along the axis is sustained (i.e. the axial zone stays weak); along-strike variations in magma supply (axial strength) within non-transform offset segments is likely important.
Morphologic evolution of OCCs continues at a slower rate as they are encased within the cooling lithosphere on the ridge flanks. With time, shallow chemical alteration and mechanical weathering become more important than tectonic processes. The domal cores of OCCs are 1–2 km shallower than the average seafloor depths in the surrounding area, regardless of the age of the crust on which they are found today. The mechanism and rate of relative uplift of the footwall and the angle at which the hanging wall slips when the fault is active continue to be debated.
Ocean drilling has penetrated 200, 1415 and 1500 m into the domal core of OCCs at the MAR 15°45′N (Kelemen et al. 2004), Atlantis Massif at 30°N on the MAR (Blackman et al. 2006) and Atlantis Bank on the Southwest Indian Ridge (SWIR; Natland & Dick 2002), respectively. In each case a dominantly gabbroic sequence was recovered. Seafloor mapping and sampling at these and other OCCs typically recovers intrusive rocks with a 70:30 ratio of serpentinized peridotite to gabbro, and variable amounts of basalt (Cannat et al. 1997; Blackman et al. 2002; Escartín et al. 2003; Coogan et al. 2004; Boschi et al. 2006; Dick et al. 2008). Whether the proportion of rock types observed on the seafloor represents the underlying crustal distribution is unknown; intrusion of serpentine along thin, faults zones that are now exposed, for example, could bias the ratio. The detailed distribution of the rock types sampled at the seafloor varies between OCCs and with local structure, but in each case where deep drilling has been performed, there is a major contrast between the seafloor ratio of ultramafic to mafic rock and the percentage of gabbro recovered from the upper part of the domal cores which exceeds 95 per cent.
A main goal of geophysical investigations of OCCs is to quantitatively describe the subsurface structure and to document the scale of variability in subsurface properties. The intent is to use these observations to constrain models of lithospheric evolution in regions where the more typical formation of volcanic seafloor with lineated abyssal hill morphology is punctuated by the creation of OCCs over 1–2 Myr periods. The fact that OCCs have not been observed on the flanks of any fast spreading ridges, and are only occasionally found on the flanks of intermediate-rate spreading centres, suggests that mechanisms related to the interplay between magmatism and tectonism in the axial zone are crucial.
1.2 The geographic scope of OCCs observations to date
Most of the known OCCs occur on slow or ultraslow spreading ridge flanks. Exceptions are the Godzilla OCC in the Philippine Sea and the Australia-Antarctic Discordance (AAD) OCCs, which formed at intermediate spreading rates. The spatial extent of the latter's corrugated domes is generally greater than their slow-spread counterparts, although the time frame of formation may be similar (1–2 Myr, Tucholke et al. 1998; Okino et al. 2004). The following synopsis of OCCs in different ocean basins illustrates the extent of their occurrence as well as the pace of their discovery over the past decade (Fig. 2, Table 1); more detail on individual sites is contained within subsequent sections.
Studies identifying corrugated domes of oceanic core complexes.
1.2.1 Atlantic Ocean
Of the three OCCs initially reported to occur along the Atlantis fracture zone ∼30°N (Cann et al. 1997), the youngest one, Atlantis Massif 0.5–2 Ma, has been extensively mapped (Blackman et al. 2002; Karson et al. 2006) and drilled (Blackman et al. 2006). Tucholke et al. (1998) documented 14 domal cores of OCCs, coining the term megmullion for them, along the flanks of the MAR between 20°N and 27°N. Several of these were later investigated in more detail, including Dante's Dome (∼26°40′N, Tucholke et al. 2001) and a series of domal highs south of Kane fracture zone (Dick et al. 2008). Reston et al. (2002) documented an OCC at 5°S on the MAR whose domal core was split after formation by a ridge jump. At 15°45′N MAR, MacLeod et al. (2002) obtained the first confirmation that the corrugated surface of a domal high, previously interpreted as an OCC by Escartin & Cannat (1999), was indeed a fault zone; they imaged slickenlines on the exposed fault surface. Saldanha Massif occurs at a non-transform offset of the MAR at 36°34′N and its gentle dome exposes serpentinized mantle peridotite, inferred to result from detachment faulting (Miranda et al. 2002). The Trans-Atlantic Geotraverse (TAG, ∼26°N) segment of the MAR axis shows geological and geophysical indications of active detachment faulting and incipient OCC formation (Zonenshain et al. 1989; Tivey et al. 2003; deMartin et al. 2007). Most recently, Smith et al. (2006, 2008) suggest that detachment faulting may be a rather common mode of rifting along some sections of slow-spreading ridges and they describe evidence for many detachments and some fully developed OCCs on the young flanks of the MAR between 13°N and 15°N.
1.2.2 Indian Ocean
The OCC comprising Atlantis Bank on the SWIR (∼57°E) was drilled (Dick et al. 1991; Dick & others 2000) and mapped (Matsumoto et al. 2002). FUJI Dome on the SWIR 64°E was characterized by Searle et al. (2003). Cannat et al. (2006) show that corrugated domal highs make up ∼4 per cent of the lithosphere formed in the past 26 Myr in the 61°−67°E section of the SWIR. OCCs on the Central Indian Ridge have been reported at 25°15′S (Mitchell et al. 1998) and at ∼5°S (Drolia & DeMets 2005). Christie et al. (1998) identified a megamullion at 126°E within the Australian Antarctic Discordance, on the Southeast Indian Ridge (SEIR) and Okino et al. (2004) described the chaotic terrain of this area in more detail, including the occurrence of several domal cores.
1.2.3 Philippine Sea
The Parece Vela backarc basin in the Philippine Sea hosts the largest OCC found to date (Ohara et al. 2001). Godzilla Mullion extends for ∼125 km from breakaway to termination, indicating continuous detachment faulting from ∼2.8 to 3.6 Myr [assuming a half-spreading rate of 4.4–3.5 cm yr−1 and spreading focused completely at this fault (Ohara et al. 2003)]. To the west of Godzilla Mullion, the seafloor of the Parece Vela Basin is characterized by a ‘Chaotic Terrain’ consisting of isolated, elevated blocks that display spreading-parallel corrugations, suggesting they are OCCs (Ohara et al. 2001; Ohara et al. 2007a). This Chaotic Terrain has many morphological similarities to other areas where OCCs are abundant, like the corrugated seafloor found off the SWIR (Cannat et al. 2006) and the MAR near 13°N (Smith et al. 2006, 2008).
1.2.4 Pacific Ocean
Corrugated seafloor was mapped in one area on the flank of the intermediate spreading rate Chile Rise (Martinez et al. 1998). These authors inferred the feature to indicate a portion of an OCC.
The available geophysical data differs between the known OCC sites. Representative data of each type is described for various locations under each of the subheadings in Section 2.
2 Geophysical Signatures of Occs
2.1 Morphology and reflectivity of the seafloor
Sonar mapping of OCCs has been accomplished by ships using hull-mounted or deeply towed systems, which obtain swaths of data via beam-forming an acoustic signal of essentially a single frequency. A 12 kHz signal is commonly used in hull-mounted systems, for which the acoustic footprint of each beam is on the order of 100 m at seafloor depths typical of young oceanic crust. Deeply towed systems operate at higher frequency, for example, TOBI at 32 kHz and DSL120 at 120 kHz. Moreover, their proximity to the seafloor decreases the beam spread, thus resolutions are of the order of a few to several metres. Variations in depth (traveltime) across the swath and character of the seafloor (amplitude and spatial pattern of backscatter) are recorded as the ship proceeds along track. Steep basement scarps facing the transmitter produce high-amplitude returns but can be difficult to discern from talus slopes. Acoustic ‘shadows’ indicate either a lack of return, due to blockage of a section of seafloor by high-relief features, or the presence of unconsolidated sediments, which absorb considerable acoustic energy. Lithified sediments on low-sloping seafloor, on the other hand, can have moderate backscatter. Volcanic seafloor is recognizable as characteristic hummocky mounds (Smith & Cann 1992) and/or the presence of circular eruptive cones with associated shadow. Fresh deposits are strongly reflective whereas weathered/sedimented volcanics are less so. Sonar delineation of OCC tectonic blocks is achieved through combined analysis of slope/roughness variation and its correlation with seafloor type, as inferred from backscatter pattern. The boundaries between units can be sharp and clear but it is not uncommon for the detailed contact location to be uncertain due to local sediment cover and/or ambiguous morphologic interpretation.
Shallow, domal morphology and corrugated, acoustically striated seafloor are major signatures of a key structural component of fully developed OCCs, as mentioned above and discussed further in this section. Sonar and acoustic backscatter data also provide limits on the tectonic processes that operate during OCC formation. The height of the domal core is a measure of the balance of isostatic and dynamic forces responsible for footwall uplift relative to neighbouring older lithosphere that is outboard of the OCC as well as to any hanging wall blocks. Tilt/slope of the palaeotop of structural blocks guide inferences about the amount of rotation during displacement. The spreading-parallel extent of the corrugated surface documents the minimum distance of relative slip between footwall and immediately adjacent hanging wall. The ridge-parallel extent of the corrugated surface documents the minimum scale of structure(s) along which conditions favourable to detachment slip existed.
The acquisition of essentially full-coverage bathymetry and coincident acoustic backscatter data, covering multiple spreading segments from the axis out to 10–30 Ma crust was a crucial step leading toward recognition of OCCs and their episodic formation within slow-spread oceanic lithosphere. Acquiring these swath data along tracks that optimized insonification of features that are parallel (or perpendicular) to the spreading direction aided recognition of OCC characteristics (Cann et al. 1997). Tucholke et al. (1997) showed that, while lineated abyssal hill morphology was typical on the western flank of the MAR ∼25°−27°N, domal highs were common in crust formed at (palaeo) ridge offsets. The domal highs, with their 10–20 km extent, relative smoothness of the capping seafloor, and 1–2 km of relief, were recognized by Tucholke et al. (1997) as being similar to the ‘turtleback’ morphology observed at some metamorphic core complexes in the Basin and Range. The MAR 30°N survey (Cann et al. 1997) used the EM12S-120 Simrad system and the TOBI sidescan system (towed vehicle 500 m above seafloor) to map the ridge-transform-ridge boundary and flanks out to ∼9 Myr. The greater resolution of these systems, compared to the Hydrosweep and MR1 sidescan (towed vehicle 100 m below sea surface) employed by Tucholke et al. (1997) was important for confidently identifying spreading-parallel, multikilometres long corrugations and the smaller (both wavelength and extent) acoustic striae on the three domal highs in the MAR 30°N region (Fig. 3). The wavelength and amplitude of the corrugations can reach a few kilometres and a few hundred metres, respectively (Tucholke et al. 1998) but are often smaller.
The corrugations and striations constitute a slip surface roughness that characterizes the detachment for a sustained period, up to the entire length of the exposed fault for corrugations observed on several of the domal cores. Centimetre-scale slickenlines on sparse outcrop exposed within the detachment have been visually imaged at the 15°45′N OCC and these parallel the local acoustically defined striations (MacLeod et al. 2002). Formation of the corrugations on detachments surfaces has been attributed to a continuous casting process, where protrusions in a strong hanging wall cut grooves into a weaker footwall block (Spencer 1999), however this model requires greater lateral homogeneity in rock type than likely occurs in at least some lithosphere hosting OCC (MacLeod et al. 2003; Spencer 2003). Shortening/folding perpendicular to the extension direction has also been proposed to explain kilometre-wavelength corrugations of detachments (Yin 1991; Fletcher et al. 2007) but this model has not been carefully tested against field observations in oceanic settings.
Hanging wall and klippe blocks commonly display volcanic seafloor morphology on a variably tilted top surface (Blackman et al. 1998; Tucholke et al. 2001; Searle et al. 2003; Smith et al. 2008). Sediment cover can mask the seafloor, precluding recognition of the boundary between footwall and hanging wall blocks (Blackman et al. 2002). Breaks in slope (Cann et al. 1997) and/or the start/stop of corrugations and striations (Blackman et al. 1998) have been employed to define the extent and boundaries of hanging wall blocks and klippe. Basaltic rubble found on top of parts of the domal core of several OCCs is interpreted as having been left behind after hanging wall displacement (Tucholke et al. 2001; Searle et al. 2003). Greenschist facies metamorphism of basalt rubble from Atlantis Massif indicates that the rocks may have come from the underside of this block (Blackman et al. 2002) rather than the top where alteration probably would have been at ambient sea water conditions.
A correspondence between seafloor features and the acoustic striations on the domal cores has not been comprehensively established. Thin drifts of marine sediment occur and have variable extents, from a few metres to hundreds of metres (Karson 1999; Tucholke et al. 2001; Blackman et al. 2002; MacLeod et al. 2002). Lineated fields of blocky rubble were imaged during video mapping atop the central dome of Atlantis Massif (Blackman et al. 2002) but a systematic relationship between acoustic striae and such features was not evident. There are areas where the sediment cap is lithified (Blackman et al. 2002) and this could contribute to the contrast in acoustic backscatter. To date, ground truth mapping has not been sufficient to ascertain whether these lithified areas extend in spreading-parallel sections and are thus the origin of striations in the sidescan imagery.
Many, but not all, lineations on the domal cores are spreading parallel (Fig. 3). At Atlantis Massif, TOBI sidescan mainly images spreading parallel striations over detachment surfaces. The DSL120 shows finer scale features that cut across the corrugations and striations (Fig. 3, Blackman et al. 1998; Blackman et al. 2002). The fact that striations overprint these cross-cutting linea, and are not offset by them, together with their commonly associated acoustic shadows suggests that they are small scarps that document variability in the footwall rock/structure immediately beneath or within the detachment zone. In areas where corrugations and striae are absent from the domal high, Blackman et al. (1998) infer that basement rocks of non-extrusive origin are exposed.
In the MAR 30°N area, bathymetric embayments occur adjacent to the fracture zone in several places on the ridge flanks and these tend to occur in lithosphere adjacent to where an OCC formed. For example, the current nodal basin at the ridge-transform intersection is associated with Atlantis Massif and a smaller basin occurs on the western flank of the southern ridge segment at the location conjugate to SOCC (∼43°W Fig. 4, Blackman et al. 2008). Similar embayments occur along the southern side of the Kane fracture zone (Dick et al. 2008) and their age may coincide with the time of OCC formation. However, the extended, multidome character of this OCC makes it harder to definitively partner the embayments (palaeonodal basins?) with palaeo inside corner highs.
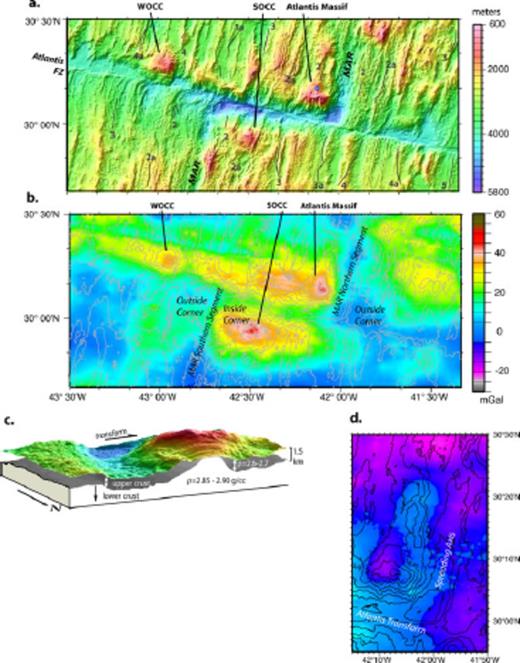
Morphology and gravity of MAR 30°N at the Atlantis fracture zone (modified from Blackman et al. 2008). (a) 100-m gridded bathymetry, plotted as colour-shaded relief map, highlights 3 OCCs that have formed in the past ∼9 Myr along this plate boundary. Labelled magnetic anomalies are from Pariso et al. (1996). Blue circle shows IODP Hole U1309D on the central dome of Atlantis Massif. (b) Bouguer gravity anomaly map has contribution of crust/sea water interface removed from the free-air anomaly, assuming constant density contrast 1700 kg m−3. Each of the three OCCs has positive Bouguer anomaly, within a broader band of high density along the inside-corner-created lithosphere. (c) Portion of 3-D intracrustal interface model of Atlantis Massif (view to SSW) shows where the domal core has density of gabbro or altered peridotite and no upper crust. (d) Residual gravity anomaly map of eastern ridge transform intersection shows that the 3-D interface model can explain the observed anomaly over the central dome and the eastern part of the Southern Ridge of Atlantis Massif (colour scale is the same as for b).
2.2 Gravity
Measurements of gravity, commonly obtained along ship tracks at the sea surface but also sparsely along short seafloor profiles, document the integrated signal of subsurface density distributions within OCCs. Differences between the density (e.g. Turcotte & Schubert 1982) of upper crustal basalts (2400–2700 kg m−3, depending on the amount of porosity/fracturing), gabbro (2900 kg m−3), and peridotite (3300 kg m−3) are great enough that deviations from a classic model of layered ocean crust (1.5–2 km upper crust, ∼4-km-thick gabbro, relatively sharp basal boundary at 6–7 km subseafloor, below which mantle peridotite dominates; Penrose 1972) can be discerned. Positive gravity anomalies, indicative of excess mass, are typically interpreted as thinner than average crust. Relative gravity anomalies allow the density contrast between adjacent structural blocks to be assessed via modelling, thus allowing the range of possible subsurface detachment fault geometries and foot/hanging wall block rock types to be assessed. As usual, gravity constraints are non-unique. An additional potential complication at OCCs is the range in density of peridotite altered by exposure to sea water, which can vary from its unaltered value to as low as 2600 kg m−3 if fully serpentinized (e.g. Miller & Christensen 1997).
The 15–20-km-wide band of lithosphere formed at the inside corner of slow-spread ridge-offset intersections is commonly associated with a gravity high (Lin et al. 1990; Tucholke & Lin 1994; Cannat et al. 1995; Pariso et al. 1995). Even when the contribution of seafloor topography is removed from the free-air anomaly (FAA), a 10–20 mGal positive Bouguer anomaly band remains, and it is often punctuated by 5–10 mGal localized highs at each domal core (Fig. 4, Blackman et al. 1998; Tucholke et al. 1998; Ballu et al. 1997; Fujiwara et al. 2003). This is usually taken as indicating that while the outside corner crust is normal thickness, the OCCs are emplaced in thinner than average crust accreted to the inside corner.
Gravity modelling of profiles across/along OCCs provides a qualitative estimate of subsurface density distribution. Several such studies suggest that the domal cores have average density that is 200–400 kg m−3 greater than the immediately surrounding volcanically capped blocks (Blackman et al. 1998, 2002; Tucholke et al. 2001; Nooner et al. 2003; Searle et al. 2003) and that narrower ‘plugs’ of higher density could occur within the core. The magnitude of the density contrast between the dome and adjacent blocks is appropriate for that between fractured volcanic rock and gabbro but gravity results alone do not rule out the possibility that the contrast is between average crustal density (e.g. volcanics and intrusive combined for a value ∼2850 kg m−3) and partially altered peridotite. The FUJI Dome (Searle et al. 2003) and Atlantis Massif 2-D models have highest core density near the ‘termination’ of the detachment at the seafloor.
The three-dimensionality of OCCs needs to be considered for more accurate assessment of subseafloor density distribution, since the assumption of out-of-plane continuity of features is violated when structural blocks terminate at distances that are less than the width of the cross-axis profile under consideration in 2-D modelling. The commonly employed Fourier representation of seafloor topography (Parker 1973) and the removal of its contribution from the FAA (Prince & Forsyth 1988) provides a step in this direction. When the goal is to understand how individual structural blocks within OCCs compare in subsurface properties, full resolution (∼100 m grid) bathymetric models should be used (not the 500 m–1 km grids commonly used for marine mantle Bouguer anomaly calculations (e.g. Kuo & Forsyth 1988; Lin et al. 1990; Blackman et al. 1998). The precision of the gravity prediction that is based on the bathymetry model also becomes important. Blackman et al. (2008) find up to 8 mGal differences in shallow, steep terrain, such as typifies OCCs, between predictions for fifth-order series (Parker 1973) seafloor interface contributions to the FAA for 100-m grid versus 500-m grid bathymetry models and third-order series expansion.
Typically, a mantle Bouguer anomaly or a residual anomaly (where the gravity contribution of lithospheric cooling with age has been accounted for) is used to discuss OCC density structure, with deviation from the assumed constant thickness, constant density crustal model being noted. However, the same methodology can be used to test models where intracrustal interfaces have a shape that simulates models of core complex structural blocks.
Atlantis Massif is the only OCC for which 3-D, 100-m-resolution gravity analysis has been done to date (Nooner et al. 2003; Blackman et al. 2008). There, a model where the domal core has average density of 2900 kg m−3 juxtaposed against a fractured, 3-D volcanic hanging wall block is shown to explain most of the Bouguer anomaly high (Blackman et al. 2008, Figs 4c and d).
2.3 Magnetics
There are three ways in which magnetic mapping of OCCs can aid in understanding their evolution. First, any asymmetry in lithospheric spreading/accretion associated with the formation of OCCs may be recorded as an asymmetry in the spacing of magnetic anomalies about the axis. Second, disruption of the original magnetic anomaly pattern may occur if there is significant displacement along the detachment at conditions below the blocking temperature; palaeomagnetic inclinations within coherent structural blocks affected by the disruption should record any rotation. Third, contrasts in the inherent magnetization of the rock types involved can provide an avenue for delineating the distribution of various lithologies (e.g. basalt versus serpentinized peridotite).
2.3.1 Magnetic anomaly patterns
Magnetic anomalies over ridge flanks where OCCs occur are typically less linear and less continuous than those over adjacent segments where OCCs do not occur (Pockalny et al. 1995; Pariso et al. 1996; Fujiwara et al. 2003; Okino et al. 2004). Lower amplitude anomalies and significant non-linearity in pattern are described in the 14°−16°N MAR area for segments where OCCs occur, in contrast to where they did not develop (Fujiwara et al. 2003).
Asymmetry in magnetic anomaly pattern is often interpreted to reflect differences in the half spreading rate of each ridge flank during OCC formation within a segment. Fujiwara et al. (2003) note that each section of the 14°−16°N MAR flanks that contains OCCs shows a small (∼5 per cent) average asymmetry, with faster accretion on the side where the OCC formed. However, these authors do not recognize an accretion/spreading rate signature tied specifically to OCC locations. Searle et al. (2003) discuss a magnetic anomaly profile over FUJI Dome, preferring a model where ∼75 per cent of the spreading occurred via slip of the footwall from the rift axis and only 25 per cent of the new lithosphere was added to the opposite plate. At the AAD, Okino et al. (2004) also document significant asymmetry in magnetic anomaly pattern and they suggest that periods of up to 75 per cent accretion onto lithosphere where an OCC forms may occur. However, they note that ridge jumps or propagation of rift segments along strike could play a role in apparent asymmetric magnetic anomaly patterns associated with OCCs in the AAD (Fig. 5). Similarly, Fujiwara et al. (2003) report that recent (1.3 Ma) asymmetries in the anomaly patterns at the MAR 14°–16°N could be explained by shifts in the locus of spreading of 4–9 km, with size and timing of the shift varying between spreading segments in correspondence with the presence of an OCC. Regardless of the mechanism (ridge jump or steady asymmetry in accretion), the axis of spreading must shift relative to those of adjacent, symmetrically spreading segments, thus modifying the geometry of the ridge-transform plate boundary.
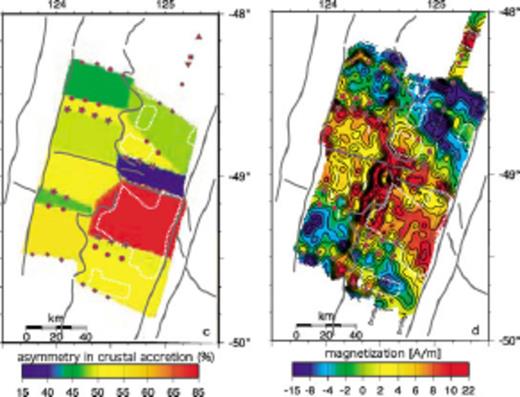
Asymmetries in accretion for a segment in the AAD where several OCC formed over the past 4 Ma (from Okino et al. 2004). (Left-hand panel) Half spreading rates determined from measured interval between magnetic anomaly picks. White dotted lines outline OCC within the eastern portion of the segment. (Right-hand panel) Crustal magnetization solution assuming a 500-m-thick source layer.
2.3.2 Palaeomagnetic inclinations
Palaeomagnetic measurements on core samples from ODP Hole 735B (Dick et al. 1999), Site 1275 (Kelemen et al. 2004) and IODP Site 1309 (Blackman et al. 2006), indicate that inclination of the natural remanent magnetism of OCC footwall rocks differs from that expected for the latitude of each location. This requires that some rotation of the footwall has occurred and, in each case, the sense is away from the palaeospreading axis; the average amount appears to be on the order of a few tens of degrees (Allerton & Tivey 2001; Garcés & Gee 2007; Morris et al. 2008). Specific estimates of rotation angle assume that the axis of rotation is subhorizontal and at least approximately ridge parallel. The latter has been confirmed for Hole U1309D at Atlantis Massif (Morris et al. 2008). Where detailed sampling and analysis have been done, inclination values can vary about the average, and steady trends over downhole ranges of a few hundred metres are sometimes evident. This suggests that individual fault-bounded blocks may sometimes shift independently within the footwall (Palaeomagnetic chapter in Blackman et al. 2006). Palaeomagnetic results from the Kane OCC obtained from dredging and submersible sampling indicate that this OCC may have experienced 15° counter-clockwise rotation (Williams 2007), although modelling of the magnetization derived from near-bottom measurements across a basaltic ridge located in the northern-central part of this OCC suggest rotation angles of 35° (Williams 2007).
2.3.3 Patterns of magnetization intensity
Inversions for crustal intensities have determined differences in magnetization for portions of several slow-spreading flanks that were created at the end of a ridge segment (Pariso et al. 1995; Pockalny et al. 1995; Weiland et al. 1996). Often the magnetization is higher in these settings but Pockalny et al. (1995) examine reversely polarized segment end crust and find that an increase in positive magnetization is a more accurate description along some discontinuity types. These authors explore different models to explain the magnetization, including a scenario where long-lived detachment faulting and serpentinization of exhumed lower crustal and mantle rocks leads to an induced magnetic response, although this study does not relate signatures to individual core complexes. Similar apparent high induced magnetizatons have been reported for corrugated domal highs on the flanks of the SWIR 61°–65°E (Sauter et al. 2008).
Tivey & Tucholke (1998) specifically address how inside corner-created lithosphere differs, in terms of magnetization, from other parts of the plate. Crust created at slow-spread inside corners on 0–30 Ma central Atlantic seafloor tends to have greater induced magnetization (Tivey & Tucholke 1998). This results in normal polarity inside corner crust having a stronger magnetic signal but reversed polarity crust appearing weaker than coeval regions along-isochron. Tivey & Tucholke (1998) infer that the source of the induced magnetization is alteration of intrusive crust and/or serpentinized peridotite, both of which acquire fine-grained magnetite as a product of alteration. This process can occur most readily at OCCs where the domal cores expose these lithologies to sea water circulation. At the AAD, OCCs are also associated with magnetization that is more positive than immediately surrounding areas (Fig. 5, Okino et al. 2004).
Present-day serpentinization of initially reverse-polarized crust is occurring at the low temperature (40–90 °C) Lost City hydrothermal vent field, which is hosted in peridotite just below the peak of Atlantis Massif (Kelley et al. 2001). Here, the lack of a strong positive magnetization was inferred to indicate that the recent/ongoing serpentinization (Früh-Green et al. 2003) does not contribute significantly to the anomaly pattern (Gee & Blackman 2004). Instead, it was hypothesized that unroofed reversed polarization rocks could explain the deep-tow magnetic anomaly pattern over the domal core of Atlantis Massif.
Due to the slow spreading rates where OCCs commonly form, teasing out relationships between magnetic properties and individual structural blocks can be challenging. Even without OCCs, the anomaly recording is not as high-definition as when spreading rates are rapid and individual anomalies are well spaced and can be clearly identified.
2.4 Seismic velocity structure
There are a number of potential targets, and traps, for investigations of seismic velocity structure of OCCs. If models predicting that OCCs form during periods when magma supply to a portion of the spreading centre is reduced are correct, overall crustal thickness should be reduced but vertical structure prior to faulting could still conform to the classic layered Penrose model. Alternatively, the lithosphere where an OCC develops may comprise a more complicated plum pudding with pods of mafic or ultramafic material embedded in a background matrix (e.g. Cannat 1993). If locally there is no extrusive layer, high P-wave velocities should occur at shallow depths, due to either the presence of gabbro (greater than ∼6.0 km s−1) or unaltered ultramafics (>7.5 km s−1). However, as always, inferences drawn from the seismic velocity structure must allow for the ambiguity in the relationship between seismic velocity and rock type, and for the fact that seismic velocities are significantly reduced by the presence of cracks and alteration. The P-wave velocities of partially serpentinized peridotite overlap with those of gabbro. Thus, the Moho may represent an alteration front rather than coinciding with the petrologic crust/mantle boundary, where mafic cumulates transition downward into residual mantle rocks. Indeed one of the attractions of OCCs is the possibility of being able to directly explore the nature of a Moho transition by drilling.
One of the challenges of seismic experiments at OCCs is ensuring that coverage is sufficient to resolve their structural complexity. The seismic layering of normal oceanic crust has been long established (e.g. Spudich & Orcutt 1980; White et al. 1992), and contributed to the adoption of the Penrose model. This structural understanding has, in turn, informed the design of subsequent active source seismic experiments. For example, relatively large spacing between ocean bottom seismometers (OBSs) is typically used because vertical velocity gradients are expected to be significantly greater than lateral gradients; an assumption that can be checked later with the data. At OCCs, however, there can be large horizontal velocity gradients, particularly at shallow depths and in these circumstances dense source and receiver spacing is required to reduce the structural ambiguity. Multichannel seismic (MCS) data can satisfy this requirement, provided the streamer is of sufficient length to record shallow-turning refracted phases. At Atlantis Massif, the use of MCS data (Canales et al. 2008; Harding et al. 2007) to image shallow structure has helped to clarify some ambiguities in a reversed on-bottom experiment (Detrick & Collins 1998). The deeper structure of some OCCs has been established using OBSs or hydrophones (OBH) spaced at ∼5–15 km intervals to record sea-surface air gun shots along profiles with source-receiver apertures up to several tens of kilometres (i.e., wide-angle, Planert 2006; Ohara et al. 2007a; Nishizawa et al. 2007; Canales et al. 2008).
In the following two subsections we review the results of the wide-angle experiments and the results of studies that have used small source-receiver apertures (up to 6 km), with either OBS/H and near-bottom sources, or sea-surface air gun shots recorded by towed hydrophone streamers. In the future, models will doubtless benefit from joint inversion of both types of data, but so far this has not been attempted.
2.4.1 Crustal-scale wide-angle seismic studies
2.4.1.1 Atlantis platform, SWIR
The first seismic refraction study of an OCC was conducted across the Atlantis Platform (Muller et al. 1997; Muller et al. 2000) on 11.5-Ma crust on the flank of the SWIR (Dick et al. 1991). The shallowest central part of this ∼20 km long by ∼10 km wide platform comprises Atlantis Bank, where ODP Hole 735B is located (Dick & others 2000). Two wide-angle seismic profiles were shot across the OCC, in the strike and the dip directions. Air gun shots were recorded on ocean bottom hydrophones (OBH) (Table 2, Muller et al. 2000). Crustal turning rays, Pg and Moho reflections, PmP, were recorded out to ranges of 25–35 km.
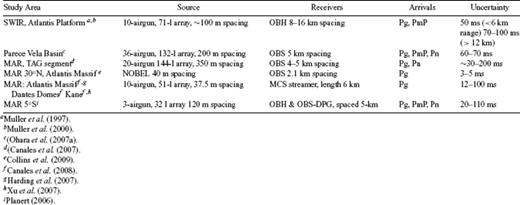
Seismic acquisition parameters for surveys at OCCs.
Muller et al. (1997, 2000) determined velocity models that show the structure of Atlantis Platform contrasts with that of the surrounding crust. The domal core displays unusually high seismic velocities at very shallow levels: a thin seismic Layer 2, with velocity of 5.8 km s−1 at the seafloor and increasing to 6.5 km s−1 at 1.4 km depth, overlaying a ∼4.2-km-thick seismic Layer 3, where velocities increase with depth from 6.5 to 6.9 km s−1. The data recorded by Muller et al. are also consistent with an alternative model in which Layer 3 has an internal division, with constant velocity of 6.9 km s−1 in the deepest ∼1.75-km-thick section. These models suggest that Moho depth beneath the domal core is ∼5.5 km. The interpretation of the nature of seismic Layer 3 and Moho at this location are discussed later.
2.4.1.2 Parece Vela Basin, Philippine Sea
A 2-D seismic refraction survey was recently conducted along a flow-line across the Godzilla Mullion (Ohara et al. 2007b). The velocity model shows two distinct domains within the OCC: the ridgeward section of the domal core (about one third of its total ∼125-km dip length) is characterized by unusually high velocities as shallow as ∼500 m below seafloor (mbsf), 6 km s−1, slowly increasing to ∼7.0 km s−1 at Moho depths of ∼5.5–6.0 km. In contrast, velocities within the remaining two-thirds of the OCC further from the ridge are lower: 6 km s−1 velocity is not reached until ∼2 km below seafloor, and the increase to ∼7.0 km s−1 occurs slowly over the interval until Moho is reached at a depth of ∼4 km.
An OBS seismic refraction profile was shot across the chaotic terrain in Parece Vela Basin that includes OCCs (Nishizawa et al. 2007, Table 2). Arrivals included Pg, PmP and Pn phases (arrivals that travel dominantly in the uppermost mantle) were recorded out to ranges of 200 km. Depth to the Moho across this terrain was determined to be variable, ranging from 3.4 to 5.5 km (Ohara et al. 2007a). Of the five dome-like highs crossed by this profile, three of them have seismic structure typical of normal ocean crust, while two of them display seismic velocities greater than 6 km s−1 at very shallow levels (Ohara et al. 2007a). These two domes are the largest along this profile and they have the clearest morphologic signature of an OCC, showing prominent corrugations. The others are smaller and their morphologic identification as exposed footwall to a detachment is questionable.
2.4.1.3 TAG segment, Mid-Atlantic Ridge ∼26°N
Although the OCC at TAG is not fully developed, its seismic structure is well characterized (Canales et al. 2007) and can provide insights into subsurface marine detachment properties. Two seismic profiles along and across the rift valley were obtained (Table 2). Arrivals were observed out to 40 km range and include Pg and Pn (Canales et al. 2007).
The velocity structure is highly asymmetric across the rift valley, with seismic velocities greater than 6.5 km s−1 at depths more than 1 km below the eastern rift valley wall (deMartin et al. 2007). Where the high-velocity body is shallowest, velocities increase from 4.0 to 7.0 km s−1 within a kilometre of the seafloor, and then remain relatively high (6.7–7.0 km s−1) to a depth of at least 4 km (Fig. 6). The shallow, high-velocity body extends ∼20-km-along axis. No PmP phases were recognized in this dataset.
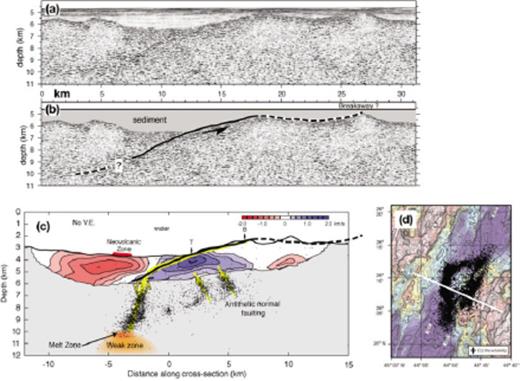
(a) Pre-stack depth migrated MCS image of a Cretaceous inside corner high in the Eastern Central Atlantic with (b) geological interpretation of detachment fault geometry (modified from Ranero & Reston 1999). (c and d) Geophysical indications of active detachment faulting in the TAG segment, 26°N MAR (modified from deMartin et al. 2007). (c) Contoured colour indicates deviation from an average 1-D velocity structure; dots are earthquake hypocentres projected onto this section from an area extending a kilometre either side. Yellow lines are interpreted detachment fault and antithetic normal faults. Thick solid-dashed line is the geometry of the detachment fault shown in (b) with its depth adjusted to match the depth of the termination (intersection of the fault and seafloor, T) of both faults. Note the excellent agreement in fault dip within the upper 2–3 km of the crust. (d) Earthquake epicentres in the TAG segment, the curved pattern of western events is inferred to mark the boundary of the footwall to the detachment. White line locates cross section shown in (c).
2.4.1.4 MAR 5°S.
A wide-angle seismic survey using OBSs deployed every ∼5 km was conducted across and along the split OCC at 5°S on the Mid-Atlantic Ridge (Planert et al. 2003). The domal core is characterized by shallow, high velocities that increase from 5.2 km s−1 at the seafloor to 6 km s−1 just 0.8 km below seafloor (Planert 2006). At deeper levels, velocities range from 6.0 to 6.5 km s−1 at low vertical gradient (∼0.1 s−1). PmP phases were observed in this experiment and they constrain crustal thickness beneath the split OCC. Thin crust (3.2 ± 0.4 km) was determined along a profile running in the spreading direction, while a profile crossing the dome in the ridge-parallel direction shows that the crust varies in thickness from ∼2.5 km at the southern end of the OCC, near the segment centre, to ∼5.5 km at the northern end of the OCC bounded by the 5°S transform fault (Planert 2006).
2.4.2 Shallow, small-aperture seismic refraction studies
The upper 0.5–1.5 km of a portion of the domal core of Atlantis Massif has been studied using near-offset seismic refraction. The Near Ocean Bottom Explosive Launcher (NOBEL) source (e.g. Christeson et al. 1994) was triggered along two profiles on the central dome (Table 2, Collins et al. 2009). With OBSs at each end, these lines provide reversed refraction coverage of the upper several hundred metres. The NOBEL arrivals have high signal-to-noise ratio therefore traveltime picks have small uncertainty. The near-offset (< 400 m range) arrivals are linear and require a 50–100 m topmost layer with velocity ≤ 3 km s−1 (Collins et al. 2009). At ranges of 1.6–2.1 km, first arrivals on one instrument have apparent velocities of 7.5 km s−1 and these were initially interpreted as Pn (Collins et al. 2003). However, the arrival time patterns differ for each direction along the two profiles, indicating that subsurface structure is non-planar. The initial models did include modest lateral variation in structure but vertical gradients were dominant, with Moho less than a kilometre deep. Re-analysis following the IODP drilling, which recovered only mafic intrusive rocks nearby (Blackman et al. 2006), indicates that these arrivals are crustal turning rays, Pg. Modelling of the full set of arrivals indicates that 5 km s−1 material occurs at ∼200 m greater depth on the southern part of both lines and the maximum velocity in the upper ∼600 m of the section is 6.0–6.5 km s−1 (Collins et al. 2009).
Shallow refraction phases recorded in MCS data (cruise EW0102, R/V Ewing) have been analysed in three Atlantic regions where OCCs occur (Canales et al. 2008): Atlantis Massif (30°N), Dante's Domes (26°N), and south of Kane fracture zone (23°N). Clear Pg arrivals are seen at 2–6 km range in shot gathers. Tomographic inversion of these data employed Zelt's methodology (e.g. Zelt et al. 2004) to obtain a smooth velocity model with 200 m node spacing. Canales et al. (2008) document the occurrence of strong lateral gradients, with lateral scales of 1 km or less within the upper ∼0.5–1.7 km of the lithosphere in each of the Kane, Dante's Domes and Atlantis Massif OCCs. Structure beneath the exposed detachment faults generally comprises two distinct domains (Canales et al. 2008): areas of shallow high-velocity anomalies (>4.2 km s−1) and large shallow velocity gradients (>3 s−1), and areas with moderate shallow seismic velocities (3.4–4.2 km s−1) and lower vertical gradient (1–3 s−1, Fig. 7). The high velocity anomalies have lateral extents of ∼5–20 km, and are consistently (but not exclusively) present near the termination on the detachment faults. In the strike direction their distribution is heterogeneous, without clear relationship to the present or palaeosegmentation of the MAR. The high-velocity regions dominate the structure of the Central Dome of Atlantis Massif OCC, the southern dome of Dante's Domes OCC and the Babel and Cain dome of Kane OCC.
Seismic velocity structure of OCCs. (a) Tomographic models of Canales et al. (2008). (b) 1-D velocity profiles from specific locations within several OCCs: Atlantis Platform profile is from Muller et al. (1997) model at location of ODP Hole 735B; TAG profile is extracted at 4 km distance along model of Canales et al. (2007a), in the footwall to the detachment (see Fig. 6). Coloured lines are from Canales et al. (2008): solid lines are profiles extracted from a high shallow velocity portion of each OCC model; dashed lines are profiles extracted from a portion of the same model where velocity structure appears ‘normal’. Location of each extracted profile is indicated as position (km) along respective model (labelled in parentheses). Grey marks envelope of profiles determined for 0–7 Ma Atlantic lithosphere (White et al. 1992).
The better ray path coverage of surface MCS data resolves much of the ambiguity in the seafloor inversions but at the expense of poorer vertical resolution due to the difficulty of accurately picking the shallowest turning arrivals. Downward continuation of the MCS data (e.g. Berryhill 1979) to the seafloor or a datum just above the seafloor can address the problem by approximating a Synthetic On-Bottom Experiment (SOBE). This approach has been applied to a portion of the EW0102 MCS data from the central dome of Atlantis Massif (Harding et al. 2007), where it brings shallow turning arrivals, received at 0.7–2 km offset, out in front of the water wave. Comparison of the time picks with the predictions of the Canales et al. (2008) model reveal misfits of up to 60 ms in the 0.7–2.0 km offset window but misfits at the picking uncertainty, 10–20 ms, over the rest of the dataset. An inversion of the SOBE picks, using the method of van Avedonk (Van Avendonk et al. 2004), has lateral structure similar to the Canales model but improved vertical resolution (Fig. 8). The near-offset coverage provided by the downward continued data requires a thin, top low-velocity layer on the eastern slope and higher velocities are required at depth, compared to the Canales et al. (2008) model. Variation across the model is considerable as illustrated by a series of vertical velocity profiles (Fig. 8b). The western part of the line has (shallow) structure similar to typical young Atlantic lithosphere. The highest velocities immediately below the seafloor occur just west of the shallowest point on the dome at this latitude. Highest velocities at ∼1 km depths are determined to occur below the eastern slope of the dome. Initial SOBE results for the southern ridge of Atlantis Massif (Henig et al. 2008) indicate that similar velocity structure occurs within the eastern portion of the Southern Ridge at Atlantis Massif.
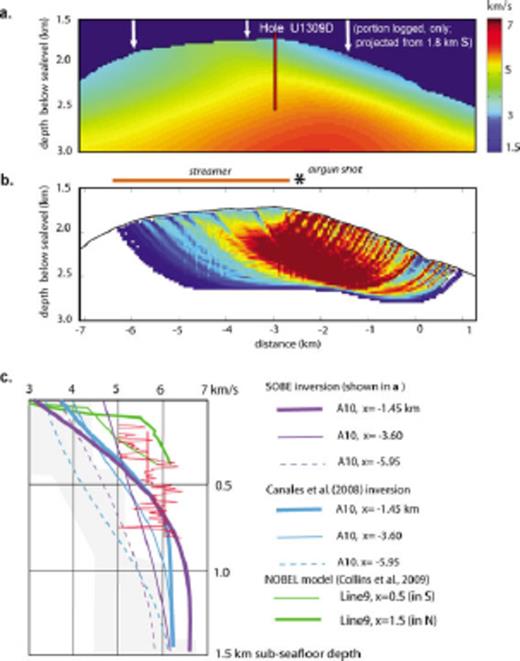
Velocity models for the central dome of Atlantis Massif. (a) P-wave traveltime inversion results for downward-continued arrivals (SOBE analysis, Harding et al. 2007) on a portion of MCS line A10. (b) Derivative weight sum for each model element, red showing greatest influence on results and blue least influence. Extent of ray coverage for the model in (a) is indicated here. (c) Extracted velocity profiles from specific locations along various models for the central dome, as labelled at right. Grey shows average young Atlantic lithosphere envelope (White et al. 1992). Red shows IODP Hole U1309D borehole results: straight lines are checkshot velocity, which is overlain on sonic log values.
2.4.3 Borehole data
Borehole seismic logging measures velocity of the formation at a scale of several metres; small-scale porosity is well represented but larger-scale fracturing that regional seismics would be affected by is not measured. Borehole velocity measurements have been obtained in the upper 500 m of Hole 735B in Atlantis Bank, and the upper 800 m of Hole U1309D in Atlantis Massif, both of which cored gabbroic sections. Average P-wave velocity of 6.5–6.8 km s−1 is reported for the 150–450 mbsf section at Atlantis Bank, SWIR (Swift et al. 1991), the upper 150 m show a steady increase from ∼4.6 km s−1 just below the seafloor to 6.5 km s−1. Velocities in the 150–370 m bsf interval in Hole U1309D on Atlantis Massif are variable with average value of 5.6 km s−1. The 400–800 m bsf interval has smaller variations in the sonic logs about the average velocity of ∼6 km s−1.
Checkshot experiments provide 10–100-m scale measures of the local seismic velocity around a borehole. Airgun shots are fired directly above the hole and a seismometer clamped at a series of depths records the average velocity between source and receiver. In addition, if the source is strong enough (e.g. 400–1000 in.3, Swift et al. 1991) reflections from internal impedance contrasts are recorded. At Atlantis Massif, checkshot data indicate velocities similar to that determined from the sonic logging. Collins et al. (2009) reported 5.6 and 6.1 km s−1 average values for the 270–480 mbsf and 500–800 mbsf intervals, respectively.
When the borehole results from Atlantis Bank and Atlantis Massif are compared with the MCS and NOBEL inversions, we see a good agreement between models, once allowance is made for difference in resolution (Figs 7b and 8b). In particular, the ground truth provided by deep drilling indicates that portions of models with high velocities at shallow depths in the domal cores (increasing beyond 6 km s−1 by ∼500 mbsf) are diagnostic of a competent, dominantly gabbroic section. Although the velocity values alone could, alternatively, indicate partially serpentinized ultramafics, the recovered rocks show this is not the case in these regions. None of the recent models have velocities greater than ∼7.5 km s−1 that would be diagnostic of significant volume of unaltered ultramafic material at shallow depths. The OCC velocity models fall into two groups, one with shallow high velocities and another group that falls within the bounds of young oceanic crust as defined by White et al. (1992). This second group can thus not be distinguished from normal oceanic crust based on P-wave velocity alone, although they may represent sections of either more fractured and/or altered gabbroic rock or highly serpentinized peridotite. These inferences cannot rely solely on the seismic results but must be based on a synthesis of geophysical and geological results and are discussed further in Section 4.
2.5 Seismic reflection imaging
2.5.1 Cretaceous inside corner, Eastern-Central Atlantic
Ranero & Reston (1999) reported pre-stack depth migrated MCS images collected across a fossil Cretaceous inside corner high on the Eastern Central Atlantic. Although this sedimented inside corner high has not been definitively established as an OCC, its morphology is somewhat analogous to that of the Atlantis Massif and Kane OCCs (Ranero & Reston 1999). The geometrically correct depth section (Fig. 6) shows a domal basement with roughness and slopes comparable to those from the Atlantis Massif and Kane OCCs. Ridgeward from the basement dome there is crustal reflector that can be traced continuously down to a depth of ∼2 km subbasement, with dips that range from ∼20° near the basement to ∼30° at its deepest part (Fig. 6). If this fossil inside corner is indeed an OCC, then the depth-migrated image of Ranero & Reston (1999) is a powerful constraint on the shallow geometry of detachment faulting at OCCs.
2.5.2 Atlantis Massif
Conventional processing (stack and post-stack time migration) of seismic reflection data collected across Atlantis Massif OCC shows that the exposed section of the detachment fault exhibits a sharp, coherent reflection at ∼0.20–0.25 s two-way travel time below seafloor, termed the ‘D’ reflection (Canales et al. 2004). The D reflection was best imaged across the central dome (Fig. 9a), dipping towards the breakaway and approaching the seafloor near the summit of the dome. The D reflection appears to be present beneath most of the exposed detachment surface, although in places its identification is not clear. Although the detachment fault was ambiguously identified along strike beneath the basaltic hanging wall block that defines the termination, the ridgeward subseafloor trace of the fault in the dip direction could not be recognized in these images.
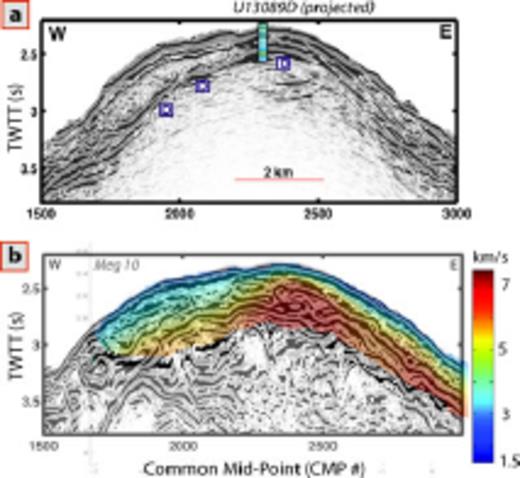
MCS data on the central dome of Atlantis Massif. a) Migrated stack of a portion of line A10 processed by Canales et al. (2004), D reflection is labelled. Projection of drill core from IODP Hole U1309D is overlain. b) Corresponding unmigrated section from Singh et al. (2004) that reveals complex reflectivity starting at the D’ reflection and extending 0.5 s deeper, well below the base of the Hole U1309D projection. Tomography model derived from SOBE refraction picks is overlain (from Harding et al. 2007).
While Canales et al. (2004) focused on the D reflection, subsequent analyses show that deeper reflectors also occur within the domal core of Atlantis Massif. Singh et al. (2004) used an innovative method (Masoomzadeh et al. 2005) to stack wide-angle reflections and refractions. Their resulting seismic image shows that the D reflection is the uppermost in a complex series of events that extend at least 0.7 s below the seafloor (Fig. 9b). Overlaying the results of the velocity model on the reflection image indicates that the D reflection marks the base of the low velocity surficial layer, in a manner similar to the layer 2A reflector in normal oceanic crust.
2.5.3 Chaotic Terrain, Parece Vela Basin, Philippine Sea
Seismic reflection data collected across the Chaotic Terrain of the Parece Vela Basin are coincident with the seismic refraction profile discussed above (Nishizawa et al. 2007; Ohara et al. 2007a). The imaged OCCs do not show organized internal reflectivity. One of the OCCs, named CT2, shows shallow reflections (∼0.15 s twtt) that Ohara et al. (2007a) termed a ‘D’ reflection because of the similarities to the D reflection designated at Atlantis Massif by Canales et al. (2004). Other intermittent, weak reflections are identified deeper in the sections between ∼0.5 and ∼1.0 s, and these are attributed to the boundary between a lower velocity upper layer and higher velocity material (similar to layer 2/3 boundary) and/or impedance contrasts within a generally constant gradient section (Ohara et al. 2007a).
2.6 Seismicity
Hydroacoustic monitoring of the MAR during the last decade (Smith et al. 2003) revealed that areas with extensive OCC formation are characterized by high levels of seismicity. Both the Kane and Atlantis Massif OCCs have 1–2 dozen T-phase source locations throughout their domal core over a 2–3 yr period (Williams et al. 2006). However, these T-phase source areas have few-km lateral uncertainties and the depths of the earthquakes are unconstrained. Thus, the mechanisms of faulting and deformation associated with OCC evolution cannot be deduced.
In the TAG area, MAR ∼26°N, an 8-month microseismicity experiment with a 7 × 7 km network of 13 OBS recorded many earthquakes (deMartin et al. 2007). The activity is concentrated in an arcuate band extending ∼15 km along the ridge axis (Fig. 6). This band of seismicity delineates a dome-shaped fault inferred to be a detachment. The well-located seismicity extends from ∼3 km to greater than 7 km subseafloor, along a ∼70° dipping interface (Fig. 6). A second off-axis linear band of seismicity suggests deformation within the footwall by antithetic normal faulting (deMartin et al. 2007).
A 10-d deployment of OBH at the MAR 5°S recorded a few earthquakes in the area of the OCC at this site (Tilmann et al. 2004). Hypocentres of these events are 4–8 km below the seafloor, indicating that brittle processes occur over a depth range similar to that inferred to be associated with current detachment faulting at TAG, despite the fact that the detachment that controlled formation of the 5°S domal core has probably not been active for some time (Reston et al. 2002). Focal mechanisms for the MAR 5°S study could not be determined with confidence (Tilmann et al. 2004).
3 Implications For Structure and Variability
All of the OCCs studied seismically have velocities within at least a portion of the domal core's upper ∼1–1.5 km that are significantly higher than average young Atlantic lithosphere (White et al. 1992, Figs 7 and 8). These high-velocity regions can dominate most of the footwall to the detachment, as appears to be the case at Atlantis Bank (Muller et al. 1997) and TAG (Canales et al. 2007). At other OCCs, such as Atlantis Massif, Kane, Dante's Domes (Canales et al. 2008) and Godzilla Mullion (Ohara et al. 2007b), the high-velocity bodies are embedded within or abutting against lithosphere that has a seismic structure very similar to average young Atlantic lithosphere (Figs 7 and 8).
The nature of the shallow high velocity bodies at Atlantis Bank and the central dome of Atlantis Massif is ground-truthed by deep drilling. At Atlantis Bank, ODP Hole 735B drilled 1500 m of gabbro (Dick & others 2000). Similarly, at Atlantis Massif IODP Hole U1309D recovered a gabbroic sequence from the upper 1415-m of the domal core of the OCC (Blackman et al. 2006). Based on these velocity-lithology correlations, Canales et al. (2008) argue that the shallow high-velocity bodies observed at Kane and Dante's Domes OCCs must also be large (tens of kilometres square) gabbroic intrusions. It is likely that this is also the case for the footwall to the fault at TAG, where gabbro is exposed on the eastern rift valley wall (Zonenshain et al. 1989), and for the youngest exposed section of Godzilla megamullion.
Although shallow (<1 km subseafloor) high-velocity (5.5–6.5 km s−1) bodies are present in all of the OCCs studied, large sections of some of these OCCs have a shallow structure that resembles what is considered standard Atlantic crust: the southern peak area of Atlantis Massif, the Abel Dome south of Kane fracture zone, and the northern dome of Dante's Domes (Fig. 7). These portions of the OCCs can be interpreted to represent three possible lithologies: (1) gabbroic rock with greater degree of alteration and/or fracturing than the high velocity portions of the OCCs; (2) a volcanic section typical of the upper magmatic crust or (3) highly serpentinized peridotite.
The first possibility does not appear to be supported by available mapping. The morphology of the Abel Dome is generally similar to the Cain Dome and there is no indication, such as scarps and/or identified talus accumulation, which would indicate increased fracturing or weathering of the former. Both domes have smooth corrugated surfaces (despite different ages) and they are of similar size. The northern and southern domes of Dante's Domes also have very similar topographic characteristics, these being the same age. If both are gabbroic, a reason for the development of greater alteration/fracturing of one is unclear. Tectonism and uplift of the southern ridge at Atlantis Massif could have contributed to fracturing within its upper section. Atlantis Bank, SWIR, may have developed in a similar tectonic environment, with respect to a large transform (Dick et al. 1991). Like IODP Hole U1309D at Atlantis Massif, Hole 735B is at least 10 km from the transform fault trace (further if the western fracture zone trough marks the previous locus of strike slip motion). In the area between Hole 735B and the fracture zone (corresponding to the position of the southern ridge at Atlantis Massif) velocity structure is closer to the Atlantic average but there is no domal core.
Morphological and geological evidence also argue against the second possibility. The areas where the detachment faults overly standard subsurface velocity structure have smooth seafloor that contrasts with the rough terrain usually associated with volcanic upper crust (Smith & Cann 1992). Also, the occurrence of in situ volcanic rock above the detachment surfaces appears to be very limited; fault rocks and deep-seated rocks (diabase, gabbros and peridotites) dominate in these settings (Tucholke et al. 1998).
Evidence that supports the interpretation that the portions of OCCs with ‘normal’ velocity structure are highly serpentinized peridotites (Canales et al. 2008) is available at Atlantis Massif and Kane OCCs. Large slides scars along the face of the shallowest portion of the southern ridge at Atlantis Massif expose massive outcrops of serpentinized peridotite (Karson et al. 2006), and 70 per cent of seafloor samples from this part of the OCC have this lithology, gabbro making up the other 30 per cent. The active Lost City hydrothermal field near the summit of the Atlantis Massif (Kelley et al. 2001) is a system whose chemistry requires significant contributions from serpentinization (Früh-Green et al. 2003). At the Kane OCC, where the western flank of Cain and essentially all of Abel dome have ‘normal’ velocity structure, slide scars of a major west-dipping normal fault (East Fault, Dick et al. 2008) also expose massive serpentinized peridotite, which is inferred to document the dominant lithology of this portion of the OCC.
Alternatively, Ildefonse et al. (Ildefonse et al. 2007) hypothesize that the Atlantis Massif and Kane peridotite exposures are relatively thin sheaths of peridotite surrounding a gabbroic core. Blackman et al. (2008) obtain a 3-D gravity model where the whole domal core of Atlantis Massif has average density of 2900 kg m−3, also suggesting a more continuous lithology. However, the density of serpentinized peridotite overlaps that of gabbro so gravity does not provide a unique constraint. And, as discussed above, the reason that properties would differ from one portion of a solely gabbroic domal core to another (e.g. central versus southern dome at Atlantis Massif or Cain versus Able Domes south of the Kane fracture zone) is not clear.
At intermediate levels beneath the detachment faults (>2 km below seafloor), the four sites where data have been analysed, Atlantis Platform, TAG, 5°S MAR and Godzilla megamullion show similar structure: nearly constant velocities in the range 6.5–7.0 km s−1. This range of seismic velocities is consistent with either gabbro or partially serpentinized peridotites (e.g. Miller & Christensen 1997). At Atlantis Platform, Muller et al. (1997) argue that the gabbroic section drilled at ODP Hole 735B extends to a depth of about 2 km below seafloor, and that it is underlain by 2–3 km of partially serpentinized mantle with seismic velocities of 6.9 km s−1. They base this interpretation on inversion of measured rare earth element abundances for basalt collected from crust conjugate to Atlantis Bank, which suggests that decompression melting would produce 1.5–4.5 km thick crust. Therefore, Muller et al. infer that the Moho at ∼5.5 km below seafloor in their velocity model (Fig. 7b) is a serpentinization front and not a crust/mantle compositional boundary. However, one might expect serpentinization of the mantle to be gradual; as confining pressure increases with depth, porosity decreases and the ability of fluids to pervasively penetrate and hydrate the mantle decreases. This would result in velocities that progressively increase with depth as the degree of serpentinization decreases. The deep structure beneath TAG, Godzilla Mullion and Atlantis Platform, is remarkably uniform with very small vertical velocity gradients (∼0.2 s−1, about half the typical Layer 3 gradient in normal crust), although the gradient for the latter is not firmly constrained (Muller et al. 1997). Thus, we suggest that this velocity structure might more likely represent gabbro. If this interpretation is correct, then the gabbroic intrusions that seem to be present in all of the studied OCCs could have thicknesses of up to 5 km. This would support the hypothesis of Ildefonse et al. (2007) where OCCs represent past episodes of greater than typical intrusive activity to a section of the ridge that is usually not robustly magmatic.
Although the domal cores might be dominantly gabbroic in the upper few kilometres, the details of the deeper structure are still largely unresolved. Some of the seismic processing to date (e.g. Canales et al. 2004; Fig. 9a) was more focused on shallow reflectivity in order to emphasize possible subseafloor detachment geometry, but even where deeper reflectivity was targeted (e.g. Singh et al. 2004, Fig. 9b), a clear Moho reflection was not seen. Similarly, Ranero & Reston (1999) do not image a reflection Moho in their data from the MAR flank. At the SWIR near Atlantis Bank, Muller et al. (1997) interpret arrivals as PmP, and in the Parece Vela Basin Ohara et al. (2007a) pick Pn that have propagated through regions on either side of the domal core of an OCC. Neither of these studies reports recognizing both PmP and Pn from directly under of the domal high, and it is not apparent from published reports that both phases have been recorded from beneath any OCC to provide an unequivocal mapping of Moho. Planert (2006) suggest that both phases were recorded for parts of the 5°S split OCC. Complexity in the shallow structure may play a role in obscuring the signal but lithologic effects, such as a diffuse or rapidly laterally varying transition from dominantly mafic to essentially all ultramafic, may be the controlling factor.
While there is support for models where increased (or the onset of) mafic intrusions within a section of a spreading segment plays a role in OCC formation (Ildefonse et al. 2007; Tucholke et al. 2008), bathymetry and gravity data highlight the fact that both ridge flanks must be considered before conclusions about overall variability in magma supply and/or style of crustal accretion (Fig. 10) are warranted. Bouguer gravity anomalies are consistently positive at OCCs and this suggests that mafic crust is thinner than average there. For Atlantis Massif, Blackman et al. (2008) model residual gravity anomalies to estimate that density equal to (unaltered) mantle dominates at subseafloor depths of ∼4.5 km beneath the domal core. This result holds even when the whole (local) crustal section is assumed to be gabbro (thus higher average density than a combined section of fractured basalt and gabbro). Similarly, decreases of crustal thickness of 1–2 km are predicted from gravity anomalies at the MAR 25°–27°N (Tucholke & Lin 1994; Tucholke et al. 1997), at FUJI dome on the SWIR (Searle et al. 2003) and the AAD (Okino et al. 2004) inside corner flanks that contain OCCs. However, in each of these areas the outside corner crust is predicted to be 0.5–1 km thicker than average for the segment. The clearest cases of this type of signal have been shown for the eastern Kane (Ballu et al. 1997) and Atlantis (MAR, Blackman et al. 2008) RTIs, where 15–20 km wide regions on the current outside corner (conjugate to an OCC) have negative residual anomalies of 15–20 mGal. Canales et al. (2004) determined that seismic Layer 2A is a few hundred metres thicker than average at the MAR 30°N outside corner (conjugate to Atlantis Massif). Thus, asymmetry in the style of magmatism/accretion is important in at least some cases.
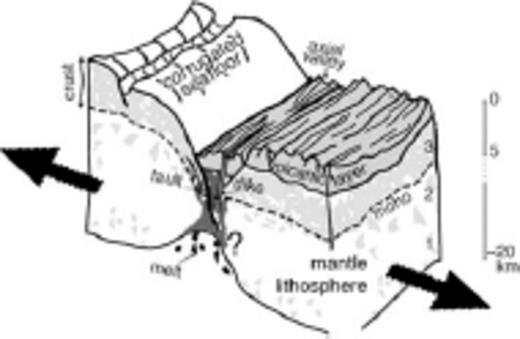
Sketch illustrating how detachment faulting and OCC development might lead to asymmetric crustal accretion (modified from Cannat et al. 2006). In this scenario, when the detachment fault is active the bulk of the volcanic extrusives are incorporated onto the outside corner lithosphere as it spreads from the axis. As an OCC develops, gabbroic crust, perhaps mixed with and/or surrounded by lenses of mantle peridotite, is unroofed by the detachment on the inside corner. Here Moho is inferred to be coincident with the crust/mantle boundary but other models suggest that alteration within lithosphere that is dominantly mantle peridotite could give rise to the seismic discontinuity.
4 Addressing Remaining Questions
It is crucial that comparable subsurface coverage of both flanks of a spreading centre where an OCC forms be obtained. Almost all studies to date focus intensively on the core complex while information on the conjugate (outside corner) lithospheric structure and properties is woefully limited. Given the extent to which current models proclaim relationships between magma supply and OCC formation this is a serious missing link. Currently, bathymetry, magnetics, and gravity data are available in several areas but very little seismic data covers the outside corner; what exists is not sufficient to address crustal thickness, much less more detailed internal structure.
The past decade's work on OCCs brings us to a stage where fully 3-D geophysical studies can play a key role for understanding OCC structure well enough that major advancement in models of their formation and evolution are likely. Such work will need to be accompanied by petrological/geochemical (both primary and alteration) studies in order for self-consistent model development. The need for 3-D geophysical work has two aspects: (1) Temporal and along-strike variability in lithospheric structure are crucial aspects of the processes that control whether oceanic rifting develops an OCC or not. (2) Uncertainties in geophysical inferences based on 2-D data in a 3-D structural, and likely compositional, environment can only be overcome with continuous coverage throughout the relevant region. Ideally such coverage would include the domal core(s) beneath exposed detachments, all immediately adjacent blocks, and some portion of the surrounding lithosphere that appears to represent ‘normal’ conditions for the section of a ridge segment being investigated. Two-dimensional tomography models assume homogeneity in the cross-profile direction, an assumption that is often violated in the highly heterogeneous setting of OCCs. Three-dimensional tomography studies can overcome this problem, although costs of data acquisition increase compared to 2-D surveys.
High resolution imaging and velocity analysis within the upper ∼1 km will be crucial for unravelling the extents of alteration and, in turn inferring the possible distribution of subsurface deformation, of the detachment fault system. With improved control on the upper kilometre structure, confidence in the distribution of geophysical properties at depth will increase, leading to more meaningful discussion of crustal production rates, variation thereof over time, and any systematic asymmetries in crustal accretion.
A means of discriminating between gabbro and partially serpentinized peridotite within the lithosphere would greatly aid understanding of OCC structure. The ratio of P- to S-wave velocity in gabbro can be distinguished from that for strongly altered peridotite (∼1.8 for gabbro versus ∼2.1 for serpentinite, Carlson & Miller 1997; Miller & Christenson 1997; Christensen 2004). Microseismicity studies that assess both shear and compressional velocity at ∼100-m-resolution, over a region extending on the order of 10 km both along- and across-strike, may be a viable approach. Use of converted phases from active-source seismic studies warrants investigation. Electromagnetic imaging methods may also be applicable, the conductivity properties of serpentinite generally being distinguishable from mafic rocks, although details of serpentine texture (ie. the distribution of secondary magnetite) and signatures of interfingered, variably oxide-rich gabbro sills will be important to assess (e.g. Ildefonse & Pezard 2001).
When solid documentation of the distribution mafic crust is in hand then the fundamental question of how any relationaship between OCC formation and melt distribution along spreading centres and/or over time varies can be addressed. However, getting to this point depends on knowing what and where Moho is in these environments. With current data, one can question whether the notion of a regionally continuous Moho is even a useful construct with which to assess processes that lead to OCC formation.
Finally, as micro- and macrostructural results (e.g. Escartín et al. 2003; Schroeder & John 2004) and (MacLeod et al. 2002; Karson et al. 2006) continue to become available, these can be applied to obtain estimates of effective lithospheric rheology (and variabilty thereof). Improved rheologic onstraints will aid in assessing the tectonic viability of geophysically constrained subsurface models, thereby improving our understanding of the structural evolution of OCCs as a whole, ideally their individual structural components as well.
Acknowledgments
We thank the following colleagues and reviewers whose comments on an initial version of this paper helped us improve the presentation. Jeff Gee, who helped on the magnetics section, Brian Tucholke, Tim Minshull and, in particular, Roger Searle.
References
