


Summary
On the Pacific margin off central Costa Rica, an anomalous lens-shaped zone is located between the overriding plate and the subducting oceanic lithosphere approximately 25 km landward of the deformation front. This feature was previously recognized in reflection seismic data when it was termed ‘megalens’. Its origin and seismic velocity structure, however, could not unambiguously be derived from earlier studies. Therefore during RV SONNE cruise SO163, seismic wide-angle data were acquired in 2002 using closely spaced ocean bottom hydrophones and seismometers along two parallel strike and two parallel dip lines above the ‘megalens’, intersecting on the middle slope. The P-wave velocities and structure of the subducting oceanic Cocos Plate and overriding Caribbean Plate were determined by modelling the wide-angle seismic data in combination with the analysis of coincident reflection seismic data and the use of synthetic seismograms. The margin wedge is defined by high seismic velocities (4.3–6.1 km s−1) identified within a wedge-shaped body covered by a slope sediment drape. It is divided into two layers with different velocity gradients. The lower margin wedge is clearly constrained by decreasing velocities trenchward and terminates beneath the middle slope at the location of the ‘megalens’. Seismic velocities of the ‘megalens’ are lower (3.8–4.3 km s−1) relative to the margin wedge. We propose that the ‘megalens’ represents hybrid material composed of subducted sediment and eroded fragments from the base of the upper plate. Upward-migrating overpressured fluids weaken the base of the margin wedge through hydrofracturing, thus causing material transfer from the upper plate to the lower plate. Results from amplitude modelling support that the ‘megalens’ observed off central Costa Rica is bound by a low-velocity zone documenting fluid drainage from the plate boundary to the upper plate.
1 Introduction
Convergent margins are dynamic plate boundaries characterized geomorphically by deep ocean trenches, seismically by landward dipping zones of earthquakes, tectonically by regional-scale crustal faulting and terrane movements, and magmatically by arcuate and linear belts of eruptive centres-the volcanic arc (von Huene & Scholl 1991). Convergent margins appear to fall into one of two classes, accretionary and non-accretionary/erosive (Clift & Vannucchi 2004). Subduction erosion at present dominates the Middle America convergent margin (Meschede et al. 1999a,b; Ranero & von Huene 2000; Vannucchi et al. 2001, 2003) where the frontal prism or outer wedge structure (Wang & Hu 2006) is limited to approximately 15 km adjacent to the trench axis (von Huene & Flueh 1994; Hinz et al. 1996). The process of subduction erosion is defined as the mass removal and transport of upper plate material toward subcrustal and mantle depth resulting in extension and subsidence of the forearc (Vannucchi et al. 2001, 2003). The recovery of shallow water sediment at Site 1042 (Fig. 1) documents margin-wide subsidence off Costa Rica during the past 16–17 Myr (Vannucchi et al. 2001). The short-term rate of removal of rock from the forearc in Central America was calculated to be about 107–123 km3 (Myr km)−1 (Vannucchi et al. 2003). Subduction of positive morphological features like seamounts, ridges, and rises have been reported to facilitate subduction erosion at convergent plate margins (von Huene 1986; von Huene et al. 2000; Miura et al. 2004; Kopp et al. 2006). In addition, hydrofracturing was proposed as a possible mechanism to explain the material removal from the base of the upper plate (Behrmann 1991; Le Pichon et al. 1993; von Huene & Ranero 2003). Separated upper plate fragments are subsequently dragged along the plate interface to subcrustal depth (von Huene et al. 2004).
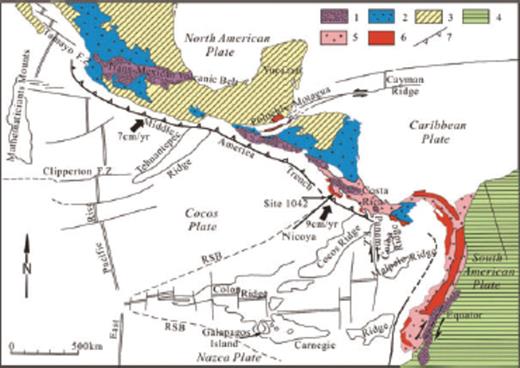
Tectonic setting of the Central America convergent margin (after Azéma et al. (1985)): (1) Pliocene and Pleistocene volcanism; (2) Oligocene and Miocene volcanism; (3) North America plate; (4) South America plate; (5) Cenozoic formations of ophiolitic Andes and southern Central America; (6) Mesozoic and Cenozoic ophiolitic complex; (7) Subduction zone. RSB: rough-smooth boundary.
In a previous study, multichannel seismic data (MCS) with 48 channels at a 4-ms sampling rate were acquired off central Costa Rica (R/V Sonne Cruise SO81 in 1992) (Hinz et al. 1996). On profile SO81 Line 4 (Fig. 2), a strong plate-boundary reflection bifurcates 25 km landward of the trench at about 5 s two-way traveltime (TWTT). This bifurcation extends laterally for about 15 km, the enclosed unit has been termed a ‘megalens’ by Flueh et al. (1999) and later also by Ranero & von Huene (2000) (Fig. 3). From seismic images of SO81 Line 4 two mechanisms of basal erosion were identified: One is erosion by seamount tunnelling and another is removal of large rock masses of a distending upper plate (Ranero & von Huene 2000). Sage et al. (2006) proposed fluid-rich trench sediment rapidly being underthrust along the Ecuadorian margin. The thin subduction channel here locally forms thickened lenses of sedimentary material resulting in interplate coupling variations (Tsuru et al. 2002; Sage et al. 2006). Ranero et al. (2008) proposed that tectonic erosion is closely linked to the presence of overpressured fluids migrating through the upper plate.
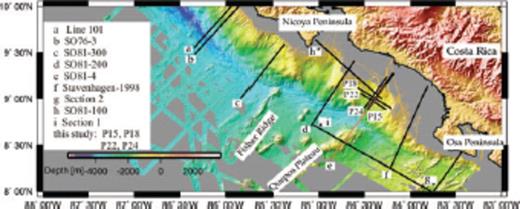
Location map of seismic wide-angle profiles offshore of Costa Rica with seafloor bathymetry illuminated from the NE. The positions of wide-angle profiles SO76-3, SO81-100, SO81-200 and SO81-300 are from Ye et al. (1996). Section 1 and section 2 are after Walther (2003). Line 101 is after Christeson et al. (1999). Stavenhagen-1998 line is after Stavenhagen et al. (1998). P15, P18, P22 and P24 profiles are from this study. SO81-4 (red line) used in this study is a MCS line coincident with our wide-angle profile 15.
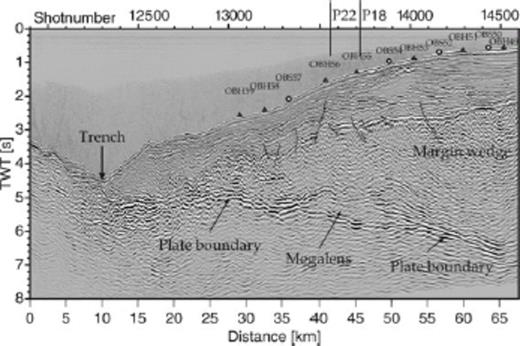
Time migrated section of SO81 Line 4. The ‘megalens’ is bounded by strong-amplitude reflections, which bifurcate from the plate boundary. OBH(S) stations along profile SO163-P15 are superimposed on Line 4. Black triangles mark OBH stations and circles mark OBS stations.
In this study, we use refraction seismic data acquired during cruise SO163 of the German R/V Sonne in 2002 (Weinrebe & Flueh 2002) to derive a detailed velocity-depth model along the continental slope of central Costa Rica. The newly acquired data resolve the velocity structure of the ‘megalens’. Our results imply a mixture composition of the ‘megalens’ consisting of subducted sediment and dismembered upper plate material in a fluid-rich environment.
2 Geodynamic Setting
The Farallon plate broke up into the Cocos plate and the Nazca plate along a pre-existing fracture zone about 25 Ma (Fig. 1). The Cocos Ridge and the Carnegie Ridge are interpreted as hotspot tracks formed at the Galapagos hotspot (Hey 1977). The Cocos plate is bordered by the East Pacific Rise, the Galapagos rift zone, the north-trending Panama fracture zone near 82° W, and the Middle America arc. The Middle America trench (MAT) is a convergent plate boundary that marks the subduction of the Cocos plate beneath Central America and Mexico with varying convergence rates (Fig. 1). An estimate for the Cocos-Caribbean convergence rate is 84 ± 5 mm yr−1, accompanied by a dextral, trench-parallel slip rate of 14 ± 2 mm yr−1 at 88–85.5°W (DeMets 2001; DeMets et al. 1990; 1994). The variable morphology of the Cocos plate off Costa Rica has been recognized from high resolution multibeam swath mapping (Fig. 2). Three morphotectonic domains were defined by von Huene et al. (1995, 2000). Fisher Ridge marks the boundary between the smooth segment off Nicoya Peninsula and the seamount segment to the south (Fig. 2). The Cocos Ridge segment off Osa Peninsula is a broad shallow domain to the south. The segmentation is implied to have an influence on the forearc structure and the seismogenesis of the subduction zone. The Quepos plateau is dated 14 Myr and the oldest part of Cocos Ridge near the MAT is 13–15 Myr. (Werner et al. 1999; Barckhausen et al. 2001). The isodepth contours of the Wadati-Benioff zone between the Nicoya Peninsula and Osa Peninsula is about 40 km and the dip angle of the Wadati-Benioff zone decreases from 84° under Nicaragua to 60° under central Costa Rica (Protti et al. 1995). Bending-related earthquakes along the MAT occur in the northwest of Costa Rica and no bend-faulting occurs in the vicinity of the thick-crust Cocos Ridge (Ranero et al. 2005).
3 Wide-Angle Experiment
3.1 Data acquisition and processing
During cruise SO163 in 2002 four profiles were collected, located approximately 25 km northeast of the Quepos plateau (SO163 P15, 18, 22, and 24, in Fig. 2). Wide angle profile 15 was shot coincident with the previous multichannel reflection seismic profile SO81 Line 4 (Hinz et al. 1996) (Fig. 2). In addition, a parallel wide-angle dip line and two perpendicular wide-angle strike lines were shot. Along the four profiles a total of 42 IFM-GEOMAR ocean bottom hydrophones (OBH) (Flueh & Bialas 1996) and 22 ocean bottom seismometers (OBS) (Bialas & Flueh 1999) were deployed. The average instrument spacing is about 2.5 km. The detailed station positions are displayed in Fig. 4. The sample rate for the instruments was 4 ms or 5 ms. Along each line, shots with two G-Gun clusters with a total volume of 1700 cinch were triggered at 30 s interval at an average speed of 3.5 knots, resulting in an average shotpoint distance of 54 m. Data quality for the majority of instruments is excellent. Wide-angle data processing included relocation of the instrument positions by analysis of the water wave arrivals. Frequency analysis of the data reveals that the signal is focused in a narrow frequency band. The main frequencies of arrivals recorded by OBH stations are between 9 and 16 Hz. A time- and offset-dependent frequency filter was applied to adjust for the time- and offset-dependent variations. Subsequently, a predictive deconvolution was applied to the data to improve the temporal resolution. Only selected record sections are shown here.
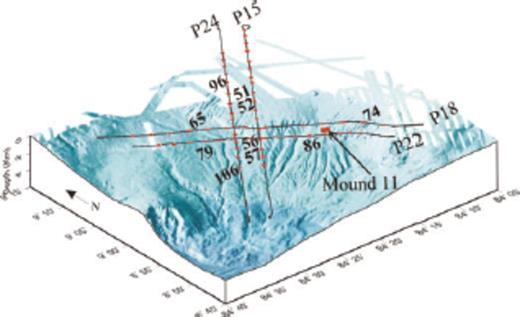
Detailed location map of wide-angle profiles in this study. 64 OBH(S) stations were deployed. Record sections from numbered OBH(S) stations are displayed in Figs 6–10 and Figs 12–15. The location of Mound 11 is from Soeding et al. (2003).
3.2 Modelling
3.2.1 Forward modelling
To image the structure of the margin and to obtain the P-wave velocity field, especially in the vicinity of the ‘megalens’, a 2-D forward modelling technique (Luetgert 1992) using a top-bottom approach was performed for all profiles. First and secondary arrivals were picked for all stations. Phase nomenclature is given in Table 1. The MCS data were used to constrain the upper units of the dip line P15, including the top of margin wedge, the periphery of the ‘megalens’, and the top of the downgoing slab (Fig. 3). The two strike-lines P18 and P22 were later tied to the dip-lines and thus further constrained the velocity-depth model along the continental slope off central Costa Rica (Fig. 5). The vertical velocity gradient within the different layers is constrained by the wide-angle data. However, the velocity gradient within the ‘megalens’ cannot directly be retrieved from the refraction data due to the velocity inversion. Therefore different velocity gradients were tested during the forward modelling until an optimal fit of phases from the ‘megalens’ and the upper oceanic crust was achieved.
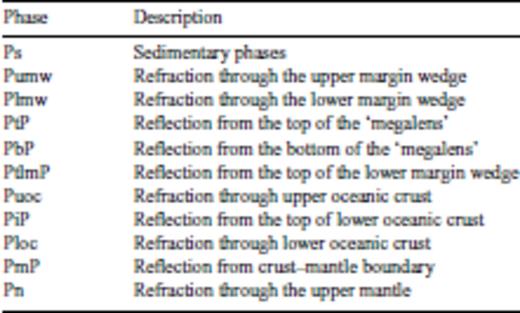
Phase nomenclature for wide-angle arrivals

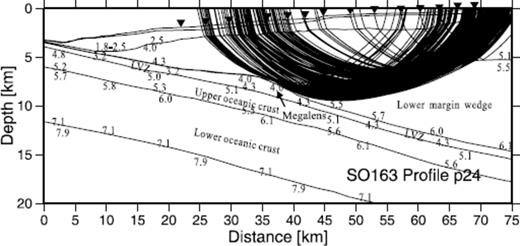
Four velocity-depth models along the Pacific margin of central Costa Rica. The subducted slab and the ‘megalens’ (located updip of the profile intersection) are recorded along the two dip-lines SO163 profile P15, P24 and two strike-lines P18 and P22. The detailed positions of OBH(S) and the P-wave velocities are marked on the profiles.
3.2.2 Amplitude modelling
The forward ray tracing modelling technique is limited to the use of traveltimes and does not utilize the seismic amplitude information. Some high amplitude events identified in the data were modelled by calculating synthetic seismograms, especially wide-angle reflection phases when their traveltimes were not sensitive enough to sharply define the velocity gradients or the nature of interfaces. The amplitude modelling was performed using the 1D reflectivity code of Sandmeier & Wenzel (1986). The 1-D velocity-depth model was provided by strike-lines P18 and P22. The modelling procedure is a trial-and-error process in which we propose a model consisting of many plane homogeneous layers, each showing a distinct P-wave velocity (Vp), S-wave velocity (Vs), density, and P and S attenuation quality factors Qp and Qs. Calculated synthetic seismograms were compared with the observed seismograms, until an optimal fit is realized. For our amplitude modelling, we used a constant Poisson ratio of 0.28 and set Qp = 2Qs (as used by Spudich & Orcutt 1980; Christeson et al. 2000). Qp was varied during modelling. A Qp value of 300–500 for the forearc region is in agreement with earlier observations (Bowman 1988). Densities were set to 1.5 g cm−3 for the slope sediments and 1.8 g cm−3 within the margin wedge (Kimura et al. 1997; Christeson et al. 2000). Densities for oceanic crust were calculated using the relationship ρ = 1.85 + 0.165Vp (Christensen & Shaw 1970; Christeson et al. 2000).
4 Interpretation
The crustal models of the Central Costa Rica margin along two parallel dip-lines and two parallel strike-lines are presented in Fig. 5. In the following, models are described individually from top to bottom, and related record sections are shown to demonstrate the fit between observed and modelled arrival times.
4.1 Dip-lines SO163-P15 and SO163-P24
4.1.1 Sediment
The sediment phase Ps is clearly observed on all record profiles and is modelled as a refraction through the sedimentary layer, which has a variable thickness of 500–1800 m, with P-wave velocities of 1.6–2.4 km s−1. This thickness is constrained by the MCS data (Fig. 3) and refraction phase Pumw from the upper margin wedge. The thickness of the sediment near the trench increases to 1.5 km (Fig. 5) at profile km 10 and displays velocities of 1.8–2.3 km s−1. The thickness of the sedimentary cover on the mid-shelf increases to 1.8 km beneath station OBH51 and the velocities reach 2.4 km s−1. Towards the coast, sediment thickness decreases to 500 m and the velocities reach a value of 2.1 km s−1.
4.1.2 Upper and lower margin wedge
The margin wedge is divided into two layers with different velocity gradients. Clear first arrivals observed on all OBH(S) stations are used to constrain the margin wedge (see refraction phases Pumw and Plmw through the margin wedge, Figs 6–10). The P-wave velocity of the upper margin wedge varies from 4.0 to 4.3 km s−1 near the trench to 4.0–5.1 km s−1 close to coastline (dip-line P24, Fig. 5). On the parallel dip-line P15 the velocity of the upper margin wedge varies from 4.1 to 4.5 km s−1 near the trench to 4.2–5.3 km s−1 near the coastline. Lateral velocity and thickness variations are observed along the two dip-lines (Fig. 5). Vertical velocity gradients are well constrained within the margin wedge by modelling of traveltime data because the reflection phase (PtlmP) from the top of the lower margin wedge and the refraction phase (Plmw) through this layer are clearly observed (Figs 6–9). Between stations OBH 105 to OBH 92 the interface between the upper and lower margin wedge is constrained with high confidence from the refraction phase Plmw (Fig. 11). The ray coverage through this layer is shown in Fig. 11 along the dip-line P24. The top and bottom velocity of the lower margin wedge increases with depth from 5.2 to 5.5 km s−1 and 5.5 to 6.1 km s−1, respectively. Near the landward edge of the ‘megalens’, the depth of this interface reaches to about 8 km and a lower margin wedge is not existent further seaward (beneath station OBH102, Fig. 11).
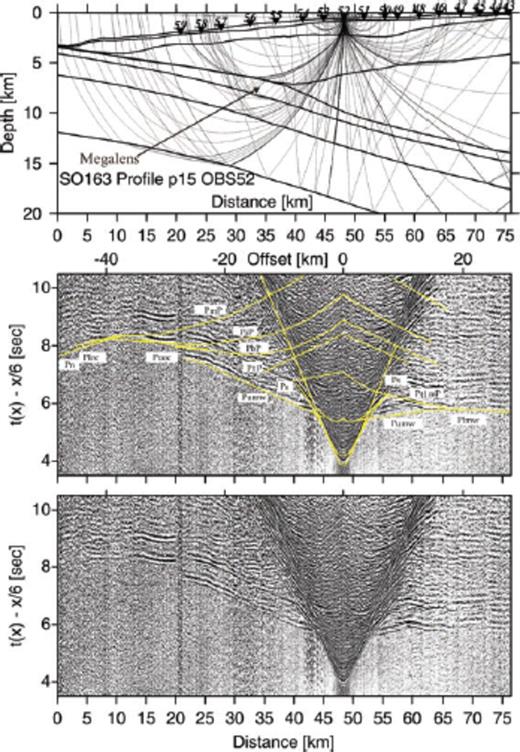
Record section from station OBS52 deployed along the dip-line SO163-P15. The uppermost image displays the ray paths through the model subsurface. The data are shown with modelled traveltimes overlain in the upper images and the raw data displayed in the lower section. See Table 1 for nomenclature. Refracted phases Puoc and Ploc and associated near vertical reflections PbP and PiP track the top of the upper oceanic crust and the top of the lower oceanic crust, respectively.
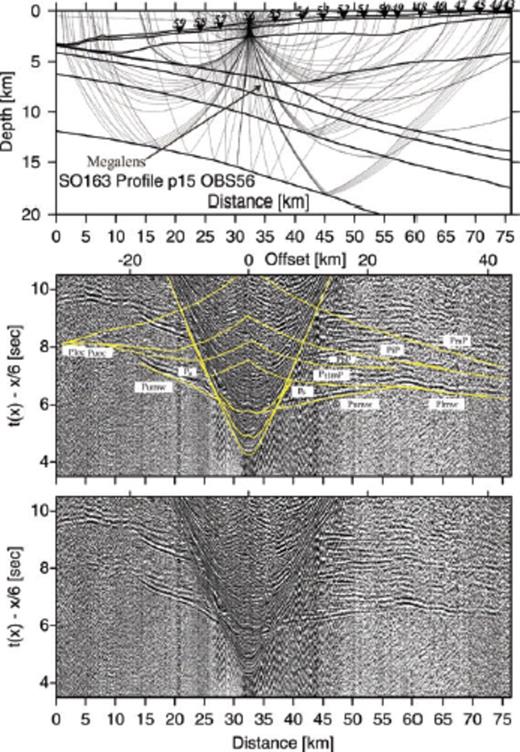
Record section and ray diagram for station OBH56 deployed along the dip-line SO163-P15. Please refer to Fig. 6 for display information. Phases PtlmP and Plmw track the lower margin wedge. Refraction phase Puoc tracks the upper oceanic crust. The oceanic crust-mantle boundary is tracked by PmP and Pn phase.
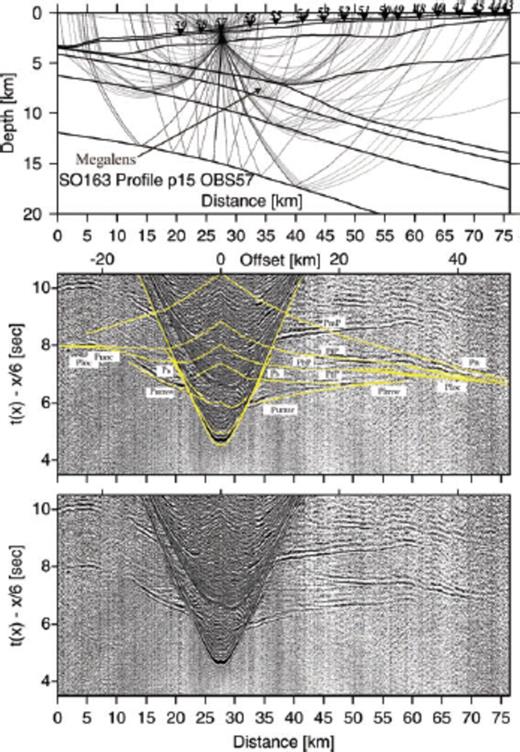
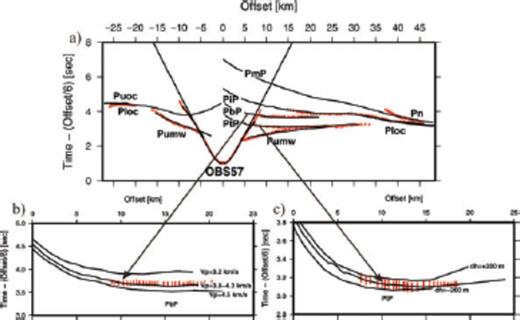
Record section and ray diagram for station OBS57 deployed along the dip-line SO163-P15. Please refer to Fig. 6 for display information. The oceanic crust-mantle boundary is recorded by phase Pn. Strong phases PiP and Ploc track the lower oceanic crust. The plate boundary is recorded as a pre-critical reflection PbP. Phase Plmw tracks the lower margin wedge and the top of the lower margin wedge is recorded as wide-angle reflection PtlmP.
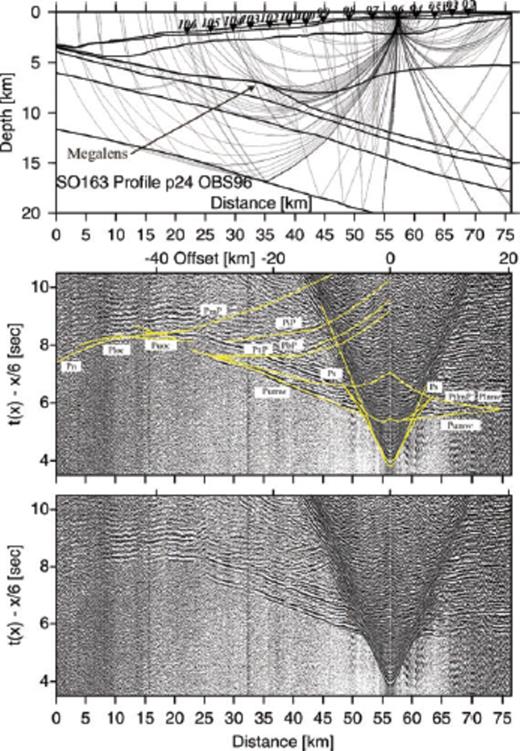
Record section and ray diagram for station OBS96 deployed along the dip-line SO163-P24. Please refer to Fig. 6 for display information. Phases Puoc and PbP track the downgoing slab. Phase Plmw travels through the lower margin wedge.
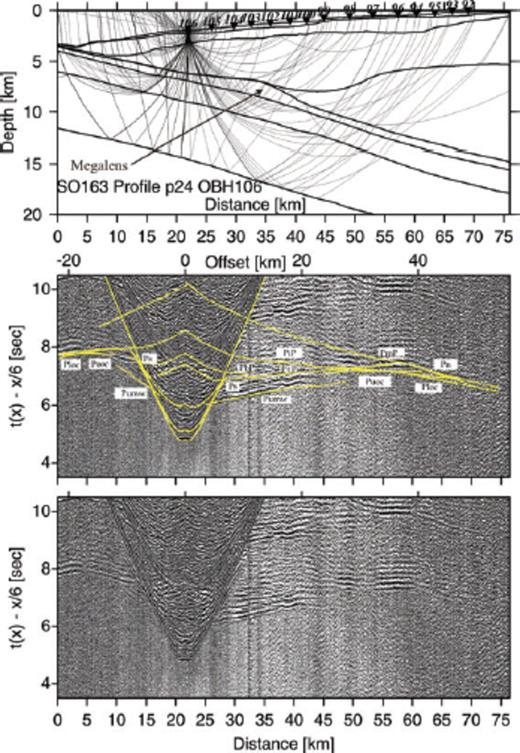
Record section and ray diagram for station OBS106 deployed along the dip-line SO163-P24. Please refer to Fig. 6 for display information. Phases Puoc and PbP track the downgoing slab. The oceanic crust-mantle boundary is tracked by PmP and Pn phase.
Ray coverage of the lower margin wedge displayed for dip-line P24. The top of the lower margin wedge is well constrained by the closely spaced OBH(S) stations in our velocity model.
4.1.3 ‘Megalens’ and low-velocity zone
The ‘megalens’ is clearly observed in the MCS data (Fig. 3). In our starting model the interface and thickness of the ‘megalens’ are preliminarily estimated from the reflection data. We observe the reflection phase PbP at the bottom of the ‘megalens’ and the refracted phase Puoc from the top of the oceanic crust, which are used to indicate the thickness/velocity ambiguity of the ‘megalens’ (Fig. 6, profile distance 15–20 km; Fig. 7, Fig. 10, profile distance 3–10 km). The uncertainty analysis will further show this ambiguity (see Section 4.4). A 1–1.5 km thick lens-shaped feature with velocities of 3.8–4.3 km s−1 best satisfies reflection arrivals as well as refraction arrivals through the upper oceanic crust.
A low-velocity zone overlaying the subducted plate is universally observed along the Costa Rica convergent margin. It was presented in previous wide-angle velocity models varying in thickness and velocity (Ye et al. 1996; Stavenhagen et al. 1998; Christeson et al. 1999). In our data, we observe a time delay of the slab refraction phase, which leads us to incorporate a low-velocity zone (LVZ) above the oceanic crust to improve the fit of calculated to observed traveltimes in our model (see phase Puoc, Figs 6, 7 and 10). Near the trench the thickness of the LVZ is about 400 m and we assume a constant velocity of 3.2 km s−1 for this layer, which is interpreted as subducted sediment. Beneath the margin wedge the strong plate boundary reflection is shown in the MCS data as well as on some wide-angle records (see phase PbP from these station records, Figs 6 and 8). Negative polarity reflections indicate the presence of the fluids at the plate boundary in Costa Rica (Ranero et al. 2008) and are related to the LVZ.
4.1.4 Upper and lower oceanic crust
The subducting oceanic crust is divided into two layers: upper oceanic crust and lower oceanic crust. Due to the complex geometry of the dipping slab and the seafloor morphology, refracted arrivals through the oceanic crust display some traveltime variability along the dip-lines. All arrivals through the upper and lower oceanic crust were observed and modelled. In Fig. 6 (OBS52) a distinct high amplitude event is observed at profile km 12–20. It is interpreted as a refraction phase Puoc through the upper oceanic crust, which has a high-velocity gradient and therefore focuses the energy into a short offset interval. A refraction phase Ploc through the lower oceanic crust was observed on some records (Fig. 6, profile distance km 0–10; Fig. 8, profile distance km 0–8 and 60–73; Fig. 9 and Fig. 10). A clear reflection phase PiP is visible at a distance of 41–60 km (Fig. 8), which is interpreted as a reflection from the interface between upper and lower oceanic crust. A short refraction phase Pn through the upper mantle is visible in the record of OBS57 at a distance of 66–73 km (Fig. 8) and in the record section of OBS106 (Fig. 10) at a distance of 61–68 km. These refracted and reflected phases constrain a 2–2.5 km thick upper oceanic crust with velocities of 5.0–5.5 km s−1 and a 5.5–6 km thick lower oceanic crust with velocities of 5.8–7.1 km s−1 (Fig. 5).
4.2 Strike-lines SO163-P18 and SO163-P22
Strike-lines P18 and P22 were deployed perpendicular to the two dip lines. Along line P18 a high velocity lower margin wedge is observed and modelled (Figs 12 and 13). Beneath the lower margin wedge a thin LVZ is assumed based on the model result of dip-line P24. A clear refraction phase Pumv through the upper margin wedge with velocities ranging from 4.3 to 5.0 km s−1 was recorded on all stations (Fig. 5). The thickness of the upper margin wedge is 5.1 km in northwestern part and decreases to 3.1 km in southeastern part (Profile 18, Fig. 5). It is also found at a more shallow depth when approaching Osa Peninsula. The top of the lower margin wedge is constrained by a clear reflection phase PtlmP and refraction phase Plmw at profile distance km 40–45 (Fig. 12). A distinct plate boundary reflection phase PbP is seen on most record sections (Figs 14 and 15). In Fig. 14, the refraction phase Ploc with velocities of 6.0–7.1 km s−1 through the lower oceanic crust is observed at profile distance km 40–45. In Fig. 15, a refraction phase Puoc through the upper oceanic crust with velocities of 5.1–5.6 km s−1 is observed and it can be used to constrain the bottom interface of the ‘megalens’/plate boundary. On line P22, the deep phases Pn and PmP were not observed on any station records and the Moho cannot be constrained on this line. If the result from the dip line is projected along the profile, it should appear at offsets of 23 km at about 16 km depth (Fig. 5).
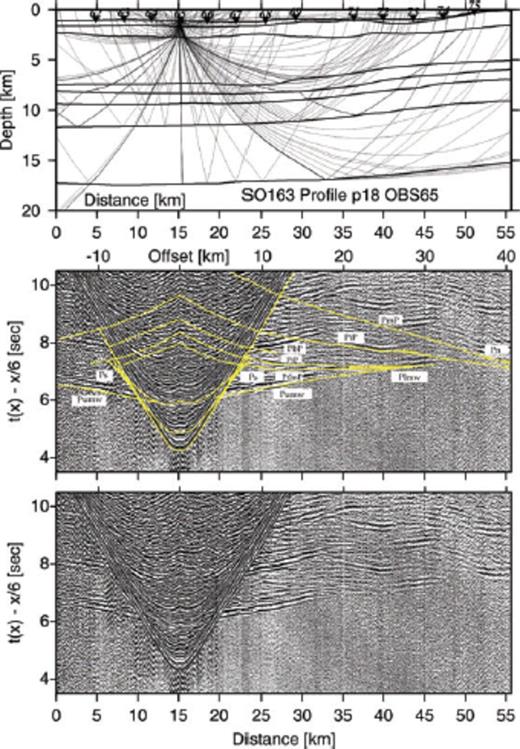
Record section and ray diagram for station OBH65 deployed along the strike-line SO163-P18. Please refer to Fig. 6 for display information. Strong phases PtlmP and Plmw track the lower margin wedge. The reflection phase PiP tracks the top of the lower oceanic crust. The oceanic crust-mantle boundary is recorded as reflection PmP.
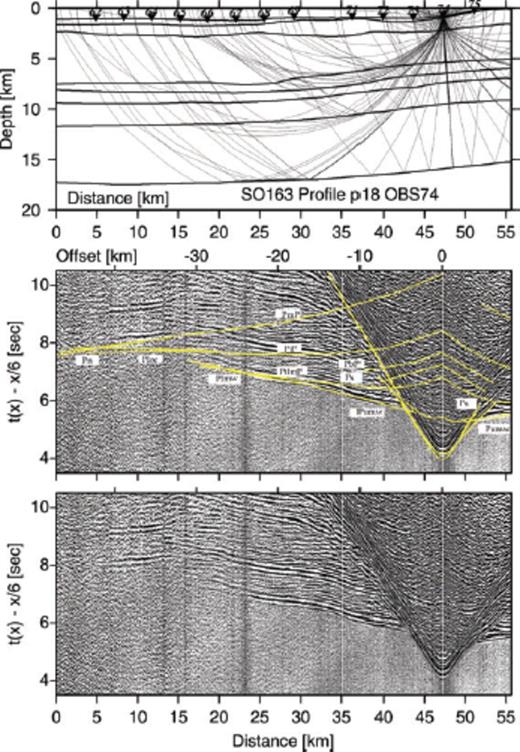
Record section and ray diagram for station OBH74 deployed along the strike-line SO163-P18. Please refer to Fig. 6 for display information. Phase Plmw travels through the lower margin wedge. The oceanic crust-mantle boundary is tracked by phases PmP and Pn.
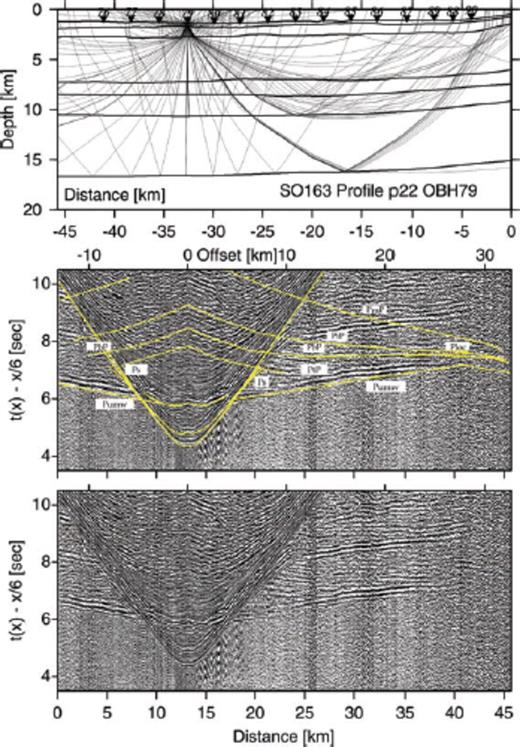
Record section and ray diagram for station OBS79 deployed along the strike-line SO163-P22. Please refer to Fig. 6 for display information. The pre-critical reflection phase PtP tracks the top of the ‘megalens’. The plate boundary reflection PbP tracks the downgoing slab. The reflection phase PiP records the top of the lower oceanic crust and the refraction phase Ploc travels through the lower oceanic crust.
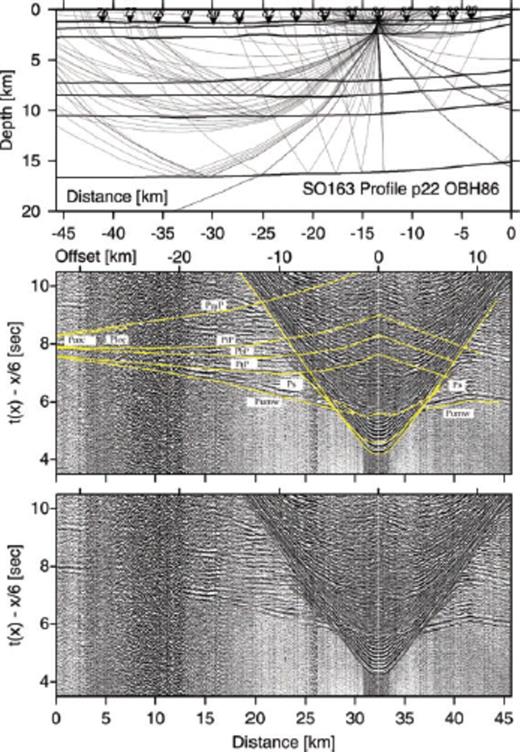
Record section and ray diagram for station OBH86 deployed along the strike-line SO163-P22. Please refer to Fig. 6 for display information. The pre-critical reflection phase PtP tracks the top of the ‘megalens’. Phases Puoc and PbP track the downgoing slab.
4.3 Amplitude modelling of wide-angle data
Along the two strike-lines there are only minor lateral velocity variations. Thus we can use the reflectivity method (Fuchs & Mueller 1971; Mueller 1985; Sandmeier & Wenzel 1986) for 1-D amplitude modelling. See Section 3.2.2 for details on parameters and calculations. A comparison of the data to synthetic seismograms is displayed for OBH 88 in Fig. 16. OBH 88 records the subducting plate beneath the bottom of the ‘megalens’ at about 8 km depth. Using the 1-D velocity-depth function gained from the forward modelling as a reference model, we adjust the vertical velocity gradient within the margin wedge to match the amplitude-versus-offset variations. A vertical velocity gradient of approximately 0.22 s−1 and constant Qp values of 50 within the margin wedge will reproduce the refracted phase through the upper margin (Pumw) within 30 km offset (Figs 16a–c). A decrease of the vertical velocity gradient by 0.03 s−1 will enhance the appearance of the Pumw arrivals at offsets larger than 30 km (Fig. 16e). The refraction through the upper margin wedge (Pumw) as well as the reflection from the plate boundary (i.e. bottom of the ‘megalens’) and the top of the LVZ are well reproduced (Fig. 16b). Reflection amplitudes from the bottom of the ‘megalens’ increase from 11 km offset, whereas significant amplitudes from the reflection PbP appear at offsets of about 11–19 km (Fig. 16a). The velocity-depth profile used for the amplitude modelling is shown in Figs 16c and e. A 200–250 m thick layer of decreased velocities above and below the ‘megalens’ can best reproduce the reflection similar to the original data. Although the appearance of the reflection phases from two extreme low-velocity layers is obscure due to noise and the interference with the multiple, they still may be discerned in the data (marked by arrows in Fig. 16a) and in the synthetic seismogram. The appearance of all other record sections is rather similar. The plate boundary is clearly indicated by a bright reflection in the MCS data and the amplitude of this reflection was explained by the presence of sediment and elevated pore pressure (Flueh et al. 1999). The amplitude modelling suggests that the ‘megalens’ is bounded by a low-velocity zone. Minor discrepancies in the traveltimes of real and synthetic data must be expected due to ray focusing and defocusing effects (Kopp et al. 2001).
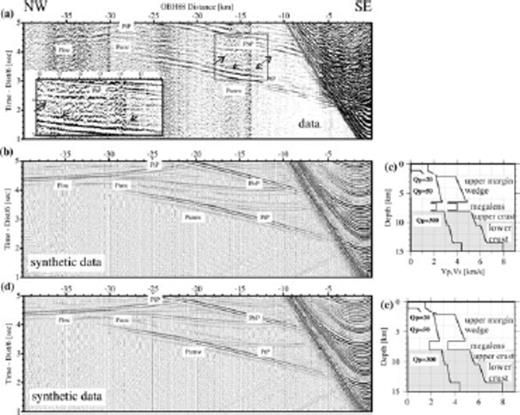
1-D reflectivity modelling for OBH 88 deployed along the strike-line P22. (a) The different seismic phases are identified from the data of OBH 88. Phase PtP shows the reflection from the top of the first LVZ and PbP shows the reflection from the bottom of the second LVZ. The arrows show the reflections from the bottom and top of the two extreme low-velocity thin layers. Lower inset shows an enlarged part indicated by a box in the data. (b) shows the preferred synthetic seismogram matching the data and (c) displays the corresponding velocity-depth profile. (d) The low velocity gradient within the margin wedge and only one LVZ in the velocity-depth profile are shown for comparison. Reflections from a single LVZ cannot adequately match the data. Source signal input is a 12.5 Hz Fuchs–Mueller signal. In the P- and S-wave velocity-depth profiles, the depth range of the subducted slab is grey shaded.
4.4 Model sensitivity and uncertainty tests
Sensitivity analysis of the velocity and the geometry of the ‘megalens’ were done by changing the interlayer seismic velocities and the depths of the top interface of the ‘megalens’ using the forward modelling tool ‘MacRay’ (Luetgert 1992). Fig. 17 shows the match between the observed and predicted traveltimes for different seismic velocities and fixed top and bottom interfaces of the ‘megalens’. Assuming a constant seismic velocity of 3.2 km s−1 or 4.5 km s−1 within the ‘megalens’ does not fit well the predicted traveltime (phase PbP) within the assigned 50 ms picking uncertainties [root mean square (rms) misfits >80 ms] (Fig. 17b). The best match of the calculated traveltime curve to the observed data is achieved if we assume seismic velocities that increase linearly from 3.8 to 4.3 km s−1. Fig. 17b shows that the traveltime curve is also strongly sensitive to depth changes (±200 m) of the top interface of the ‘megalens’.
Sensitivity tests of the velocity and the geometry of the top and the bottom of the megalens demonstrated for OBS57. P-wave velocities of 3.2, 3.8–4.3, and 4.5 km s−1 within the layer of the megalens were calculated and compared to the observed traveltimes (b). Two different depths (±200 m) of the top interface of the megalens were chosen to show the fitting of the traveltime curve. Observed traveltime picks with 50 ms error are shown in red.
To assess the uncertainties of the velocity field and the depth of the reflector, we used the tomographic inversion method of Korenaga et al. (2000) to apply a nonlinear Monte Carlo method (Tarantola & Valette 1982; Tarantola 1987; Korenaga et al. 2000). We constructed 100 Monte Carlo ensembles by inverting data with random errors with random initial velocity models. The 100 2-D initial velocity models were built by adding velocity values (randomly chosen between certain predefined limits) on a reference model beneath the basement. In addition, 100 noisy traveltime data sets were constructed by adding random phase errors (±50 ms) and common-receiver errors (±50 ms) on the original data set (Zhang & Toksöz 1998; Korenaga et al. 2000). Finally, we inverted each velocity model and corresponding reflector together with a noisy data set to estimate the influence of the starting model and the effect of realistic traveltime errors. We applied a top-bottom strategy to run the inversion step for each reflector, respectively. We applied the random velocities on our 2-D forward model of P15 including two floating reflectors (top and bottom of the ‘megalens’, random variations within ±1 km) in the upper plate and one reflector (Moho, random variations within ±2 km) in the lower plate. After 10 iterations of the inversion process, 100 inversion velocity models for the first reflector updated as 100 initial models for the second reflector. Traveltime rms misfits reduced dramatically from the beginning several hundred millisecond to about 70–90 ms and allowed us to assess the uncertainty of the velocity field.
The average and uncertainty of model parameters obtained by averaging all Monte Carlo solutions and computing the corresponding standard deviation is shown in Figs 18(a), (c) and (e). Velocity uncertainties of the upper plate are usually lower than 0.15 km s−1 within the margin wedge and are lowest (<0.05 km s−1) in the upper margin wedge. Uncertainties are slightly higher within the lower margin wedge (0.06–0.16 km s−1) because of sparse ray coverage (Fig 18b). The largest velocity uncertainties occur within the LVZ (‘megalens’) and reach up to 0.15 km s−1 (Fig 18c). The depth uncertainties of the first and the second reflector are small and reach up to about 500 m within the range of ray coverage. The velocity uncertainties within the subducting oceanic crust are larger (0.06–0.15 km s−1) because of the limited amount of available data (Figs 18e and f). The Moho depth uncertainties show values around ±1.5 km. In general, the uncertainties for upper plate are lower than in the lower plate and the velocity structure and geometry of the ‘megalens’ is a robust feature of the tomographic solutions.

Standard deviations for velocity and reflector depth nodes derived by 100 Monte Carlo ensembles (a, c, e) and corresponding derivative weight sum from the average 100 realizations (b, d, f). Red lines show the average depth of reflectors and contours are drawn at 0.02 km s−1 interval (a, c, e).
5 Discussion
5.1 Margin wedge
Below the cover of slope sediment, the margin wedge is defined by high velocities (4.3–6.1 km s−1). Based on the P-wave velocity variations we divide the margin wedge into the upper margin wedge with velocities ranging from 4.3 to 5.0 km s−1 and the lower margin wedge with velocities from 5.2 to 6.1 km s−1. The top of the upper margin wedge is clearly imaged in the MCS data set and also reliably modelled based on the wide-angle data. Its top is cut by numerous normal faults and indicates the extensional forearc stress environment (Fig. 3). The interface separating the upper and lower margin wedge is defined by a sharp velocity increase from 5.1 to 5.5 km s−1 and is well constrained by our data (see Fig. 11). The relative high velocities of the lower margin wedge result in a velocity inversion at the transition to the subducted plate landward of OBS101 (P24) and OBS54 (P15). The lower margin wedge terminates underneath the middle slope beneath OBH(S) station 102 and 55. On strike-line P22 it is not observed.
The origin and composition of the margin wedge is defined by geophysical observations and by comparison to neighboring stratigraphic sections onshore. The margin wedge off Nicoya and Central Costa Rica was interpreted as an offshore extension of the Nicoya Complex ophiolitic rocks (Ye et al. 1996; Stavenhagen et al. 1998; Christeson et al. 1999; Sallarès et al. 2001). The uppermost unit of the Nicoya Complex onshore was constrained by land shots and shows velocities varying from 4.2 to 4.9 km s−1. The middle unit of the Nicoya Complex displays velocities landward of the coastline varying from 4.6 to 5.5 km s−1 and velocities at the top of wedge varying from 3.6 to 4.7 km s−1 (Christeson et al. 1999). Our results for central Costa Rica show that the upper margin wedge is characterized by velocities varying from 4.0 to 5.2 km s−1. An across-strike increase of velocities from 4.0 km s−1 at approximately 12 km landward of the trench to 4.4 km s−1 off the coastline (Fig. 5) is observed. The lower Nicoya complex (Christeson et al. 1999) corresponds to our lower margin wedge in terms of velocities. It indicates a low-velocity gradient, but the velocity also decreases trenchward from 5.5 to 5.0 km s−1. This velocity information suggests that the upper and lower margin wedge can be interpreted as an offshore extension of the upper and the lower Nicoya complex.
The extent of the lower margin wedge within the forearc was not identified from previous wide-angle seismic studies. Previous seismic profiles could not resolve the transition between the upper margin wedge and the lower margin wedge (Ye et al. 1996; Stavenhagen et al. 1998; Christeson et al. 1999; Sallarès et al. 1999, 2001), whereas our data constrain the extent and termination of this layer. The corresponding dense ray coverage is shown in Fig. 11.
Based on the approach of Clift & Vannucchi (2004) we calculate the average slope angle over a distance of 50 km to eliminate small-scale anomalous trends. A large slope angle (>8°) occurs close the trench over a distance of 5 km. The mean forearc slope angles are 3.2° for dip-line P15 and 3.8° for dip-line P24. The average dip angles of the oceanic plate are 9.0° for P15 and 9.1° for P24. These parameters then yield forearc tapers of 12.2° for P15 and 12.9° for P24, which are larger than observed to the northwest at 86°W (taper angle of 7.6°) and smaller than for Mexico (99°W), Guatemala (91°W) and Nicaragua erosive margins documented by Clift & Vannucchi (2004), but fall well within the range of erosive margins.
5.2 ‘Megalens’ and LVZ
Subducted sediment overlying the oceanic igneous crust is observed all along the convergent Pacific margin offshore Costa Rica and is manifested in a LVZ (Ye et al. 1996; Stavenhagen et al. 1998; Christeson et al. 1999). Along our dip lines, the LVZ shows a constant velocity of 3.2 km s−1 from the trench to approximately 20 km landward of the deformation front. The LVZ extends beneath the margin wedge with velocities increasing to 4.3 km s−1 at depths exceeding 10 km (Fig. 5). The ‘megalens’ is concealed between the margin wedge and the subducted slab, and was first identified on MCS profile SO81 Line 4 (Hinz et al. 1996). We iteratively converted our velocity-depth model of P15 in two-way time to match the MCS data. In our model refracted phases from the upper oceanic crust and reflection phases from the bottom of the ‘megalens’ are observed and modelled on several OBH(S) stations, therefore we can be confident to constrain the bottom velocity of the ‘megalens’ with 4.3 km s−1. The amplitude modelling reveals a LVZ bounding the ‘megalens’, which coincides with the high amplitudes observed in the MCS data.
Gravity surveys in our study area show a broad negative free-air anomaly (–50 to –30 mGal) (Barckhausen et al. 1998), whereas seamounts and the Quepos plateau generate a positive gravity anomaly. A gravity model by Barckhausen et al. (1998) distinguishes between a model with and without a seamount. Their calculated positive gravity anomaly indicates a buried seamount beneath the margin, however, along our profiles, the gravity pattern cannot be correlated to a possible subducted seamount model. Subducted seamounts have however been detected at different margins worldwide: a 13 km thick × 50 km wide seamount at a depth of 10 km was imaged in the Nankai subducted zone (Kodaira et al. 2000), with P-wave velocities of 5 km s−1 increasing to 7.2 km s−1. By comparison, the size of the ‘megalens’ is much smaller (1.5 km thick × 15 km wide) and its seismic velocities are lower (3.8–4.3 km s−1). This is also true in comparison to the Moresby seamount in the Woodlark Basin (Vp > 6 km s−1) (Zelt et al. 2001). At the central Ecuador margin, an 8 km long f 0.7 km high sediment lens at approximately 4 km depth was identified from seismic images (Sage et al. 2006). This sediment lens is much smaller than the Costa Rica ‘megalens’ (Fig. 19a) and is interpreted as material accumulated in the wake of a subducting seamount. Based on our observations, the ‘megalens’ cannot be explained by a seamount tunnelling mechanism.
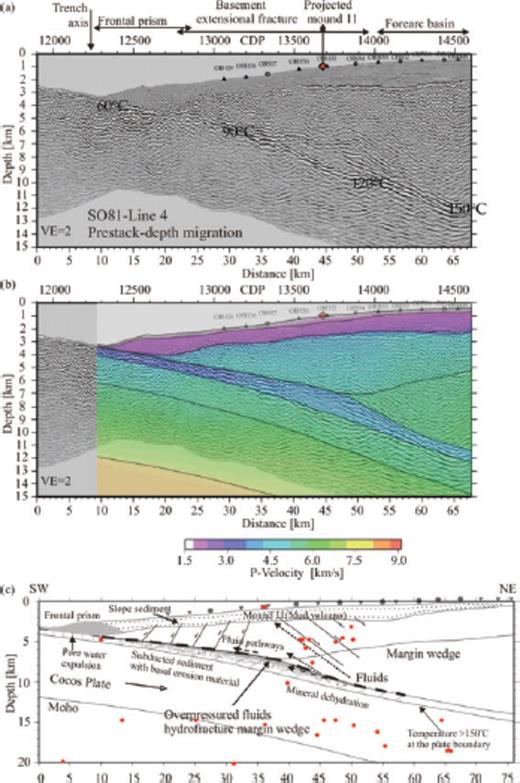
Seismic image and the interpretative velocity structure of the central Costa Rica subduction zone. (a) Prestack depth-migrated SO81-Line 4 (Ranero & von Huene 2000). Basement extensional fractures are indicated by normal faults. The OBH(S) stations are marked on the seafloor. The location of Mound 11 (mud volcano) is projected onto the Line 4 (see Fig. 4 for a detailed location). Plate-boundary temperatures are from Ranero et al. (2008). (b) Superimposed image of MCS Line 4 and the seismic velocity field of Profile 15. (c) The interpretative model of the basal erosion structure. Fluids are generated by mineral dehydration and transported upward to the mound site (Hensen et al. 2004; Ranero et al. 2008). Red dots indicate local seismicity (Dinc et al. 2007).
5.3 Subducted oceanic crust
The igneous oceanic crust is divided into an upper and a lower crustal layer with varying velocity gradients. On the two dip-lines, the refracted and reflected phases constrain the interface within the oceanic crust (Figs 6–10). The strong reflections from the plate boundary are all clearly observed (Figs 6, 8–9). Deeper PmP and Pn phases are observed on a number of stations (OBS57, Fig 8; OBH106, Fig. 10; OBS74, Fig. 13), and provide some constraint on the deep part of the model. On the strike-line P18, due to the higher velocities of the lower margin wedge (5.2–5.5 km s−1) with respect to the upper oceanic crust, no refracted waves from the upper oceanic crust can be observed, but the strong wide-angle reflection PiP and pre-critical reflection PbP can be used to constrain the interfaces within the oceanic crust (Fig. 12). At Quepos plateau, a 3-km-thick basalt layer was interpreted as upper crust Layer-2A (Walther 2003). Along our profile, the oceanic crust shows an increased thickness of 7.5–8 km corresponding to crustal thickening towards Cocos Ridge. Line SO81-200 to the north (line d in Fig. 2) displays a crustal thickness of 7.0 km (Ye et al. 1996), whereas the oceanic crust to the south increases to a thickness of 14 km along the neighboring refraction profile (line f in Fig. 2) (Stavenhagen et al. 1998), which is located on the flank of the Cocos Ridge.
5.4 The nature of the ‘megalens’
Understanding the nature and origin of the ‘megalens’ may be important to the concept of basal erosion in convergent margins. The nature of the ‘megalens’ was not unambiguously resolved since its first imaging in 1992 due to a lack of detailed seismic velocity information. This study clearly precludes a seamount origin.
Along the plate boundary fluids play an important role to facilitate basal erosion of the upper plate (Le Pichon et al. 1993; von Huene & Ranero 2003; Sallarès & Ranero 2005; Ranero et al. 2008). Initial sediment dewatering processes involve pore water squeezed from the subducted sediment at temperature domains of <60°C (Fig. 19a). At greater depth and increased temperatures of 50–160°C, mineral dehydration reactions pose the dominant process generating fluids at the plate boundary (e.g. Moore & Vrolijk 1992; Hensen et al. 2004). Along the upper boundary of the ‘megalens’ the expected temperatures fall between 100 and 120 °C (compare Fig. 19). As suggested by Ranero et al. 2008, plate boundary fluids will migrate upward through the fractured upper plate where they are detected at seeps. In the vicinity of our seismic line, expulsion of fluids generated at deep structural levels occurs at Mound 11 mud volcano (Hensen et al. 2004) (Figs 4 and 19a). Geochemical evidence from Cl-depleted fluid samples of Mound 11 (see Fig. 4 for location) and other seeps along the Costa Rica margin (Hensen et al. 2004) as well as the inverse amplitude polarity of the plate boundary reflections (Ranero et al. 2008) suggests a deep origin of the fluids. Compaction, increased porosity, loss of sediment and the smectite-illite transition can raise the seismic velocity of sediment to ∼4 km s−1 at about 8 km depth (Sage et al. 2006), thus increasing the velocity to values comparable to the ‘megalens’ seismic velocities. The observed velocities of 3.8–4.3 km s−1 in the ‘megalens’ may best be explained by a hybrid composition, consisting of subducted sediment, fractured upper plate material and fluids. The lens-shaped feature is part of a LVZ (Fig. 19b), however, the modelled velocities are higher than the seismic velocities of 2.2–2.8 km s−1 determined for sediment lenses at the Ecuador margin (Sage et al. 2006). An exclusive composition of subducted trench sediment is less likely due to the higher velocities as well as much larger dimensions of the Costa Rica ‘megalens’ compared to the Ecuadorian sediment lenses.
The fate of the ‘megalens’ remains enigmatic: its current position aligns with the lower margin wedge and the onset of local seismicity beneath the middle slope. The microseismicity events from a local network (Dinc et al. 2007) are projected onto the velocity model in Fig. 19b and indicate the distribution of the intraplate seismicity and oceanic crustal seismicity. The lack of the microseismicity over the ‘megalens’ suggests slow displacement there.
6 Conclusions
The modelling and interpretation of the seismic wide-angle data, combined with coincident seismic reflection data and amplitude modelling, have enabled us to construct a detailed velocity-depth model covering the Pacific margin of central Costa Rica. The data clearly define two layers within the margin wedge, the high velocity gradient upper margin wedge with velocities of 4.3–5.0 km s−1 and the reduced velocity gradient lower margin wedge with velocities ranging from 5.2 to 6.1 km s−1. The leading edge of the lower margin wedge terminates above the ‘megalens’ about 32 km landward of the trench. The two strike-lines confirm the seaward termination of the lower margin wedge. The ‘megalens’ is 15–20 km wide and has a thickness of 1–1.5 km. Its seismic velocities fall between 3.8 and 4.3 km s−1 and are clearly much lower than the velocities of subducted seamounts or plateaus. The ‘megalens’ is a low velocity body with respect to the margin wedge above and is bounded by thin layers of lower velocities above and below. Our preferred interpretation is that the ‘megalens’ is a mixture product, which consists of a buried sedimentary mélange including rocks sheared from the lower plate and highly fractured material derived from the upper plate by basal erosion. The LVZ above the ‘megalens’ shows a discontinuous amplitude distribution in the seismic image (Fig. 19a) and is caused by fluids and associated localized pore pressure anomalies.
Acknowledgments
We are grateful to all colleagues and participants of Cruise SO163 for their help with data acquisition and processing, particularly to the skillful crew of the RV Sonne. Data acquisition was supported by the BMBF (grant 03G0163A). Reviews by F. Klingelhoefer and J.-Y. Collot and one anonymous reviewer, and comments by the Editor greatly improved our manuscript. We are grateful to R. von Huene and C. Ranero for their constructive comments and suggestions to improve the manuscript. We used the GMT software (Wessel & Smith 1991) to plot several figures. JZ gratefully acknowledges a scholarship granted by the German Academic Exchange Service (DAAD). This publication is contribution no. 156 of the Sonderforschungsbereich 574 ‘Volatiles and Fluids in Subduction Zones’ at Kiel University.
References
