


Summary
Receiver functions (RFs) from station PKD located ∼3 km SW of the San Andreas Fault (SAF) samples the Salinian terrane near Parkfield. Crustal multiples indicate a 26-km-thick crust with a VP/VS of 1.88, which is slightly lower (1.83) for the upper and middle crust in the west. For the mid-crust, arrivals are observed at times corresponding to recently imaged seismic reflectors and may correspond to a layer of metasedimentary rocks below the base of the granitic batholith exposed at the surface. For the lower crust, RFs display strong polarity reversals with backazimuth and a change in Moho amplitude that require strong seismic anisotropy (>15 per cent) in a low velocity, high VP/VS, possibly serpentinite or fluid filled schist layer that has a ENE dipping (∼35°) rock fabric. Similar patterns of amplitude variations and polarity reversal observed in RFs for some southern California stations located west of the SAF support the hypothesis that the cause of these data characteristics is a regionally prevalent lower crustal anisotropy. The orientation of this anisotropic fabric is inconsistent with the recent San Andreas sense of shear and is most likely a fossilized fabric of past eastward-directed (Farallon Plate) subduction.
1 Introduction
A major question in continental dynamics concerns the nature of deep crustal deformation along continental strike-slip faults. In this respect, the San Andreas Fault (SAF) near Parkfield is one of the most well studied strike-slip faults in the world and is a prime target to address this question. At this location, the SAF shows a transition from the creeping to the locked sections of the fault and separates Salinian granitic basement on the southwest from Franciscan mélange on the northeast that results in a strong lateral seismic velocity contrast in the upper crust (Eberhart-Phillips & Michael 1993). As part of EarthScope, the San Andreas Observatory at Depth (SAFOD) started drilling into the fault zone at seismogenic depths, where repeating earthquakes take place (Hickman et al. 2004). In the region, Boness & Zoback (2006) detected shear wave anisotropy from local earthquake sources, which project to the surface several kilometres southwest of the main trace (Nadeau & McEvilly 1997). Detailed geophysical studies also revealed a 3 km deep highly fractured fault-bounded sedimentary wedge just southwest of the SAF, which is characterized by low seismic velocity, high VP/VS, low electrical resistivity and seismic anisotropy (Unsworth et al. 1997; Thurber et al. 2003; Boness & Zoback 2004; Hole et al. 2006; Roecker et al. 2006). Recent seismic and Magnetotelluric (MT) studies at Parkfield are just beginning to reveal some details of the deep structure of this region (Bleibinhaus et al. 2007; Becken et al. 2008). In this paper, we used teleseismic data recorded at the nearby broad-band seismic station PKD and analysed receiver functions (RFs) to constrain the deep crustal structure, including crustal thickness, VP/VS and seismic anisotropy.
2 Receiver Functions Analysis
Seismic station PKD has been operational since 1996 as part of the Berkeley Digital Seismic Network and is located on a Salinian granite outcrop ∼3 km southwest of the SAF and ∼3 km south of the SAFOD drilling site (Fig. 1). To image the crustal structure near SAF, we analysed over 200 high quality P waveforms from teleseismic earthquakes (M ≥ 6), recorded at this broad-band station during the last decade. RFs are deconvolved waveforms that consist of P to S conversions and their multiples from seismic impedance contrasts at depth. The RFs in this study are computed using an iterative time-domain deconvolution algorithm with a cut-off frequency of ∼1 Hz (Ligorria & Ammon 1999). After removing poorly deconvolved events with variance reductions less than 80 per cent, the Moho piercing points of the over 100 remaining RFs are projected into the map (Fig. 1a).
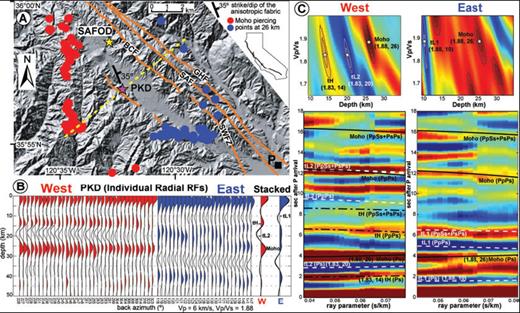
(a) Shaded relief map of the region near station PKD (taken from USGS). Moho piercing points of RFs are colour-coded circles (west, red; east, blue). Major faults (SAF, San Andreas Fault; BCF, Buzzard Canyon Fault; GHF, Gold Hill Fault; SWFZ, Southwest Fracture Zone) are taken from Hole et al. (2001) and Crosby (2004). Yellow dashed line indicates the cross-section line of Fig. 4. (b) Individual and stacked traces of migrated radial RFs with variance reduction >90 per cent as a function of backazimuth (tL1, top of the low velocity layer in the mid-crust near SAF; tH, top of the high velocity layer in the mid-crust west of the station; tL2, top of the low velocity layer in the lower crust). (c) Trade-off plots of RF stacking amplitudes in parameter space (stars indicate the best fit) and radial RFs as a function of ray parameter with predicted arrival times of direct converted phases (tL1, tH, tL2, Moho) and their first-order multiples.
RFs recorded at station PKD display clear arrivals within the crust and provide an opportunity to analyse multiple discontinuities. These high quality RFs sample mostly the southwestern side of the fault but still show sharp crustal variations between east and west of the station (Fig. 1b). To the east, radial RFs display a coherent negative phase at 10 km (tL1) and a weak Moho signal coupled with a positive phase in the lower crust. To the west, RFs reveal three strong coherent phases; a positive arrival at 14 km (tH), a negative arrival at 20 km (tL2) and a Moho arrival at 26 km. Near the surface, the delay times of the direct P phase increase east of the station, indicating a thicker low velocity sedimentary fill to the east.
RFs are sensitive to VP/VS and impedance contrast, rather than absolute seismic velocities. To constrain depth (H) and VP/VS, we followed the method used by Zhu & Kanamori (2000) to perform a grid search through H and VP/VS space and search for the largest summed amplitude at the time of the direct conversion and multiples. We applied two separate grid searches with a constant VP of 6 km s−1 for the west and east sampling zones over a wider parameter space to capture crustal arrivals along with the Moho arrival. It is worth noting that low VP values in the upper crust may affect the resultant depths of the shallow discontinuities, but in this case, this effect appears to be limited since VP exceeds 5.5 km s−1 below 1 km depth in the sampled region (Hole et al. 2006). Fig. 1(c) shows RF stacking amplitudes in parameter space and RFs as a function of ray parameter with the predicted arrival times of the major phases that can be used for visual inspection. In the west, the Moho and two crustal discontinuities (tH, tL2) have clear direct and multiple arrivals that led to three distinct and well-constrained local maximas in the grid search, allowing us to separately determine discontinuity depths and average VP/VS value above each discontinuity. In the east, upper crustal arrival (tL1) is identified by a distinct local maximum whereas the weak Moho signal creates multiple local maximas and therefore is less reliable. However, the local maximum that is similar to the one in the west is the only one that matches the Moho arrival with the correct slope for a multiple and is our preferred solution.
Our results indicate a 26-km-thick crust, with an average crustal VP/VS of 1.88 for both the east and west zones. VP/VS is also similar for the upper crust near the fault zone in the east but slightly lower (1.83) for the upper and middle crust beneath the Salinian granitic basement in the west.
3 Seismic Anisotropy
The presence of dipping layers and/or seismic anisotropy results in rotation of energy out of the source-receiver plane and produces systematic variations with azimuth on both radial and transverse RFs. Fortunately, RFs at station PKD have a good azimuthal coverage that allows us to detect and model such variations. In the time window corresponding to the lower crust, the radial RFs display a polarity reversal coupled with a significant decrease in Moho amplitude, which correspond to the two strongest polarity reversals in the transverse RFs (Fig. 2a). These characteristic features, which are isolated from multiples of shallow interfaces, are clear indicators of dipping interfaces and/or seismic anisotropy in the lower crust under the station. In contrast, arrivals observed at upper and middle crust display only weak transverse energies and limited azimuthal variations that may contain effects of near surface complexities and upper crustal heterogenities. Therefore, we modelled only the robust features observed in the lower crust time window at PKD.
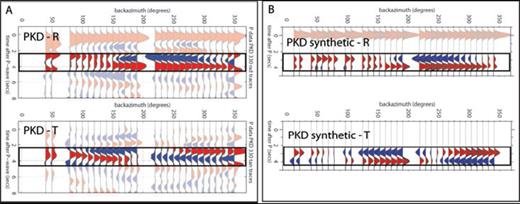
Comparison of observed radial (R) and transverse (T) stacked receiver functions at station PKD (a) and anisotropic model receiver function synthetics (b). In these plots, the RFs are corrected to a common ray parameter and stacked in ±10° backazimuth bins. Note the highlighted pattern of amplitude variations on both the radial and transverse components are well matched by the synthetics.
The azimuthally varying RFs at PKD are modelled using a ray-theoretical method that allows models to have both anisotropy and dipping layers (Frederiksen & Bostock 2000). Initially, we tested isotropic models with dipping interfaces in the deep crust, but these models were not able to generate the polarity reversal observed in the radial RFs, and even unrealistic models of multiple dipping interfaces with steep dips and complex geometries provided a poor fit to the data, indicating that seismic anisotropy in the lower crust is required to reproduce major features in the data.
Inversion of RFs for even a 1-D velocity model is a non-linear problem and is non-unique (Ammon et al. 1990). To examine the seismic anisotropy in the lower crust, we employ a directed Monte Carlo search technique using the neighbourhood algorithm of Sambridge (1999), in combination with the ray-based synthetic seismogram method (Frederiksen et al. 2003; Sherrington et al. 2004). Both radial and transverse components are scaled the same, with no weight difference, and misfits are calculated based on the correlation coefficient between real and synthetic traces placing less emphasis on amplitudes than on arrival times, which are more robustly recovered features of RFs (Frederiksen et al. 2003). To fit targeted phases with minimal complexity, we used a simple model that has an anisotropic low velocity layer at the base of the crust and performed inversions for the degree (percentage) of anisotropy and orientation (plunge and trend) of the slow axis. For these inversions, seismic anisotropy is restricted to hexagonal symmetry, with purely ellipsoidal phase velocity surface but with a dipping symmetry axis allowed (Levin & Park 1998). For the lower crust, we assumed a slow axis anisotropy that can occur due to the alignment of plate shaped minerals (e.g. micas) in metamorphic fabrics (Weiss et al. 1999). It is also important to note that the fabric plane orientation in the low velocity layer is perpendicular to the slow symmetry axis and is unique regardless of whether slow or fast axis anisotropy is assumed, since they generate similar effects when fabric orientation in the slow axis and lineation in the fast axis are the same (Ozacar & Zandt 2004).
The processed data are shown in Fig. 2, along with best-fitting synthetics, and the resulting model features and model parameter trade-off plots are shown in Fig. 3. Reproduction of the main features of the data is good, matching polarity reversals in both components and the variation in Moho amplitude (Fig. 2). Overall misfit is significantly reduced and the remaining misfit is mainly due to the upper crustal phases that are not modelled. Model populations indicate the trend of the slow symmetry axis as the best-constrained parameter and a trade-off between percentage anisotropy and plunge of slow axis, which are sensitive to the phase amplitude. In the best-fitting model, the low velocity layer has 18 ± 3 per cent anisotropy with a slow symmetry axis plunging 55°± 10° from horizontal toward a trend of 250°± 10° from north. Overall, the inversion results support the presence of strong seismic anisotropy (>15 per cent) within a 6-km-thick low velocity layer at the base of the crust, which has a rock fabric dipping ∼35° toward the ENE (Fig. 3).
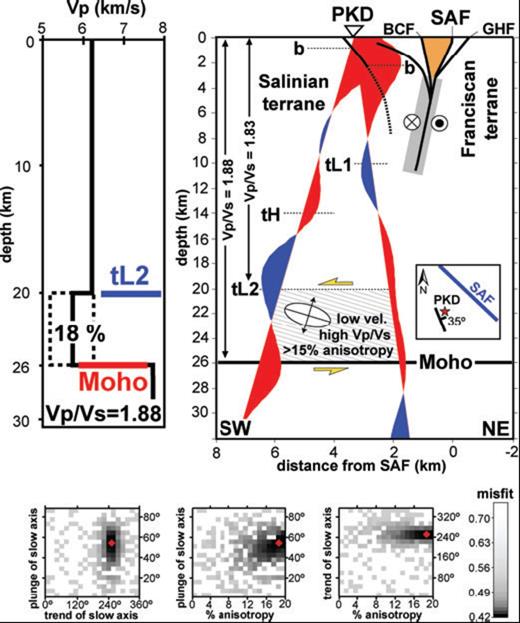
Upper left is the seismic velocity model with an anisotropic lower crustal layer determined from the neighbourhood inversion of RFs at station PKD. Trade-off curves for plunge/trend of slow axis and percentage anisotropy are at the bottom (red diamonds represent the best-fitting model). Upper right is a summary cross-section across the SAF (location on Fig. 1). Stacked and migrated radial RFs from west and east are projected to the piercing point locations at depth (negative, blue; positive, red; b, basement-cover contact). Grey zone indicates the earthquake locations from the Parkfield High Resolution Network (Nadeau & McEvilly, 1997). Orange zone is the low resistivity wedge identified by Unsworth et al. (1997). Ellipse shows the orientation of the anisotropic rock fabric and yellow arrows indicate the interpreted shear sense. Inset map shows the interpreted fabric orientation with respect to the strike of the San Andreas Fault.
4 Discussion
Fig. 4 summarizes and compares crustal-scale geophysical features under Parkfield from an MT resistivity study (Becken et al. 2008), a seismic reflection and refraction survey (Bleibinhaus et al. 2007) and our RF study. Near the surface, the RFs indicate a basement-cover contact (b) that deepens east of the station and is consistent with a thick layer of Cenozoic sediments southwest of the SAF, which was identified previously by seismic imaging (Hole et al. 2006) and drilling at SAFOD (Hickman et al. 2004). The southwest edge of this basin is possibly bounded by the fault that is exposed at the surface near the station.
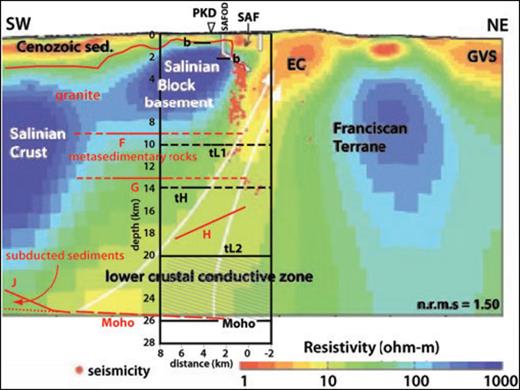
Summary of the deep crustal structure under SAFOD located near Parkfield, California. Colour background figure is the MT resistivity model across the San Andreas Fault (SAF) from Becken et al. (2008). The white arrows indicate a hypothesized fluid migration channel that connects the upper crustal eastern conductor (EC) with a lower crustal conductivity zone. Superimposed in red lines and labels is the structural interpretation from a seismic reflection and refraction survey by Bleibinhaus et al. (2007). Solid red lines mark reflectors or velocity contours; dashed red lines are interpretations. Superimposed within the black rectangle are the results of this study of receiver functions from broad-band seismic station PKD. The labelled black lines are interfaces observed in receiver functions (Figs. 1 & 3). The hachured zone between 20 and 26 km depth is the low-velocity, high VP/VS anisotropic layer at the base of the crust.
In the middle crust, the negative arrival tL1 at 10 km depth and positive arrival tH at 14 km depth locate within a kilometre of the depths of reflectors F and G, respectively, of the seismic reflection survey (Bleibinhaus et al. 2007). The Salinian terrane, which has been transported from its Cretaceous location west of the Mojave region by right-lateral motion along the SAF and its precursory faults, is mainly composed of granitic and metamorphic rocks and is presumed to be underplated by metagreywackes similar to the schist of the Sierra de Salinas that crops out in a structural window ∼50 km northwest of the study area (Kidder & Ducea 2006). The shallower interface (tL1, F) corresponds approximately with the base of a resistive and magnetic granitic body within the Salinian basement (Becken et al. 2008; McPhee et al. 2004), and the deeper interface (tH, G) is located near the base of the brittle crust. Bleibinhaus et al. (2007) suggested the zone in between as a fluid lubricated shear zone within the metasedimentary unit that decouples the upper and lower crust. If the metasedimentary rocks still retain some water as suggested by the high conductivity, it would have lower shear velocities and exhibit a negative impedance contrast at the top and a positive impedance contrast at the bottom, consistent with arrivals tL1 and tH observed in the middle crust.
Beneath station PKD, the RF Moho is at 26 km depth below the surface and shows no evidence for significant dip, in good agreement with all previous deep crustal seismic studies (Eaton et al. 1970; Walter & Mooney 1982; McBride & Brown 1986; Bleibinhaus et al. 2007). The new result from this study is for the lower crust, where our RF modelling indicates a 6-km-thick low velocity layer (VP < 6 km s−1) with strong (>15 per cent) anisotropic rock fabric at the base of the crust (Fig. 3). The arrival times of multiples show a VP/VS of 1.88 for the entire crust and a VP/VS of 1.83 for the top 20 km of the crust, suggesting very high VP/VS (>1.9) within the basal low velocity layer. According to laboratory experiments, schists with sedimentary origin have strong anisotropy (up to 20 per cent) but mean VP > 6.0 km s−1 and VP/VS < 1.9 (Godfrey et al. 2000). Only serpentinite at deep crustal pressures exhibits VP < 6 km s−1 and VP/VS > 1.9 (Hacker & Abers 2004) and has strong anisotropy with slow axis of symmetry (Kern et al. 1997). Based on these constraints, the observed seismic properties could be replicated by a serpentinite or perhaps a fluid saturated schist. The anisotropic layer correlates well with the lower crustal conductive zone observed in the MT study (Fig. 4). This could support either a wet metasedimentary layer or a dehydrating serpentinite explanation.
Serpentinization also causes a large decrease in density and can induce diapers such as the New Idria serpentinite diapir located ∼40 km north of the SAFOD drilling site (McPhee et al. 2004). However, serpentinization at high temperature and pressure forms the denser antigorite phase that is less likely to be mobilized into diapers. Near Parkfield, the northeast side of the SAF is characterized by a gravity low and a magnetic high, reflecting large concealed masses of serpentinite within the Franciscan block along the creeping section of the SAF (McPhee et al. 2004).
To understand the lateral extent of the lower crustal anisotropy, we also computed and inspected RF data from other long-running broad-band stations in California and found similar data characteristics (Fig. 5). For example, RFs of stations MWC, CHF and RPV, all located in southern California west of the SAF, display similar patterns of amplitude variations and polarity reversals as those observed in PKD in the lower crustal time window (Fig. 2). The observation of similar data characteristics at both closely spaced and widely separated stations, supports a regional scale lower crustal anisotropy.
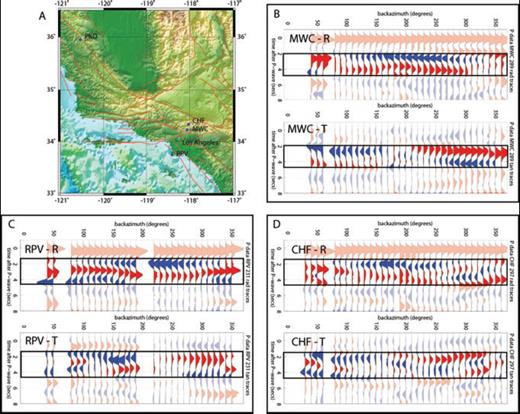
(a) Locations of station PKD and southern California stations shown in this study. (b) Receiver functions for station MWC have a similar pattern of amplitude and polarity reversals on both the radial and transverse components as observed at PKD (Fig. 2) and stations RPV (c) and CHF (d). Other stations located west of the San Andreas Fault, also have this pattern suggesting that the lower crustal anisotropy modelled at Parkfield is a regional feature.
At Parkfield, the anisotropic rock fabric in the lower crust is dipping 35° toward the ENE and suggests horizontal shearing with top to the west sense of shear (Fig. 3). This recovered sense of shear is inconsistent with recent NW-SE aligned shear deformation along the SAF but correlates well with the earlier low-angle subduction direction and with younger NE-SW compression (Page et al. 1998). We conclude that the strong anisotropy is most likely related to the fossilized rock fabric of Farallon Plate subduction, which might have been reinforced by late Cenozoic range-normal compression. Based on these results, we hypothesize that during low-angle Farallon plate subduction, serpentinite, which is either associated with the Pacific oceanic plate or formed by hydration of mantle wedge (Bostock et al. 2002), is later sheared and underplated to the base of the North American crust. In the Coast Range of Oregon, Park et al. (2004) also identified a layer just above the Cascadia slab, which has reduced VP, high VP/VS and strong anisotropy, and inferred a sheared serpentinite detachment zone causing creep and lack of seismicity in that part of the subduction zone.
The preservation of the fossilized fabric excludes a fault model for the San Andreas that requires a broad ductile shear zone in the lower crust directly below the surface trace. Viable models for the lower crust include either a very narrow (a few km wide) vertical shear zone or a wider shear zone that is offset laterally from the surface trace so that our data do not sample it.
Acknowledgments
This research was supported by the NSF grant EAR-0125121. Seismic data were obtained from the Northern California Earthquake Data Center. Station PKD is part of the Berkeley Digital Seismic Network operated by the University of California. We thank Andrew Frederiksen (University of Alberta) for the use of his inversion code and Ryan Porter (University of Alberta) for help in making Fig. 5.
References
