


Summary
To improve the resolution in imaging the 3-D VP and VP/VS structures in the Taiwan region, especially offshore eastern Taiwan, we combine the arrival times from eleven ocean bottom seismometers (OBSs) and from seismic stations of the Japan Meteorological Agency (JMA) with those from the permanent stations of Taiwan Central Weather Bureau Seismic Network (CWBSN) and Taiwan Strong Motion Instrumentation Program (TSMIP). By doing so, we have obtained a new 3-D tomographic model for Taiwan and its surrounding regions with a better resolution, especially in the area offshore northeastern Taiwan. We also used this new tomography model to relocate the hypocentres of the earthquakes in northeastern Taiwan and determined the focal mechanisms of relatively large events. Our tomography results indicate that in the region northeast of Taiwan, the subducting oceanic Philippine Sea Plate beneath the Eurasian continental lithosphere is characterized by a high VP layer, surrounded by lower VP areas. This P-wave velocity characteristics of the subducting slab provides a better constraint on the geometry of the subduction interface, especially in its shallower portion. In the hangingwall (Eurasian) block above the subduction interface, a vertically elongated high VP/VS body appears to originate from the interface at depths between 100 and 140 km. We suggest that it represents the partially melted materials that are related to the magmatic activity of the Ryukyu volcanic arc.
1 Introduction
A good understanding of the 3-D seismic structure is a very important foundation for a variety of earthquake research topics, such as earthquake relocation, earthquake source study and seismotectonic investigations. In the area of Taiwan, an active collision zone between the Eurasian and the Philippine Sea plates, a detailed 3-D velocity model is crucial to the understanding of the active structural characteristics and the tectonic evolution of the collision zone. To this end, there has been a long history of attempts in imaging the seismic velocity structure in the Taiwan region. One of the first tomographic studies for Taiwan was carried out more than two decades ago by Roecker et al. (1987) using the P-wave arrival times observed by the Taiwan Telemetered Seismographic Network (TTSN), which was operated by the Institute of Earth Sciences, Academia Sinica.
Initially, the TTSN consisted of only 25 stations, equipped with vertical-component, short-period seismometers. Since the incorporation of TTSN into the Central Weather Bureau Seismic Network (CWBSN) in 1991, many more stations have been installed, and now the CWBSN involves 71 telemetered stations, equipped with three-component S13 seismometers. Including the retired stations, the CWBSN has a total of 91 different sites. Fig. 1 shows the distribution of the CWBSN stations. The CWBSN offers a better station coverage for the Taiwan region, leading to a series of P- and S-wave velocity models (e.g. Shin & Chen 1998; Rau & Wu 1995; Ma et al. 1996; Kim et al. 2005).
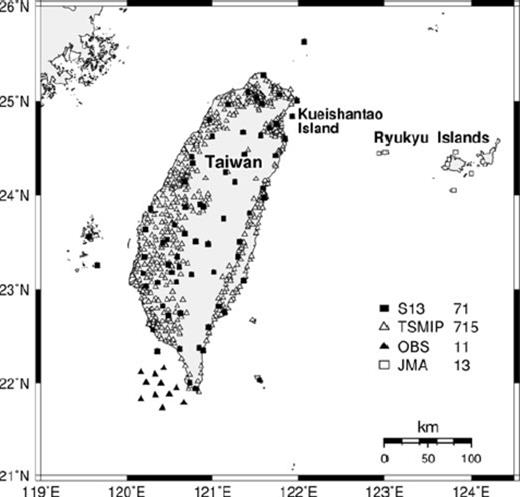
Distributions of the permanent CWBSN and TSMIP stations and the JMA and OBS stations.
Recently, we obtained regional 3-D P-wave and VP/VS structures by combining a large data set of S–P times from the Taiwan Strong Motion Instrumentation Program (TSMIP) records, with the P- and S-wave arrival times from the CWBSN stations (Wu et al. 2007). The TSMIP data set, with more than 800 stations located throughout the island (Fig. 1), improves the source-station path coverage tremendously and provides much better constraints and resolution in the velocity structure determination. However, since most of the stations of the CWBSN and TSMIP are located on the Island of Taiwan, the coverage is always poor for the offshore region, where many earthquakes occur. To complement the excellent path coverage of the on-land region provided by the permanent CWBSN and TSMIP stations, we included the arrival-time data from 13 Japan Meteorological Agency (JMA) stations, distributed around the southern Ryukyu Island chain (Fig. 1). Data from these stations should significantly improve the constraints of the subsurface structures in the northeastern offshore region, especially around the subduction zone there. In the south, we incorporated data from 11 ocean bottom seismometer (OBS) stations (Fig. 1) deployed temporarily after the 2006 December 26 Mw 7.1 Pingtung earthquake sequence. The joint utilization of observations from the permanent stations on-land and from the two offshore deployments not only expanded our model to include the subduction zone between Eurasia and Philippine Sea plates in the northeast as well as the collision zone in the south but also improved the overall path coverage and the constraint to velocity structures in the entire region.
2 Data and Method
The hypocentral distribution of the events used in this study is shown in Fig. 2. The selection of the earthquakes was based on the following criteria: (1) earthquakes occurred in the period from 1991/01/01 to 2007/01/31 and located inside the tomographic grid, shown in Fig. 2; (2) in each 0.1° × 0.1° × 10 km cubic cell, we selected the event recorded by the largest number of arrivals by the CWBSN stations; (3) events for which the JMA, TSMIP and OBS network offered at least one good-quality reading of P arrival or S–P time; (4) all events must have a station coverage gap of less than 225°. The OBS network was a temporary deployment from 2006 December 27 to 2007 January 3 for monitoring the aftershocks of the 2006 Pingtung earthquake. Historically, the area offshore southern Taiwan has been a region of low seismicity. Therefore, this OBS data set provides a significant enhancement to the constraint on the seismic structure of this region.
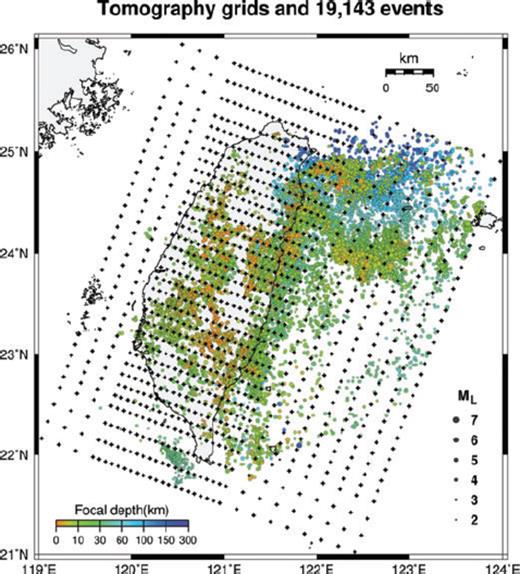
A horizontal slice of the model gridpoints (crosses) and the epicentres (circles) of the earthquakes used in tomographic inversions. Different colours represent different source depths.
In the end, a total of 382 202 P-wave arrival times and 221 742 S–P times were obtained from 19 143 regional earthquakes. Among these data, 350 073 P arrivals and 158 462 S–P times came from the CWBSN catalogue, and most of these arrival times have been re-picked, 29 397 P arrivals and 13 520 S–P times were from 10 932 earthquakes reported in the JMA catalogue; 47 844 S–P times were manually picked on the TSMIP records from 10 322 earthquakes; and 2732 P arrivals and 1916 S–P times from 378 earthquakes were manually picked from the OBS short-period records. In this study, we adopted the standard arrival-time weighting scheme in HYPO71 (Lee & Lahr 1975) and only used data with weightings 0, 1, 2 and 3 in tomographic inversions.
The velocity model is specified on a set of 3-D spatial gridpoints, and a linear interpolation is adopted between the gridpoints. Fig. 2 also shows the distribution of the 34 × 34 gridpoints on a horizontal plane. A total of 19 gridpoints are distributed at the depths of 0, 2, 4, 6, 9, 13, 17, 21, 25, 30, 35, 50, 70, 90, 110, 140, 170, 200 and 400 km. The horizontal grid spacings in west-northwest-east-southeast and north-northeast-south-southwest directions are 7.5 and 12.5 km, respectively, in the interior part of the grid, whereas the grid spacing for the offshore regions is 20 km. The difference in grid spacing is due to the difference in the path coverage, as well as the dominance of NE-SW trending geological features on the Island of Taiwan.
We applied the algorithms SIMULPS12 (Evans et al. 1994) based on the inversion method by Thurber (1983, 1993), Eberhart-Phillips (1990) and Thurber & Eberhart-Phillips (1999). Ray tracing is accomplished using an approximate 3-D algorithm with curved non-planar ray paths (Um & Thurber 1987), and the damped least-squares inversion is based on the parameter separation technique of Pavlis & Booker (1980).
The damping values of 35 for VP and 40 for VP/VS were chosen empirically by running a series of single-iteration inversions with a range of damping values and finding the trade-off between data misfits and the model variances (Eberhart-Phillips 1986, 1993). A consistent damping was used in the entire iterative inversion process. We used our previous result (Wu et al. 2007), as the initial model for the velocity inversion. The initial values of model parameters on gridpoints outside the model of Wu et al. (2007) were specified by linear extrapolation from the reference model.
In this study, we incorporate the P arrival times and S–P times from different networks, namely the 13 JMA stations, 11 OBS instruments and the CWBSN and TSMIP stations (Fig. 1). Currently, the JMA, OBS and CWBSN systems all use GPS-based timing. Therefore, their arrival times can be jointly utilized. However, there may still be a small discrepancy in timing due to the different time-stamping procedures used by the different networks. The CWBSN transfers the digital seismic signals via telephone lines and the time is stamped at the data centre in Taipei. Based on our estimation, there may be a delay of up to a few tens of milliseconds caused by the telemetry latency. For the OBS system, the GPS time stamps are issued on each OBS recorder both before its deployment and after its retrieval. The times of the OBS records were then corrected on the basis of the two time stamps. In general, there are only a few milliseconds of difference between the OBS and GPS times. For the JMA system, the time stamps are attached to the signals at the station in the field and transmitted with the signals. In principle, the JMA records should have no latency delay. Chou et al. (2006) relocated the events between Taiwan and Ryukyu region using the P and S arrivals from both CWBSN and JMA networks. Their results suggest that the time-stamping process operated by CWBSN does not bias the hypocentres significantly with respect to the tectonic features concerned in their study. Since the offshore events are almost always outside the CWBSN network, the inclusion of the JMA stations improves, significantly, the azimuthal coverage for the earthquakes occurring off the east coast of Taiwan, and therefore the enhancement to the resolution in imaging the subsurface structure outweighs the small timing problem. Based on our previous study (Wu et al. 2008), the CWBSN location for the eastern offshore region may have a 5.6 km difference on average compared with the relocation results by the combination of the CWBSN and JMA data sets. This 5.6 km bias will lead to a variation of about 0.9 s in P-wave arrival time (assuming a P-wave speed of 6.5 km s−1), which is much greater than the discrepancies in timing among different networks. Thus, we have ignored the small timing issue in using the arrival times in tomographic inversions. For the S–P times, there is no internetwork timing discrepancy.
3 Resolution Tests
We used the checkerboard resolution test (CRT) and the restoring resolution test (RRT) proposed by Zhao et al. (1992) and Hole et al. (2000) to examine how well the heterogeneities in the velocity structure can be retrieved from the inversions. The CRT method can be used to investigate the spatial resolution provided by the existing ray coverage. We constructed the checkerboard velocity models with the same level velocity variation (±5 per cent) and block size (22.5 × 37.5 × 8 km), as in our previous study (Wu et al. 2007).
Fig. 3(a) shows a few horizontal and vertical slices of the CRT input and recovered models for the P-wave velocity structures. In this study, we included most of the data used in Wu et al. (2007); thus, a good recovery of the P-wave structure underneath Taiwan is achieved. Moreover, due to the inclusion of the JMA data set, the region of good recovery of the checkerboard pattern extends into the eastern offshore region. In northeastern Taiwan, the recovery is good down to the depth of about 150 km (e.g. Profiles B-B′ and C-C′ in Fig. 3a), and even down to 200 km depth in the subduction zone. In southeastern Taiwan, the region of good recovery extends to the depth of about 80 km (e.g. Profiles B-B′, D-D′, and E-E′ in Fig. 3a), whereas the recovery is relatively poor in the shallow portion, especially in the eastern edge of the model. In the southeastern subduction zone, the region of good recovery extends to the depth of about 120 km (e.g. Profiles B-B′ and E-E′ in Fig. 3a). In the region where the OBSs are deployed, good recovery can be obtained in depths from 25 to 60 km, owing to the arrival times from the 2006 Pingtung earthquake sequence.
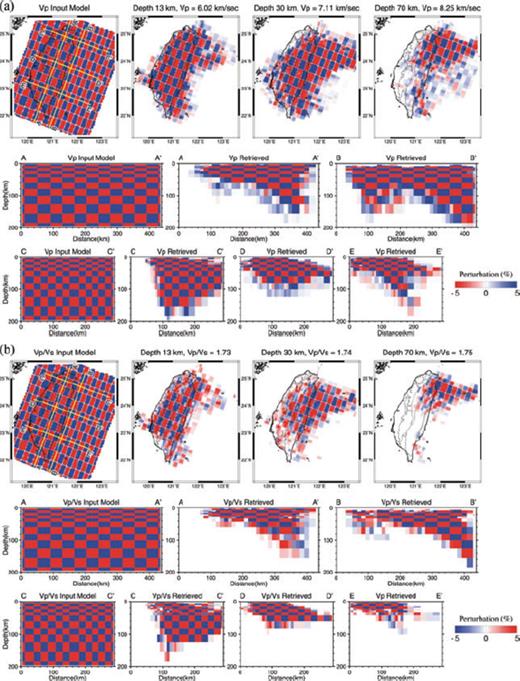
Input and recovered models in the checkerboard resolution tests for (a) VP structure and (b) VP/VS structure. Input model is shown in the left-hand column in map view (top) and along two vertical profiles A-A′ and C-C′. All the other panels show cross-sections of the recovered model, including map views at three depths (top row), and vertical profiles A-A′ to E-E′ whose locations are indicated in the top left-hand panel.
Fig. 3(b) shows several horizontal and vertical slices for the CRT input and recovered models for the VP/VS structure. Determining the S-wave arrival times is generally more difficult than for the P wave. Therefore, the recovery of VP/VS structure is not as good as that shown in Fig. 3(a) for the resolution of P-wave structure. However, the region of good recovery can still extend to the depth of 200 km in the northeastern subduction zone (e.g. Profiles B-B′ in the Fig. 3b). The CRT results show that a good VP/VS resolution can be obtained down to the depths of 120, 60 and 40 km in the northern, middle and southern portions of eastern Taiwan, respectively (e.g. Profiles B-B′, C-C′, D-D′ and E-E′ in Fig. 3b). Overall, the inclusion of the JMA and OBS data sets expanded the regions of good recovery from those in Wu et al. (2007), especially in the area between Taiwan and Ryukyu. The velocity structures beneath the Island of Taiwan and offshore south of Taiwan have been discussed previously (Wu et al. 2007, 2009). Here, we focus on the VP and VP/VS structures in the offshore region northeast of Taiwan.
4 Velocity Structures and Seismicity Offshore Northeast of Taiwan
Based on the improved 3-D model for VP and VP/VS structures, we undertook the relocation of the earthquakes in northeastern Taiwan from 1991 to 2006, with station corrections (Wu et al. 2003, 2008a). A total of 99 040 earthquakes were relocated. Fig. 4 shows the epicentral distribution of the relocated events. For events of magnitude 4.5 and above, we also determined their focal mechanisms using the program FpSearch (Wu et al. 2008b), which determines the fault-plane solutions by fitting the first-motion polarity observations from the CWBSN, TSMIP and JMA stations. Table 1 is a list of the locations and origin times of these events, together with their focal mechanisms determined in this study or from Harvard CMT catalogue. The focal mechanisms are also plotted in Fig. 4.
Distribution of the relocated earthquakes (small circles) in northeastern Taiwan and the focal mechanisms (beachballs) for events of magnitude 4.5 and above.


Parameters of the focal mechanisms used in this study.
Fig. 5 shows the relocated hypocentres and the focal mechanisms together with our new tomography model for VP and VP/VS structures along four east-west vertical profiles. Several distinctive features can be observed from the hypocentral distribution in northeastern Taiwan. The most obvious feature is the north-dipping Wadati-Benioff zone related to the northward subducting Philippine Sea Plate underneath the Eurasian Plate. Along Profile A-A′ and in the region shallower than the depth of 80 km, the seismicity pattern shows clearly that the hypocentres are separated into a two-layered structure. This double seismic zone offshore northeastern Taiwan has been observed previously in several other investigations (e.g. Kao & Rau 1999; Chou et al. 2006) and has been interpreted in terms of the lateral compressive stress produced by the oblique subduction. Our result is consistent with this interpretation. The double seismic zone is much less prominent in the other three profiles, because they are farther away from the edge of the subducting slab.
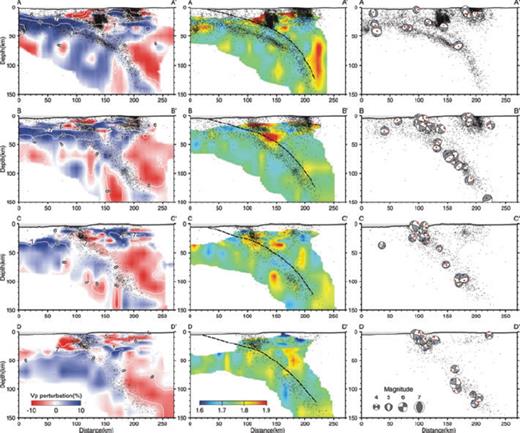
Four profiles offshore northeastern Taiwan showing the VP (left panels) and VP/VS structures (middle panels), the relocated seismicity and the focal mechanisms (right-hand panels). Locations of the profiles are indicated in Fig. 4. Dashed lines in the middle panels represent estimated upper surface position of the subducting slab. Focal mechanisms in right-hand panels are rotated for cross-section views. Red dots represent P axes of earthquakes, and blue dots represent T axes.
Several reasons may be responsible for the formation of the double seismic layers. Since the double layer pattern is most obvious along profile A-A′ and shallower than about 80 km (Fig. 5), it is possible that the collided Eurasian continental crust underneath Taiwan is pushing against the northward subducting slab to form the deeper seismic layer. On the other hand, our previous results for the entire Taiwan area revealed that the deeper seismic layer appears to extend further to the south beneath eastern Taiwan (fig. 6 of Wu et al. 2007). This layer may therefore represent the Luzon forearc crust, which was underthrust beneath eastern Taiwan due to the ongoing collision (Wu et al., 2009, unpublished data).
It is noteworthy that many earthquakes within the Wadati-Benioff zone along the two western profiles A-A′ and B-B′ have P axes trending E-W, instead of parallel to the subduction interface (Fig. 5, right-hand panels). This suggests that these earthquakes may be induced by the compressional stress coming from the sides, near the western edge of the subduction zone, which is consistent with the interpretation of Kao & Rau (1999). On the basis of numerical modelling and GPS analysis, it has been suggested that northeastern Taiwan experienced a rotation of the stress field, from the NW-SE compressional stress field in north-central Taiwan to the extensional stress field in northeastern Taiwan and offshore (e.g. Hu et al. 2002; Rau et al. 2008). The characteristics of earthquake P axes patterns observed in this study also correspond with this rotation of stress field. Further to the east, E-W trending P axes are rarely seen.
The subducting slab becomes even better illuminated, once we plot the relocated seismicity on top of our new tomography results. In most of the profiles, the north-dipping Wadati-Benioff zone correlates very well with a north-dipping layer of high VP (Fig. 5, left-hand panels), a clear indication of the subducting oceanic lithosphere of the Philippine Sea Plate. The upper layer of the double seismic zone along profile A-A′ coincides with the upper boundary of the high VP region. This suggests that the earthquakes in the upper layer of the double seismic zone occur near the subduction interface. On the other hand, the earthquakes in the lower layer of the double seismic zone appear to occur near the bottom of the oceanic crust, probably in the uppermost mantle.
Our tomography result also provides a better constraint on the geometry of the subduction interface, especially in its shallower portion. Since the subducting slab is characterized by a high VP layer surrounded by areas of lower VP, we are able to draw the approximate locations of the interface at different depths according to the boundary between higher and lower VP areas. Fig. 6 shows our VP model and the isobaths of the Wadati-Benioff zone by Font et al. (1999), at the depths of 13, 30, 50, 70, 90 and 110 km. At depths greater than 50 km, our result is quite similar to those in previous studies (e.g. Kao et al. 1998; Font et al. 1999). At shallower depth, however, the seismicity in the upper layer of the double seismic zone along the subduction interface becomes tangled with the earthquakes in the hangingwall (Eurasian) block, making it difficult to identify the interface using seismicity pattern alone. Instead, we utilized the obvious boundary between the higher VP zone and the lower VP area above it, to delineate the subduction interface (Figs 5 and 6). Based upon these results, we further produced a structural contour map for the top of the subducting slab (Fig. 7). Our results yield a smooth and gently dipping subduction interface at depths shallower than about 40 km, and the projection of the interface on to the surface correlates well with the location of the Ryukyu trench.
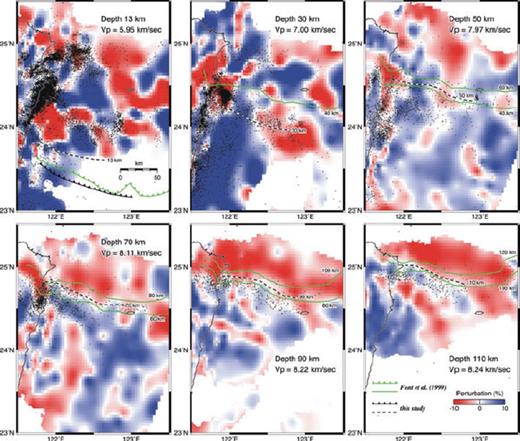
VP perturbations at different depths in our tomography model and the subducting slab depth-contour lines by Font et al. (1999). Also drawn are lines separating high and low VP areas in our model (see text for more discussion).
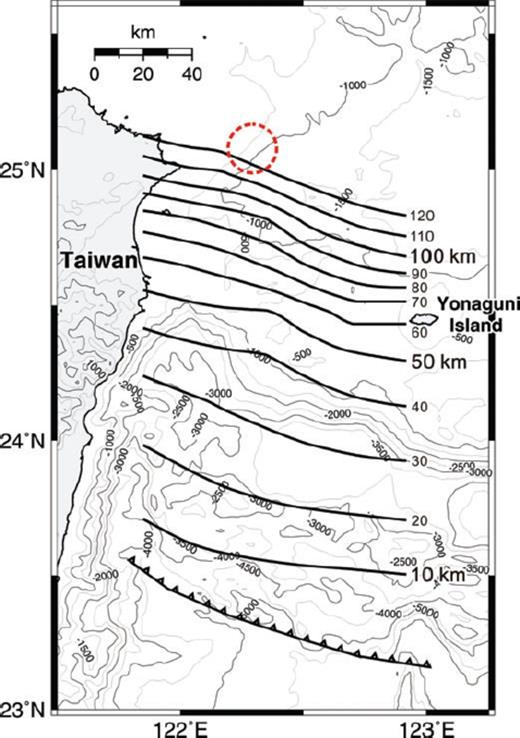
A structural contour map for the top of the northward subducting slab of the Philippine Sea Plate. The contour is made on the basis of the boundary between the higher VP zone and the lower VP area above it. Numbers represent depth below the surface. The red circle represents the surface projection of the high VP/VS body along profile A-A′ in Fig. 5. Bathymetry contour intervals are 500 m.
Several other interesting features can also be seen in our tomography results offshore northeastern Taiwan. In the overlying Eurasia block above the subduction interface, there is an area of low VP and high VP/VS, with extremely abundant seismicity, located between 24.2°N and 24.6°N at about 122° E (Fig. 5). This area coincides with the Hoping Basin offshore northeastern Taiwan. The Hoping Basin has been suggested to be an important structural accommodation region between the arc-continent collision system in eastern Taiwan and the Ryukyu subduction system, with a complicated set of structures connecting the two systems (e.g. Lallemand et al. 1997; Shyu et al. 2005). The abundant seismicity in this area clearly illuminates the complex structural characteristics in the basin. Alternatively, the increased seismicity may also represent lateral heterogeneities and differences in rock strength in the subducting slab. If the Hoping basin floor consists of denser and higher strength materials, the variation in material strength in and around the basin may result in increased strain and seismicity. Structurally, the basin may be bounded by major right-lateral faults in the east and normal faults in the south, and a large number of minor structures of various types may be present in and around the basin (e.g. Shyu et al. 2005). The highly fractured materials produced by the many structures may therefore increase, significantly, the VP/VS ratio in the area. Furthermore, the floor of the Hoping Basin may be subsiding rapidly due to the activity of the structures surrounding the basin. This will create an accommodation space for a large amount of sediments brought in from Taiwan. Thus, the low VP and high VP/VS characters of the area may also reflect this thick pile of sediment within the basin, at least in the shallower part of the area.
A large number of shallow (<30 km depth) earthquakes are present along profiles A-A′ and B-B′ in the southernmost Okinawa Trough (Figs 4 and 5). This shallow seismic activity appears to concentrate within the trough and ends abruptly to the northwest. Since most of the earthquakes have near-vertical P axes (Fig. 5, right-hand panels), they likely represent the extensional events produced by active normal faults in the Okinawa Trough. Therefore, the abrupt termination of the shallow seismicity may correspond to a northwestern boundary structure of the trough. Such phenomenon is also observed in the area slightly further northeast by Lin et al. (2007).
Along profile A-A′, a very distinct, elongated body of high VP/VS ratio rises up vertically from the subduction interface at depths of 100–140 km (Fig. 5, top middle panel). This body likely represents the upwelling magma of the Ryukyu volcanic arc. Previously, small magma bodies characterized by low VP, low VS and high VP/VS have been observed offshore northeastern Taiwan (e.g. Lin et al. 2004, 2007). They have been suggested to be correlated with volcanic activities within the westernmost Okinawa Trough, as well as the Holocene volcano of the Kueishantao Island, a small volcanic island just offshore northeastern Taiwan. Since the magma bodies observed in previous studies generally originate at depth shallower than about 50 km, they are more likely to be related to mechanisms such as slab tear near the western end of the subduction zone (e.g. Lin et al. 2007). In fact, in our tomography results, there are also high VP/VS bodies that originate above the subducting slab at shallower depths, between 50 and 100 km, along profiles C-C′ and D-D′. These shallower bodies may be related to melting beneath the cross backarc volcanic trail (CBVT) area in the Okinawa Trough (Sibuet et al. 1998; Lin et al. 2004). The vertically elongated high VP/VS body observed along profile A-A′, on the other hand, appears to originate from the subduction interface at the partial-melting depth and may represent the actual magmatic activity of the Ryukyu volcanic arc.
It is noteworthy that this vertically elongated high VP/VS body is only present along profile A-A′ but hardly visible along profile B-B′, which is very close. This indicates that subducting slab-derived melts are highly concentrated, and the magmatic activity along subduction zones has strong segmentation. The spacing between volcanoes along the Ryukyu and other volcanic arcs in the world may therefore reflect such a phenomenon.
The incorporation of data from a 12 day deployment of 15 OBS stations offshore northeastern Taiwan, in the southernmost Okinawa Trough, enabled Lin et al. (2007) to obtain a higher tomographic resolution in the shallow part of the area than this study. As a result, the detailed geometry of the shallow magma bodies identified in Lin et al. (2007) appears to be quite different from that observed in this study. Similarly, we are also uncertain about the precise location of the major magmatic body, along profile A-A′, shallower than 50 km. Whereas several submarine volcanoes or volcanic fields are present in this area (e.g. Wang et al. 1999; Chung et al. 2000) and may be surficial evidence for the magmatic body, we do not have enough constraint in the shallow part of our tomographic results to specifically correlate the high VP/VS body with any of the submarine volcanoes. We hope that future OBS data can provide a better constraint at the shallow depth for this proposed body.
5 Summary and Conclusions
To improve the tomographic resolution for the areas offshore Taiwan, we have incorporated the arrival-time data sets of the JMA and OBS stations. In the resolution tests of our new tomographic inversions, the results show a significant expansion of the area of good recovery, especially in the offshore region northeast of Taiwan. The new tomography results, combined with relocated seismicity, provide a better constraint on the geometry of the Ryukyu subduction interface offshore northeastern Taiwan. The subducting slab of the Philippine Sea Plate is illuminated by a north-dipping high VP layer surrounded by lower VP areas. The Wadati-Benioff zone near the western edge of the slab clearly shows a double seismic zone, with the upper seismic layer coincident with the subduction interface. The P-wave velocity characteristics of the subducting slab also helps, significantly, in reconstructing the geometry of the interface in its shallower portion, where earthquakes in the hangingwall (Eurasian) block entangle with events along the subduction interface.
Other interesting features are also present in our new tomographic model. The Hoping Basin offshore northeastern Taiwan, for example, is characterized by low VP, high VP/VS and extremely abundant seismicity. These features may reflect the complex structural patterns of the basin in connecting the collisional system in eastern Taiwan and the Ryukyu subducting system further north. Moreover, a vertically elongated body of high VP/VS can be seen in the Eurasian block above the subduction interface. This body appears to originate from the subduction interface at depths of 100–140 km. We believe that it reflects the partially melted materials that are related to the magmatic activity of the Ryukyu volcanic arc.
We believe our new 3-D model of the entire Taiwan region with enhanced resolution in the offshore areas, together with the relocated seismicity, will provide a better foundation for future seismologic and tectonic investigations.
Acknowledgments
We wish to thank the Japan Meteorological Agency for providing the arrival-time data. The comments and suggestions of the editor C. Ebinger and two anonymous reviewers led to significant improvements of the manuscript. This research was supported by the Central Weather Bureau and the National Science Council of the Republic of China (NSC95–2119-M-002-043-MY3 and NSC95-2119-M-001–063).
References
