


Summary
This is the first paper of a series of two concerning strong ground motion in SW Iberia due to earthquakes originating from the adjacent Atlantic area. The aim of this paper is to build and calibrate a velocity model that will be used in the companion paper for seismic intensity modelling of the 1969 (Ms= 8.0) and 1755 (M= 8.5–8.7) earthquakes.
Taking into account the geological evolution of the region since the Palaeozoic, we build a 3-D velocity model down to the Moho discontinuity, substantially different from a simple 1-D layered model. The velocity model presented in this paper is built a priori, using information originating from a variety of geological and geophysical studies. Its resolution is sufficient to simulate realistically seismic wave propagation in the low-frequency (f < 0.5 Hz) range, which is the most significant for the study of the destructive effects of large earthquakes at a regional scale.
To validate the model, we compute synthetic seismograms for three recent earthquakes of moderate magnitudes (4.6 < Mw < 5.3) located offshore, in the most seismically active area in the region. Synthetics are generated using a wave propagation code, based on the finite-difference method, which was chosen for its simplicity and accuracy in the frequency range considered in this study (0.1–0.5 Hz). We compare simulated waveforms with three-component seismograms for 9 different stations. Traveltimes of the direct P waves, and the amplitude of ground motion, are accurately reproduced at all stations. The frequency content of the seismograms fits the observations, especially for the lowest frequencies investigated (0.1–0.3 Hz). For each earthquake, the estimated seismic moment is in good agreement with values obtained by other authors, using different methods. We conclude that the velocity model provides encouraging results for the computation of low frequency seismograms in the region, and can be used for the study of larger earthquakes, for which the radiated wavefield has a predominant low-frequency spectrum.
1 INTRODUCTION
Earthquake analysis algorithms often use stratified (1-D) crustal models for earthquake location and fault parameters determination. This approximation is inappropriate in SW Iberia, where sources are located in the oceanic domain, and receivers in the continental domain: crustal structure varies dramatically along ray paths, with large-scale heterogeneities, of low (deep sedimentary basins) or high (shallow oceanic mantle) velocities. Moreover, combined with the geometrical limitations inherent to the region, a strong trade-off between several parameters is often observed (for instance, origin time versus location, or hypocentral depth versus fault mechanism); this is particularly critical when studying moderate magnitude earthquakes (M < 6), which constitute the bulk of the seismic catalogue in SW Iberia, if not the totality. Hence, there is an increasing need for a more complex crustal model in the region that could account for the main lateral and horizontal heterogeneities inside the crust, and thus improve epicentral location determinations and enable to perform waveform modelling at relatively high frequency (∼0.1–1 Hz).
Inversion procedures (such as seismic tomography) have achieved much success in improving our knowledge of the structure of the Earth's interior. Unfortunately, they are not easily applied to the case of SW Iberia, mainly because both the major heterogeneities and seismogenic sources lie in the oceanic domain. Therefore, in this paper, a forward modelling approach is taken.
First, we propose a preliminary 3-D velocity model of SW Iberia and its adjacent Atlantic area. The velocity model is based on previous studies of the crust in SW Iberia published by various authors that have used a variety of geophysical techniques, as well as geological observations. The calibration of the velocity model is performed in the frequency range of 0.1–1 Hz by integrating it into a finite-difference wave propagation code. We focus on three recent earthquakes, and compare observed and synthetic seismograms using several criteria: waveform similarity, direct P-wave arrival time, and amplitude in the time domain and frequency domain.
2 TECTONIC EVOLUTION OF SW IBERIA AND INHERITED CRUSTAL STRUCTURE
The velocity structure of the crust of Iberia is the result of a complex geological history that spanned from the Variscan orogeny, to the Mesozoic rifting episode, and to Tertiary–Quaternary continental convergence phases. In this section, we focus, in a chronologic order, on the most prominent features inherited from these successive phases (Fig. 1).
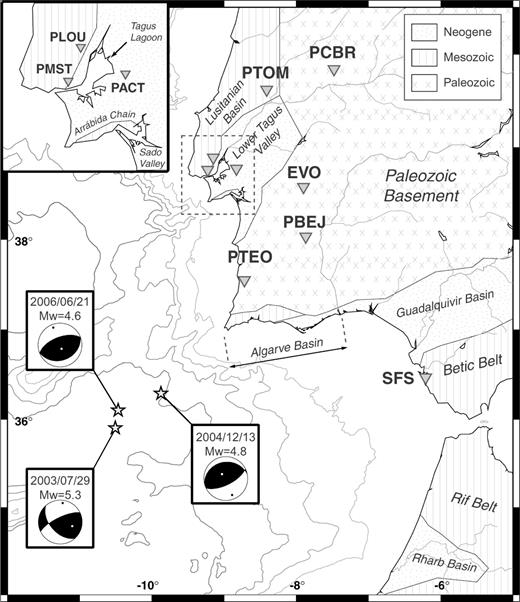
Location of the stations used for the comparison of synthetic seismograms. The epicentres and focal mechanisms of the three moderate magnitude events studied here are also shown. On land, major geological units are featured.
2.1 Variscan orogeny
The western part of Iberia consists of a fragment of the Variscan orogeny, which took place between the middle Devonian to the Carboniferous (Ribeiro 1979). The crustal structure of SW Iberia has been studied by Matias (1996), who suggested a simple velocity distribution in the lower and middle crust, and pointed out the presence of large intrusive bodies and major sutures in the upper crust, inherited from the Palaeozoic orogeny. Simancas (2003) corroborated these suggestions, and confirmed that the deep Palaeozoic crustal root has now been removed, yielding a flat Moho topography, at a depth of approximately 30–35 km.
2.2 Mesozoic rifting
An important rifting phase occurred from late Triassic (Wilson 1975), and led to the opening of the Atlantic Ocean, with a seafloor spreading onset dated to 133 Ma (Pinheiro 1992). The transition between the thick continental and the thin oceanic crust is well imaged on existing E–W transects off the western margin of Portugal (Afilhado 1999; Dean 2000) and in the Gulf of Cádiz (González 1996; Somoza 1999), as Moho depth decreases from 30 to 15 km over a distance of 100–150 km (Fig. 2). Additional thinning of the crust has been observed further west (González 1996; Dean 2000), but the correlation between available profiles is difficult.
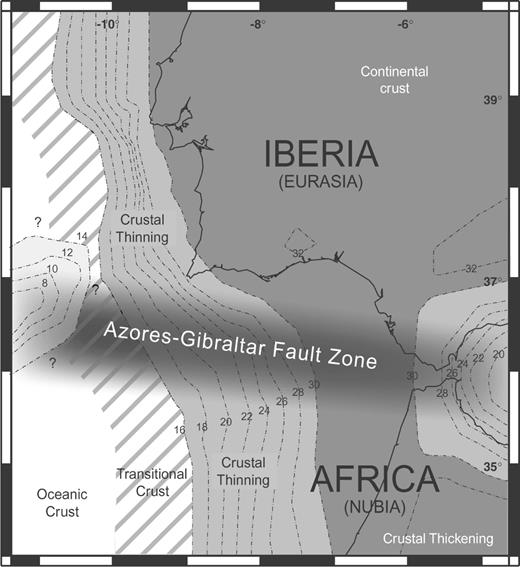
Map view showing the modelled Moho depth. Notice the extremely shallow upper mantle occurring at Gorringe Bank, and the crustal thinning in the Alborán Sea. The Azores-Gibraltar Fault Zone (AGFZ) is a region of high seismicity that contains the Nubia-Iberia plate boundary.
The Lusitanian Basin (see location in Fig. 1) developed from late Triassic as a response of the Mesozoic extension, with reactivation of structures within the Variscan basement (Arthaud & Matte 1975; Wilson 1989; Stapel 1996). This basin has a lenticular morphology, elongated in the NNE-SSW direction, parallel to the coast, and has an average depth of 4 km (Leinfelder & Wilson 1989). In its northern part (north of 39°N), the basin has a graben like structure in EW cross-section: the Ota and Montalegre basement highs form a roughly north–south elevation of the seismic basement, which delimits the eastern extension of the Mesozoic basin (Leinfelder & Wilson 1989), while the basement outcrops found offshore on the Berlenga Horst mark its western boundary (Wilson 1989). Depth-to-basement can reach 5 km in the Arruda subbasin (Leinfelder & Wilson 1989). Below the Tagus lagoon, high-resolution seismic reflection and well data suggest that the seismic basement is located as deep as 5 km (Carvalho 2005), progressively shallowing to the northeast (Fig. 3a and cross-section B–B′ in Fig. 4). South of the Tagus estuary, the structure is not well known, and existing models suggest a half-graben structure (Ribeiro 1996) instead of the more symmetrical structure further north. In the Arrábida chain, at least ∼4 km of Mesozoic sediments are present. In the offshore Sado valley, the basement is approximately 3–4 km deep (Rasmussen 1998), but, on land, depth to basement is less than 2 km.
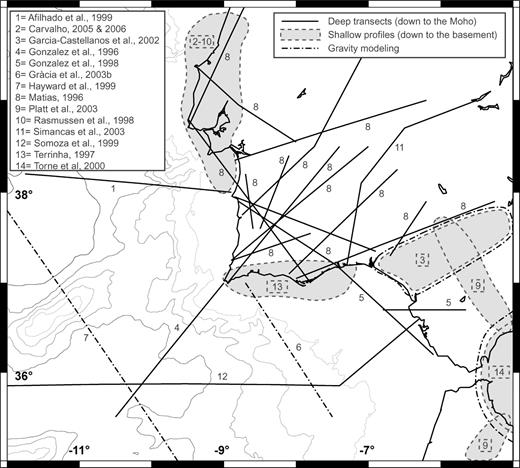
Location of the interpreted seismic profiles used in this study.
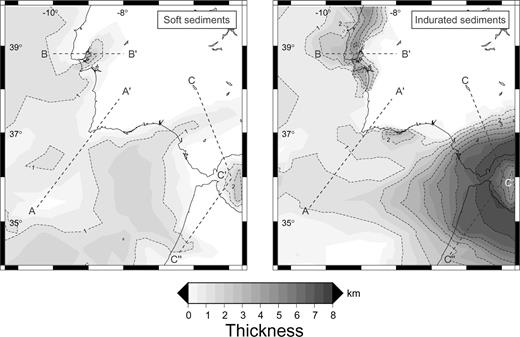
Thickness of the two modelled sedimentary layers: (a) Mesozoic, consisting of hard, consolidated deposits and (b) Neogene, made of loose, poorly consolidated formations. The location of the cross-sections of Fig. 5 is shown.
The Algarve Basin (see location in Fig. 1) formed by lithospheric stretching within a transtensional tectonic regime, induced by the differential drift of Eurasia and Africa with respect to North America (Terrinha 1997). This basin is much shallower, with a probable maximum depth of 2 km. It deepens to the south, and reaches a depth of ∼4–5 km in the Gulf of Cádiz (González 1998).
2.3 Cenozoic inversion
During the Cenozoic, the successive collisions between Iberia and Eurasia (Pyrenian orogeny) and Iberia and Africa (Alpine orogeny) were responsible for the oblique inversion of the main Mezosoic basins. In the Lusitanian and Algarve Basins, the most important compressive deformation occurred during the Miocene, with the lower Jurrassic evaporites acting as a décollement (Ribeiro 1990). In the Lusitanian Basin, the compression was directed NNW to SSE, oblique to the predominant NNE to SSW trend of Mesozoic extensional faults, thus resulting in their inversion, with a strong transpressional component (Curtis 1999). In the Algarve basin, the shortening of the basin was also accommodated by inversion of pre-existent extensional structures (Mougenot 1988; Terrinha, 1997).
In southern Iberia, the Palaeogene collision produced a short-lived orogeny in the Alborán Domain, which underwent a subsequent subsidence phase during the Neogene by extensional collapse (Platt 2003) or westward extrusion (Tapponnier 1977). This phase resulted in the formation of the Betic-Rif arc during Early to Middle Miocene (Lonergan & White, 1997), where crustal thickness can reach 35 km (Torne 2000). When approaching the internal part of the belt, the basement progressively deepens, down to a depth of 7–8 km along the coast of the Alborán Sea (Platt 2003); simultaneously, the Moho becomes dramatically shallower across the internal belt (Fig. 2), and reaches a depth of 16–18 km in the Alborán Sea (Torne 2000).
In the Gulf of Cádiz, gravity modelling indicates that the crustal thinning (minimum Moho depth of 21 km) inherited from the Mezosoic extensional phases has been preserved during the Neogene compressional phase (Gràcia 2003). However, the sedimentary cover simultaneously increased in thickness, and the combined effects of the westward displacement of the Alborán Domain and the north–south shortening of the gulf resulted in massive slump-block motions, and the final emplacement of an accretionary wedge that covers the Palaeozoic basement from the external Betics to the Horseshoe Abyssal plain (Flinch 1996; Grácia et al. 2003; Platt 2003). These allochtonous units consist of a chaotic mixture of sedimentary formations, soled with Triassic evaporites which may have played the role of a lubrificant for gravity-driven translations (Flinch 1996; Somoza 1999).
Since early Miocene, the Lower Tagus Valley Basin was progressively filled, first in a continental and shallow marine environment, due to subsidence of the Lisbon margin (Ribeiro 1990; Rasmussen 1998; Alves 2003), then in a fluviatile context during the moderate subsidence that occurred since early Pliocene (Cabral 1993). The Neogene basin reaches a thickness of 2.5 km below the northeastern Tagus Lagoon (Rasmussen 1998; Carvalho 2006). In the Algarve basin, the Neogene cover is very superficial (<0.5 km), and limited to its eastern part (Terrinha 1997).
Further south, the Betic-Rif orogeny started during the Late Cretaceous, and culminated during the Oligocene–Miocene, thus provoking the formation of foreland basins, wedge accretion and sediment infill from Middle Miocene to present (Platt 2003). The Guadalquivir Basin and the Rharb Basin were filled at the base of the external part of the Arc (the Guadalquivir Allochton and the Prerif, respectively), in the trough formed by crustal flexure; they both pinch-out against the basement of the two colliding plates (the Serra Morena to the north and the Moroccan Meseta to the south). In the Guadalquivir basin, the thickness of the Neogene cover may reach a maximum of 1.5 km beneath the Subbetics frontal thrust (Fernàndez 1998), and a similar depth is inferred on geological profiles across the Rharb Basin (Platt 2003). In the western Alborán Sea, a very large amount of Neogene and Quaternary sediments is accumulated, with thicknesses of up to 8 km (Torne 2000, after Soto 1996), intercalated with volcanic deposits emplaced from Eocene to Quaternary (Duggen 2004).
3 THE VELOCITY MODEL
We propose a velocity model of the crust in the region lying between latitudes 34°N and 40°N, and between longitudes 13°W and 5°W. The model includes the major seismogenic zones that are observed offshore SW Iberia, from Gorringe Bank to the Betic-Rif Cordillera. We must dwell on the fact that this model is based on information published by other authors. The model accounts for the gross properties of crustal structure, with the objective of reproducing ground motion at low and intermediate frequencies (f < 0.5 Hz). Overall, the resulting velocity structure is marked by the large variation of crustal thickness that occurs at the ocean–continent transition (OCT), and by the presence of the deep Neogene basins at the western and southern edges of Iberia. In this context, a 3-D approach is clearly required.
3.1 Data set
In this study, the data used to constrain the velocity structure of SW Iberia originate from three types of sources (Fig. 3).
- 1
Wide angle reflection/refraction profiles, which image deep crustal structures, down to the Moho discontinuity, but have a poor resolution for surface layers. In Portugal, the first seismic experiments were carried out in the 1970s (Mueller 1973; Mendes-Victor 1980). The later ILIHA-DSS campaign (Paulssen 1990; ILIHA-DSS Group 1993) focused on the crustal and subcrustal structure of the continental part of the western Iberian Peninsula. On the other hand, the IAM campaign (Banda 1995) which aimed at imaging the crust of offshore Portugal, gave the first insights into the structure of the OCT. Several profiles were published: IAM-3 (González 1996), IAM-5 (Afilhado 1999) and IAM-9 (Dean 2000). With the objective of unifying information originating from these various campaigns, various authors reprocessed and reinterpreted existing data. Matias (1996) reinterpreted more than 35 deep seismic profiles in continental Iberia, using the inversion techniques of Zelt & Smith (1992). Somoza (1999), based on seismic profiles AR01 (Torelli 1997) and IAM-3 (González 1996), interpreted the crustal structure of the Gulf of Cádiz along an E–W transect. More recently, Fernàndez (2004) used existing profiles to build a 1000-km-long lithospheric transect and explore the lateral changes in crustal thickness that occur between the Variscan Massif and the Jurassic oceanic crust. The IBERSEIS campaign (Simancas 2003) also aimed at imaging the Variscan belt across the South Portuguese Zone and the Ossa Morena Zone. This study confirmed the features of the main crustal discontinuities previously identified by Matias (1996).
- 2
Shallow composite profiles, which are based on refraction and high-resolution reflection lines constrained by borehole information and geological interpretations. They give some detail of the structure of the superficial layers, down to the seismic basement. Rasmussen (1998) and Carvalho (2006) focused on the Lusitanian Basin formations, and on the Neogene cover that overlie them, in the Lower Tagus Valley Basin. Terrinha (1997) interpreted the structure of the Algarve Basin. Flinch (1996) and Platt (2003) examined the configuration of the Mesozoic and Cenozoic formations outcropping in the Betic-Rif Cordillera, and Garcia-Castellanos (2002) studied the processes of sediment infill of the Guadalquivir Foreland Basin in response to the flexure of the lithosphere.
- 3
Gravity modelling profiles, which are useful to constrain lateral variations at the crustal scale, and help correlating shallow and deep profiles, since gravity anomalies are affected by the presence of both thick sedimentary layers and Moho depth variations. Hayward (1999), based on new seismic reflection and sonar data, and using seismic profiles from Purdy (1975), Whitmarsh (1990), Pinheiro (1992), and gravity modelling of Souriau (1984) and Chen & Grimison (1989), built a NW–SE cross-section of Gorringe Bank. Gràcia (2003a) proposed a NW–SE crustal model across Guadalquivir Bank, using deep-seismic reflection data of the IAM GC1, GC2, GC3 and T3 profiles (Banda 1995; Tortella 1997), seismic multichannel seismic profiles of Maldonado (1999) and BIGSETS BS1, BS3, BS5 and BS7 profiles (Mendes-Victor 1999; Zitellini 2001). Torne (2000) focused on the Alborán Sea, and constructed a topographic map of the seismic basement and Moho in the area.
3.2 Method
The challenge we encountered in establishing a model lies in producing a 3-D correlation between the available 2-D profiles. We first assumed that the crust is stratified, and is made of a superimposition of a finite number of layers, with varying depths and thicknesses. Only the depth of each interface between layers has to be specified at a finite number of points, depending on the expected resolution; then, a triangulation scheme, with linear interpolation, is applied to fill the spaces between these points; finally, a set of physical parameters (P-wave velocity, S-wave velocity, density and attenuation) is assigned to each layer. We also assume that one can describe both the continental and oceanic crust with the same layers, by coupling layers that have similar wave propagation velocities and densities in the two domains. This supposition was used in order to facilitate the conversion of existing seismic/gravimetric profiles into 2-D velocity models, and does not preclude lateral variations of other physico-chemical parameters of the rocks that constitute each layer. Moreover, the resolution of seismic transects, and the large spacing between individual profiles provides insufficient information to enable us to locate small-sized lateral discontinuities in the area of study. As a result, only large wavelength variations of major intracrustal layers thicknesses are considered. In particular, the nature of the transitional domain imaged by the profiles shot across the OCT (González 1996; Afilhado 1999; Dean 2000) will not be discussed.
Following Matias (1996), we identified five crustal layers with distinct physical properties, overlying the upper mantle, modelled as a half-space with a small velocity gradient. The Moho is modelled by a large velocity discontinuity. Inside each crustal layer, the physical parameters vary linearly so that velocity remains continuous at layer interfaces. We have tested an alternative strategy, with uniform velocities inside each layer, and a small discontinuity (<0.3 km s–1) at each interface. We concluded that this does not affect seismograms significantly, as seismic waves refracted or reflected at internal discontinuities of the crust generally have small amplitudes, especially at low frequency. On the other hand, the larger velocity discontinuity (∼1 km s–1) that occurs at the contact between the basement and the sedimentary cover is preserved, since it may be responsible for the trapping of seismic waves inside sedimentary basins, and influences the duration and the amplitude of ground motion. To account for such basin-related effects, we attached great importance to the accurate location of the seismic basement. In addition, we distinguished two types of sediment, with different velocities. The deepest sedimentary layer consists of indurated pre-Miocene sediments, and the shallowest layer is made of less consolidated Neogene sediments. This distinction is crude, and will need to be refined in future studies. A water layer has also been included in the model, in order to account for the complex bathymetry.
Since this model is essentially a P-wave velocity model, we used a fixed Vp/Vs ratio of 1.73 (Poisson's ratio of 0.25) to deduce S-waves velocities. We observed that higher values of this ratio (up to 2.16) only produced a moderate amplification of ground motion inside the deep basins, in any case lower than 30 per cent. Densities were set based on experimental measures of density for a set of crustal rocks (Holbrook 1992). Modelled physical parameters are summed up in Table 1. Map views of the topography of the base of the Neogene cover and of the Cenozoic sedimentary layer are presented in Figs 4(a) and (b), respectively. Fig. 5 shows a series of cross-sections through the velocity model.
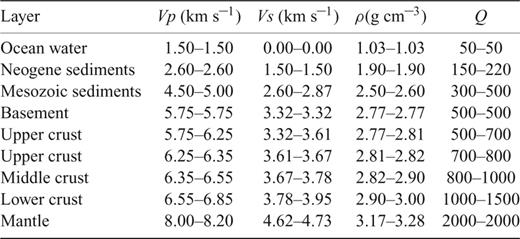
Velocity model parameters. Vp: P-waves velocity; Vs: S-waves velocity; ρ: density and Q: attenuation factor.
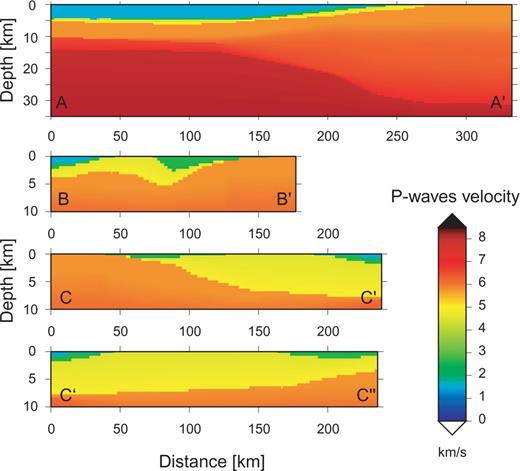
Cross-sections of the P-waves velocity model, with a grid spacing of 0.5 km. See Fig. 4 for locations. Cross-section A–A′ corresponds to the ocean-continent transition offshore Cape São Vicente along the profile imaged by González (1996). On cross-sections B–B′ and C–C′–C″, one can see the shallow (down to basement) structure of the major sedimentary basins. Yellow layers correspond to indurated sediments (Mesozoic and Palaeogene units), and green layers correspond to recent, poorly consolidated sediments (mostly Neogene and Quaternary units).
4 INTEGRATION OF THE VELOCITY MODEL INTO THE FINITE-DIFFERENCE SCHEME
4.1 Numerical method
4.2 Computational issues
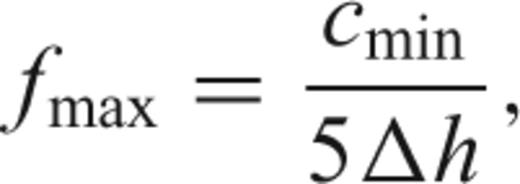
Eq. (1) implies that the spectral content of waves propagating in a complex medium is correctly synthetized at low frequencies only: the highest frequency is limited by the presence of low shear velocity layers, and by model resolution. Refining the mesh enables higher frequencies to be studied, but at a high computational cost: decreasing grid spacing by a factor of 2 would allow fmax to be multiplied by 2, but would increase computation time by a factor of 16. The main limitation of the technique is that most of the model is considerably oversampled (Stidham 1999). In this respect, the spectral element method (Priolo 1994; Faccioli 1997; Komatitsch & Vilotte 1998), based on a finite-element scheme, is more flexible in terms of meshing, and tends to replace the finite-difference method for regional ground motion studies. However, the possible improvements in accuracy for higher frequencies (f > 0.5 Hz) provided by this alternative method are currently limited by our knowledge of the velocity structure in SW Iberia. Indeed, low velocity layers are usually present at shallow depth, in sedimentary basins, and depth-to-basement, for instance, is only constrained with a vertical resolution of approximately 500 m. Hence, we chose to use the finite difference method because of its simplicity and efficiency at the level of accuracy that we seek to achieve in this study. Topography above sea level was not modelled. However, the effects of topography are expected to be low in the region of study: topography is gentle, with altitudes lower than 1000 m, and generally lower than the minimum grid spacing used in this study.
The computations have been performed on a biprocessor Linux station (two 3.40 GHz Pentium 4, with 3 GB of RAM). A speed of approximately 400MFLOPs is achieved, which allows large problems to be run in a reasonable time. However, memory limitations did not allow us to run simulations for a grid consisting of more than ∼5 × 10⁷ nodes. Consequently, in the case the 2003, 2004 and 2006 earthquakes, for the 500-km long, 450-km wide and 50-km deep model we considered, grid spacing was limited to 0.6 km. Given the minimum shear wave velocity of 1.5 km s–1 in the grid, the maximum frequency is 0.5 Hz.
The amount of memory required for the 0.6 km grid did not allow us to include attenuation in the modelling parameters. However, by performing small-scale tests, we found that, in the frequency range considered here, and given anelastic parameters given in Table 1, the inclusion of attenuation induces a moderate decrease (20 per cent) of Peak Ground Velocity, essentially for distant stations, while increasing significantly (75 per cent) computation time. Thus, seismic moments obtained in this configuration might by slightly underestimated.
4.3 Fault dimensions and rupture dynamics
5 WAVEFORM AND SPECTRAL AMPLITUDE MODELLING
5.1 Method
The hypocentral depth is arbitrarily fixed to 30 km for the three earthquakes, that is about half of the brittle lithosphere thickness in this area (Grimison & Chen 1986). We used a 0.6-km grid spacing, with a grid depth of 50 km, for the computation of seismic wave propagation. The calculation was run over 7000 times steps, with a time step of 0.03 s; this corresponds to a simulation of 210 s. The three components of the synthetic seismograms are computed at various stations, located in different geological settings, and are compared with observed seismograms. These stations are located at distances ranging from 174 to 449 km (Fig. 1). The data originate from two types of instruments, with different cut-offs at low frequencies: short period seismometers (fc∼ 0.1 Hz) operated by the Instituto de Meteorologia of Lisbon (PTEO, PBEJ, PLOU, PTOM and PCBR), and broad-band seismometers (fc < 0.1 Hz) operated by the Instituto Superior Técnico of Lisbon, Portugal (PMST and PACT), the University of Évora, Portugal (EVO) and the Real Instituto y Observatorio de la Armada of San Fernando, Spain (SFS). Occasionally, one or two components of the recorded ground motion can be missing, due to a saturation of the seismometer, or a malfunction of the recording device.
We compared synthetic and observed seismograms using various criteria. Because of the large uncertainties introduced by the limited constraints on source parameters, propagation medium structure, and given the large epicentral distances considered here (often between 200 and 450 km), we cannot expect a perfect fit of the observed and synthetic seismograms. Moreover, the data is limited and mostly short period. As a consequence, to validate our velocity model, we can only compare the broad characteristics of seismograms, for periods ranging from 2 to 10 s.
5.2 Focal mechanisms
In this section, we focus on three recent earthquakes of moderate magnitudes that struck the region located between the Horseshoe Abyssal plain and Cape São Vicente, approximately 80 km southwest the Gorringe Bank (Fig. 1). In this context, several factors constitute obstacles to the study of instrumental seismicity in the Azores-Gibraltar Fault Zone. First, the epicentral locations of small events (M∼ 3–4) are inaccurate. Second, hypocentral depth estimates of moderate earthquakes (M∼ 4–5) are difficult to constraint, thus impeding unambiguous determinations of fault parameters. Third, capturing the dynamic behaviour of rupture for larger earthquakes (M > 6) is difficult. These difficulties primarily arise because of geometrical limitations: the large distances between sources and receivers (∼100 km at best) and the poor azimuthal coverage (often less than 90°). Only the installation (and maintenance) of a large number of Ocean Bottom Seismometers will resolve this problem in the long run. Moreover, due to the use of a 1-D velocity model, instead of a more realistic 3-D velocity model, large uncertainties of take-off angles are responsible for a systematic trade-off between focal mechanism and hypocentral depth.
In our computations, we use the epicentral coordinates provided by the Instituto de Meteorologia (IM), Lisbon. In the case of the 2003 July 29 and 2004 December 13 earthquakes, the focal mechanisms computed by the Instituto Andaluz de Geofisica (IAG) of Granada University (Stich 2003, 2005), and the Instituto de Meteorologia (IM) of Lisbon (Carrilho 2005) are shown in Table 2. The solution provided by Stich (2005) are obtained by minimising the misfit between observed and synthetic waveforms at various broad-band stations, using a grid search over focal parameters and hypocentral depth; a reflectivity method, applied to an appropriate 1-D velocity model, is used to compute the synthetic seismograms. The computed focal mechanism is generally similar to the solution provided by the Centroid Moment Tensor Project (HRV) of Harvard University or the Swiss Seismological Service (ETHZ) of Zurich. Carrilho (2005) uses first-motion polarities at stations located at shorter distances, and spread over a larger range of azimuths. The two methods are complementary, and give insights into different spatial scales of the coseismic rupture. Moment tensor inversions provide a view of the overall kinematics of the rupture, and therefore, on the strain regime in operation, but sometimes suffer from significant uncertainties on nodal plane configurations. First motion studies, which exploit high-frequency information, are useful in constraining the strike of, at least, one of the two nodal planes, but can lead to multiple sets of solutions with completely different mechanisms. For the 2003 and 2004 earthquakes, we chose to test the solutions obtained by the two methods, and to keep the focal mechanism that gives the best fit between observed and simulated seismograms.
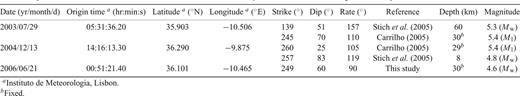
Epicentral coordinates and focal mechanisms discussed in this study for the three moderate magnitude earthquakes.
The 2003 July 29 earthquake was the strongest event occurring in the area since the 1969 February 28 earthquake (López-Arroyo & Udías 1972; Fukao 1973). The two events fall in the same region, and could have originated from the same fault, although the uncertainties on epicentral locations (approximately 20 km) do not allow this hypothesis to be confirmed. Stich (2003) and Carrilho (2005) find thrust mechanisms, with a strike-slip component, consistent with a N–S to NNW–SSE direction of maximum compression (Ribeiro 1996; Borges 2001). The two solutions agree on a NE–SW striking nodal plane, with a steep NW dip, which has almost the same configuration as the inferred fault plane of the 1969 earthquake. We tested the solutions of Stich (2003) and Carrilho (2005), with a fixed focal depth of 30 km, and concluded that the solution provided by Stich (2005) reproduces the observations better.
The 2004 December 13 earthquake occurred closer to the coast, at the southwestern extremity of the São Vicente Canyon, and could be attributed to activity of the Horseshoe Fault, a NE–SW striking thrust fault, with a dip towards SE. This fault was imaged on multichannel seismic profiles (Gràcia 2003b) to a depth of 12–15 km, and possibly to the Moho, which lies at a depth of approximately 15–18 km in the area (González 1996). The mechanism proposed by Carrilho (2005) is compatible with a rupture on the inferred steep SSE dipping Horseshoe Fault; the solution of Stich (2003) suggests a shallow eastward dipping thrust, which is the type of faulting below the São Vicente Canyon, 30 km away to the NE (Zitellini 2001). However, the magnitude of the earthquake (Mw= 4.8) is not sufficient to ensure its tectonic significance, and regional tectonic interpretations using such small events are not reliable. We tested the two solutions for various hypocentral depths, and concluded that the solution of Carrilho (2005) gives slightly better fits than the solution of Stich (2003) at all tested depths, the best fit being obtained for a depth of 21 km.
In the case of the 2006 June 21 earthquake, because of the lower magnitude of the event, a moment tensor inversion was only performed by the Instituto Geografico Nacional (Madrid, Spain). However, the quality of the solution is low, due to the very small azimuthal coverage of the three stations used for the inversion (15°). Therefore, we determined the focal mechanism using first motion polarities, with 27 polarities in Iberia, one polarity in Morocco, and one polarity in the Madeira Island (∼1000 km to the SW of Cape São Vicente); we also tested the two 1-D regional velocity models proposed by Stich (2003) and Carrilho (2005). We found that the resulting focal mechanism is mostly sensitive to the position of the hypocentre with respect to the simulated Moho discontinuity, and only marginally depends on the 1-D velocity model used. Below the Moho, the mechanism is predominantly strike-slip, with roughly N–S trending P-axis, and a horizontal E–W trending T-axis. Beneath the Moho, an inverse mechanism is found, with the P-axis trending NNW–SSE, and the T-axis roughly vertical. The latter solution, with a pure thrust mechanism, and a preferred fault plane striking ENE–WSW, steeply dipping towards north, is more consistent with observed principal axis orientations in the Horseshoe Abyssal Plain, determined by the study of available focal mechanisms (Buforn 2004). Moreover, using the finite-difference scheme, we tested both solutions at a fixed hypocentral depth of 30 km, and concluded that the thrust-type solution gives better results.
5.3 Results
Because of the lack of high-frequency content of the synthetics, the first arrival phase, corresponding to direct P waves, is not sharply defined, and the polarity of this phase cannot be determined. As a consequence, arrival time is ambiguous, and in order to reduce uncertainties, we chose to pick this time by considering a fixed threshold for the triggering of phase picking. We subsequently adjusted the origin time of the event so that the average delay between synthetic and observed traveltime of the Pn phase for all stations is equal to zero. We did not introduce any station-related corrections to compensate the absence of topography in the velocity model, or to simulate the existence of a low velocity layer at shallow depth. The resulting differences between observed and simulated Pn traveltimes are generally less than 1 s, except for one case, where it is of 1.5 s (Fig. 6). Considering a P-wave velocity of 8 km s–1 in the hypocentral region (for hypocentral depths larger than 15–20 km), these values can be due to a mislocation of the epicentre by 8–12 km. This is a reasonable estimate, given the uncertainty commonly observed for earthquake locations offshore SW Iberia (∼10–15 km). We conclude that the velocity model correctly reproduces the observed traveltimes for first-arrival Pn waves. Moreover, one can suspect from Fig. 6 that a systematic error is present, with overestimated traveltimes for large epicentral distances, and underestimated traveltimes for small epicentral distances.
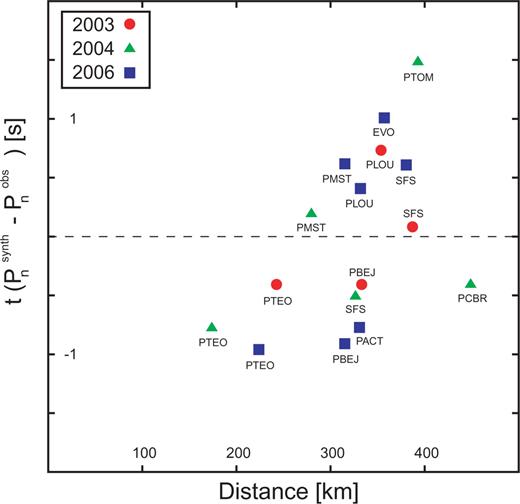
Computed traveltime of first arrival P waves (Pn phases) for the three moderate earthquakes shown in Fig. 1 (see text for discussion). A trend can be inferred, suggesting that arrival times are systematically delayed for large epicentral distances.
As a second step, we directly compared the amplitudes of synthetic and observed displacement seismograms, as well as the corresponding spectra. We cut seismograms 10 s before and 100 s after the first arrival phase (picked using the technique described above). This operation allows the largest amplitude oscillations, which are carried by surface waves at this epicentral distance range, to be included. The comparison of all computed waveforms with observed seismograms is shown in Fig. 7. Both signals are bandpass filtered between 0.1 and 0.5 Hz, using a two-pass four-pole Butterworth filter.
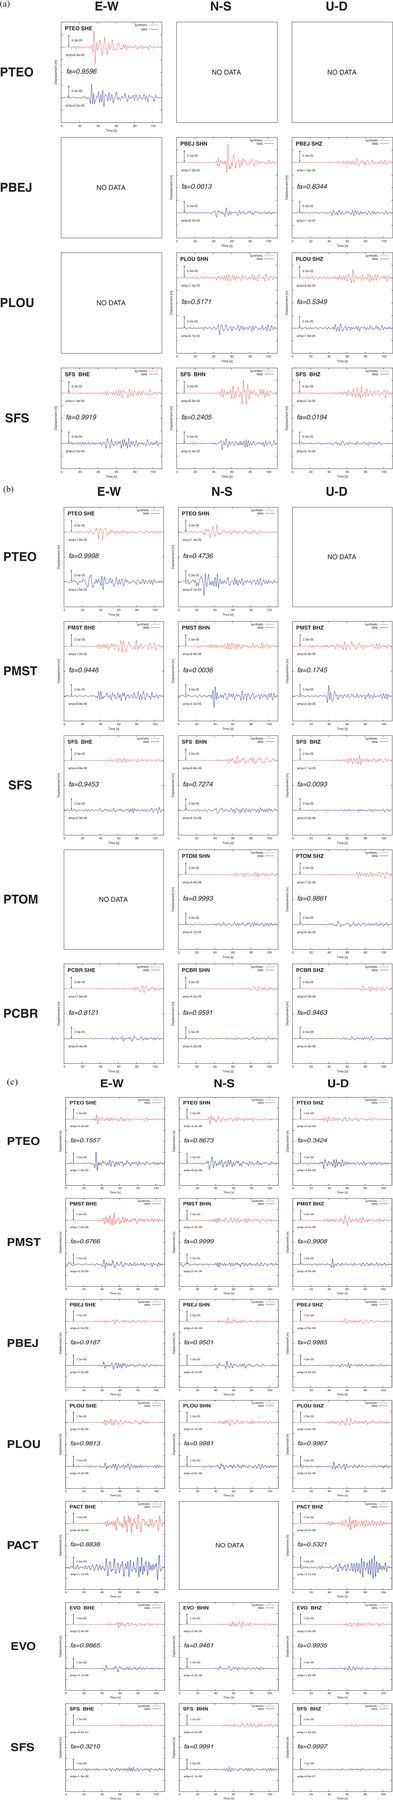
Comparison between computed (in red) and observed (in blue) waveforms for (a) the 2003 July 29 earthquake, (b) the 2004 December 13 earthquake, and (c) the 2006 June 21 earthquake. The waveforms have been filtered between 0.1 and 0.5 Hz. The goodness-of-fit factor fa is computed using the amplitude of the filtered waveforms, and is defined in eq. (3).
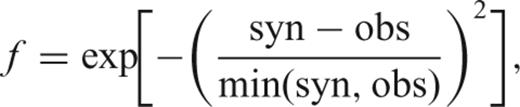
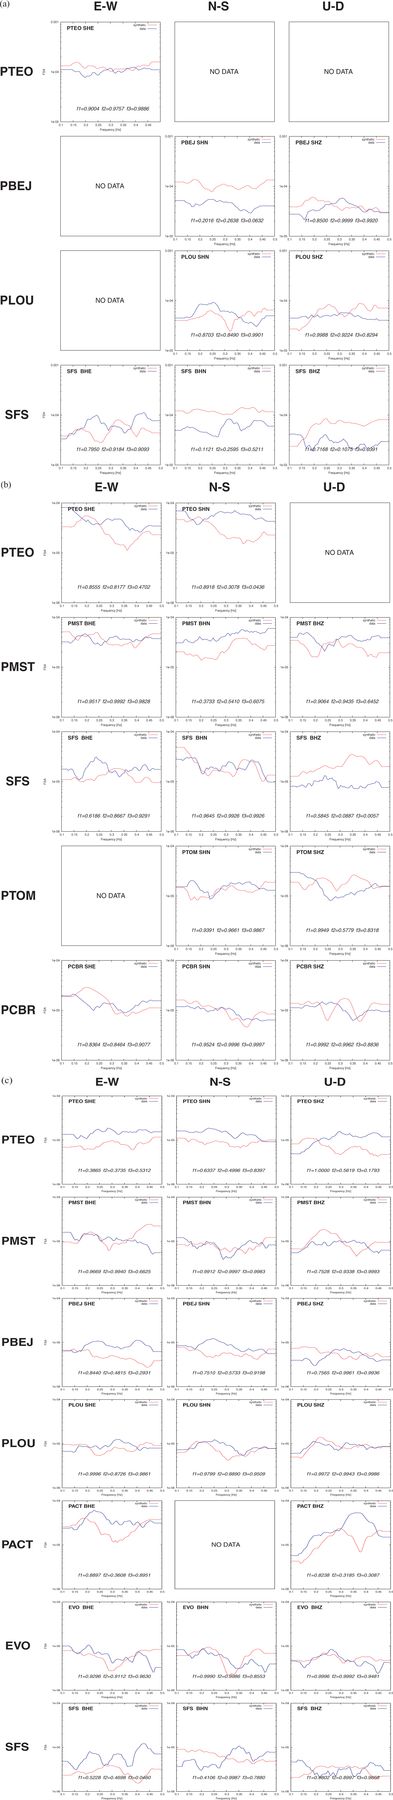
Comparison between computed (in red) and observed (in blue) spectra for (a) the 2003 July 29 earthquake, (b) the 2004 December 13 earthquake and (c) the 2006 June 21 earthquake. The goodness-of-fit factors f1, f2 and f3 are calculated for the average amplitude spectra inside the 0.1–0.3, 0.2–0.4 and 0.3–0.5 frequency windows, respectively.
For the 2003 earthquake, there is a very good agreement between synthetic and observed displacement seismograms at stations PTEO, PLOU, PBEJ and SFS: the ratio of P/S amplitudes (except at station SFS), the duration of shaking, the time and amplitude of the largest oscillations, and the frequency content are correctly reproduced by the synthetics.
In the case of the 2004 earthquake, the fit is reasonably good at stations PTEO, PMST and SFS. At stations PTOM and PCBR, the largest amplitude phases seem to arrive with a significant advance compared to the synthetics. This could be due to the larger distance of the stations (400–450 km), and to a discrepancy between modelled and real crustal structure in central Portugal (which lies at the limit of the model). However, the fit between observed and synthetic spectra is good in most cases (except for component U-D at station SFS).
The 2006 earthquake gives the best results: the fit is very good at stations PTEO, PBEJ, PLOU and EVO. At station SFS, the spectral fit is good, but the observed and synthetic seismograms are not very similar, especially for component E–W. At station PMST, discrepancies can be found between observed and synthetic seismograms, concerning the time of occurrence of the largest amplitude oscillations; however, corresponding spectra are in very good agreement. At station PACT, late large amplitude phases are visible on the observed Z-component of ground motion. These phases can be interpreted as basin-related oscillations, that are responsible for the long duration of shaking observed on the E–W component (unfortunately, the N–S component of the recording seismometer was out of order at the time). This long-lasting oscillation is well reproduced on synthetic seismograms.
The records made at stations PTEO and SFS have been available for the three earthquakes, and allow conclusions to be drawn on the validity of the model. At station PTEO, which is located on the Palaeozoic basement, the pulse corresponding to the arrival of the Sn is very well reproduced, and the slightly lower amplitude phases, that arrive later than the Sn phase, are also very well simulated. At station SFS, one can observe on real seismograms a phenomenon of amplification of the horizontal components of ground motion, compared to the vertical component. At these stations, our simulations do not reproduce this difference between horizontal and vertical components, and the phases that arrive between the Pn and Sn phases have a systematically lower amplitude on the synthetics. However, we capture well the large amplitude phases that arrive after the Sn phase (30–35 s after phase Pn) on horizontal components, and the spectral fit is relatively good at intermediary frequencies.
These observations show that the velocity model needs to be improved in various locations, but that the level of ground motion is reasonably well predicted for all available stations. The amplitude of ground motion, which has been shown to be strongly dependent on the geological setting, was correctly modelled for most sites, including for distant locations. Generally, the best fit is obtained for factor f1, which means that the velocity model is more efficient at reproducing low frequency (0.1–0.3 Hz) seismograms. Higher frequencies are linked with a more detailed structure of the crust, which are poorly constrained (and often not appropriately discretized) in most of the studied area. The value of Peak Ground Displacement (PGD) is also well simulated. We have checked that the use of velocity seismograms gives similar results.
6 CONCLUSION
The aim of this study was to improve assessment of seismic hazard through the development of realistic methods for the prediction of ground motion in SW Iberia. Due to the large magnitude of the events that struck the region in the past, a low frequency approach was adopted. The influence of vertical and lateral heterogeneities, inherited from the tectonic evolution of the region since the Palaeozoic, has been taken into account. A complex (3-D) velocity model was built down to the Moho discontinuity, and resulted in a velocity structure substantially different from a simple 1-D layered model. The model was implemented using a finite-difference scheme, and we computed synthetic seismograms for three recent earthquakes of moderate magnitude (4.6 < Mw < 5.3), in the frequency range 0.1–0.5 Hz. The comparison of these seismograms with observed waveform gave good results, and the fit in terms of arrival time, amplitude and frequency content was satisfactory.
We conclude that our velocity model gives a reasonable representation of the structure of the crust in SW Iberia. However, the velocity model proposed here should be considered as a background model that needs to be improved, particularly with the addition of more information about near-surface velocity structure. This may be performed at a low cost by the integration of the information provided by the large number of commercial boreholes and seismic soundings made during the 1980s in the Gulf of Cádiz and in the Lusitanian Basin.
The declared objective is to obtain, in the future, a model similar to the models used routinely in the Western United States or in Japan to compute synthetic intensity maps, improve hypocentral location estimations and assess seismic risk in a systematic way. A first step is made in the companion paper (Grandin 2007) that follows the present paper and uses the velocity model to model strong motion due to the 1969 (Ms= 8.0) and 1755 (M= 8.5–8.7) earthquakes.
ACKNOWLEDGMENTS
We thank Shawn Larsen for supplying the code E3D. We also thank the Instituto Superior Técnico (IST), Lisbon, Portugal, the Instituto de Meteorologia (IM), Lisbon, Portugal and the Western Mediterranean Seismic Network (WM) of Real Instituto y Observatorio de la Armada (ROA), Univesidad Complutense de Madrid (UCM), Spain, for providing the seismic data that was used in this study. Some figures were made using the GMT software written by P. Wessel and W. H. F. Smith.
This work has been developed with the support of the Fundação para a Ciência e a Tecnologia, through project POCTI/CTE-GIN/59994/2004: ‘Finite source modelisation and strong motion prediction in Portugal’, and POCTI/CTE-GIN/59750/2004: ‘Seismic tomography of the continental lithosphere in Algarve (Portugal)’ and was largely carried out at Centro de Geofísica de Évora (Portugal). This is also IPGP contribution 2268.
REFERENCES
aInstituto de Meteorologia, Lisbon.
bFixed.
