


Summary
We analysed elevation changes induced by the 1997–1998 Umbria-Marche, central Apennines (Italy) earthquakes. We employed data from a first-order geodetic levelling line measured in 1951, 1992 and 1998. The line bears a record of pre-seismic and coseismic strains associated with the causative fault of the 1997 September 26, 09:40 mainshock (Mw= 6.0).
A first level analysis performed under the assumption of slip homogeneity of coseismic slip shows misfits that cannot be reduced simply by altering the fault size and geometry. A more detailed analysis based on a distribution of coseismic slip obtained from broad-band seismograms provides a better fit and is in agreement with 1951–1992 elevation changes interpreted as precursory slip by previous investigators.
The levelling data sets new constraints on the location, extent, dip and depth of the fault, in full agreement with seismological evidence and images from SAR interferometry. The data show no evidence for slip in the uppermost 3 km of the crust, suggesting that a major and widely recognized normal fault that exists in the area is no longer active and showing a tendency of present tectonic strains to revert the current topographic setting.
Introduction
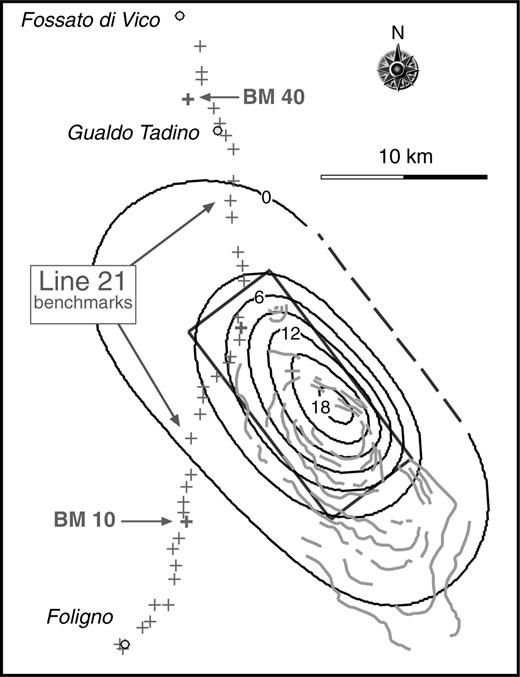
On 1997 September 26, two moderate size but damaging earthquakes (Mw= 5.7 and 6.0, respectively, at 00:33 and 09:40 GMT) struck the Umbria-Marche Apennines near Colfiorito (central Italy), about 30 km east of Assisi and 130 km NNE of Rome, starting an 8 month long seismic sequence. The earthquakes occurred within a ∼50 km long, roughly NW–SE-trending elongated region (Fig. 1), and most of them had a depth smaller than 9 km (Amato et al. 1998; Barba & Basili 2000; Cattaneo et al. 2000; Deschamps et al. 2000). The aftershock sequence was characterized by seven upper-crustal Mw > 5 earthquakes (Ekström et al. 1998; Morelli et al. 2000) and culminated with the 1997 October 14, Sellano (Mw= 5.6) and the 1998 April 3, Gualdo Tadino (Mw= 5.1) events, respectively, located near the SE and NW ends of the rupture zone (Fig. 1).
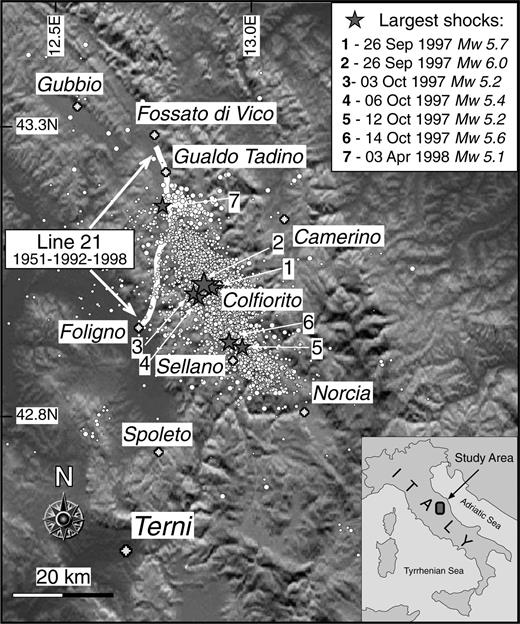
Distribution of the 1997 September–1998 April central Italy earthquake sequence. Stars locate the largest 1997–1998 shocks. The IGM first-order levelling Line 21 crosses the northernmost part of the epicentral area. Instrumental data after Boschi et al. (1998); magnitude data from Ekström et al. (1998) and Morelli et al. (2000).
The 50 km long activated area is located in the central Apennines, a fold-and-thrust belt generated by progressive northeastward compression during the Neogene. Perhaps at the end of the Lower Pleistocene, this tectonic regime turned into chain-perpendicular extension (e.g. Montone et al. 1999) accommodated by a rather continuous belt of NW-trending normal faults (e.g. Valensise & Pantosti 2001a). Morphotectonic and structural analyses performed in the area revealed the presence of a complex system of normal faults, some of which were commonly interpreted as being active. In particular, the Colfiorito area was interpreted as a Quaternary intramontane basin bounded to the northeast by a NW–SE-trending, SW-dipping transtensional active structure, the Mt Le Scalette fault (Cello et al. 1997).
Both historical and instrumental seismicity (Fig. 2) suggest that the 1997–1998 seismic sequence fills a seismic gap along the Apennines. The only large earthquake that affected the region around Colfiorito in historical times occurred in 1279. Its poorly constrained damage pattern partly resembles that associated with the September 26, 09:40 shock (Boschi et al. 1998, 2000). More recently, moderate-size earthquakes occurred on 1984 April 29 near Gubbio (Ms= 5.3; Haessler et al. 1988) and on 1979 September 19 near Norcia (Ms= 5.8; Deschamps et al. 1984), respectively, located off the northwest and southeastern ends of the 1997–1998 epicentral zone (Fig. 2).
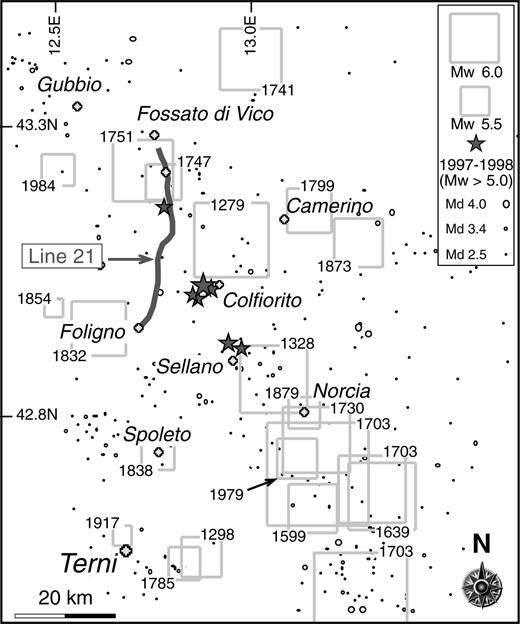
Distribution of pre-September 1997 historical and instrumental seismicity. Note that no significant seismicity has occurred in the 1997–1998 epicentral area since the 1279 earthquake. Stars locate the largest 1997–1998 shocks. Historical data from Boschi et al. (2000); instrumental data from ING Monthly Bulletin, 1985–1996.
Moment tensor analyses (Ekström et al. 1998; Morelli et al. 2000) of the seven upper-crustal, Mw > 5 earthquakes of the sequence exhibit almost pure normal faulting mechanisms with a nearly horizontal NE-trending tension axis. The depth distribution of the aftershocks (Amato et al. 1998; Barba & Basili 2000; Cattaneo et al. 2000; Deschamps et al. 2000), and various analyses of coseismic surface displacements based on GPS and SAR interferometry data (Hunstad et al. 1999; Stramondo et al. 1999; Salvi et al. 2000), suggest that slip occurred along the SW-dipping nodal planes characterized by a low dip angle (Ekström et al. 1998; Morelli et al. 2000).
Several small surface ruptures, some of which are coincident with mapped faults, and the reactivation of landslides over a wide area were reported following the September 26 mainshocks. Most investigators (e.g. Basili et al. 1998; Cello et al. 1998; Cinti et al. 1999; Galli & Galadini 1999; Boncio & Lavecchia 2000; Cello et al. 2000; Cinti et al. 2000) interpreted these ruptures as secondary features due to gravitational readjustment or differential compaction. This conclusion was later confirmed by InSAR data (Stramondo et al. 1999), showing no fringe discontinuity across any of the mapped faults and stressing the non-tectonic nature of all the observed ruptures.
The epicentral area is crossed by a fundamental branch of the Italian first-order levelling network. This route, identified as Line 21, was measured in 1951, 1992 and 1998. In this work we focus on the record of coseismic elevation changes supplied by Line 21 and compare it with elevation changes predicted using model faults inferred combining short-period and regional broad-band seismological data (Amato et al. 1998; Ekström et al. 1998; Pino et al. 1999; Barba & Basili 2000; Morelli et al. 2000; Pino & Mazza 2000). We employed both a standard uniform slip approach and a strategy involving spatial variability of slip to address the following questions:
may geodetic levelling data help constrain more firmly the fault dimensions, their top depth and their geometry, with special reference to their anomalously shallow dip?
does a uniform slip analysis provide a satisfactory fit to the data?
if not, is the evidence for non-uniformity of slip somehow related to the precursory slip postulated by De Martini & Valensise (1999) based on pre-1997 elevation changes?
DATA
Based on the awareness that Line 21 crosses the epicentral area, soon after the 1997 September 26 earthquakes we focused on this levelling route, which runs from Foligno, central Umbria, to Fiumesino, on the Marche coast, and has a total length of about 125 km. We looked for any available pre-earthquake levelling observations, and subsequently pushed for its prompt re-survey to gather crucial data on tectonic deformations induced by the 1997–1998 events. IGM (Istituto Geografico Militare), the branch of the Italian Army that operates the national first-order levelling network, responded by planning a new survey of the entire route. Data gathered during re-levelling of Line 21 and of other nearby routes of potential interest were made available in 1998 December. In this paper we analyse in detail only the first (southernmost) section of Line 21 (about 45 km), which trends almost N–S between Foligno and Fossato di Vico (Fig. 1), but we still refer to this subset as Line 21. A synthetic description of the levelling technique and of Italian standard levelling procedures can be found in De Martini & Valensise (1999) and references therein.
The 1951 and 1992 surveys
Based on the analysis of elevation changes recorded along Line 21 prior to the 1997 earthquakes, De Martini & Valensise (1999) documented the occurrence of localized subsidence (up to 25 mm) along a 12 km long section of the route sometime between 1951 and 1992. They suggested that the geodetic signal is the result of ∼10 cm of primarily aseismic slip, concentrated along the northernmost 5 km of the causative fault of the 1997 September 26, 09:40 earthquake. Finally, they anticipated that coseismic subsidence up to ∼80 mm should have been recorded along Line 21 about 22–29 km north of Foligno (see their fig. 3b).
The 1992 and 1998 surveys
The 1992–1998 elevation changes recorded by Line 21 were obtained simply by subtracting the relative height of 38 BMs surveyed in 1998 from the height of the same benchmarks (BMs) surveyed in 1992, under the assumption that the elevation of the Foligno nodal BM remained unaltered between the two surveys. The assumption is supported by the observation that the elevation changes taper to zero as the line approaches Foligno. The data show maximum subsidence of 78 mm, maximum uplift of 16 mm and a signal wavelength >10 km. Like any other levelling survey, however, these measurements are subject to both random and systematic errors. Those related to subsidence induced by fluid withdrawal, rod graduation procedures and vertical movements of the instrument and of the rods have already been discussed and found to be negligible by De Martini & Valensise (1999). We are also aware that different refraction conditions during two subsequent surveys may also affect the observed elevation changes. From original field reports we verified that the 1992 and 1998 surveys were performed under similar governing factors, and hence we can confidently conclude that no significant refraction corrections are necessary. Finally, in order to test a possible correlation between the topography along Line 21 and the observed 1992–1998 elevation changes (commonly referred to as elevation-dependent error), we explored the measured tilt versus slope between pairs of adjacent BMs, following a procedure first proposed by Stein (1981). The slope of the linear interpolation through the data (±0.6 × 10⁻⁵) is lower than the threshold (±1.5 × 10⁻⁵) above which a correlation between the observed tilt and slope may exist (Stein 1981), and thus we considered this error to be negligible. The closure error calculated by IGM for all the levelling circuits that connect with Line 21 is ∼1 mm km−1 for both the 1992 and 1998 surveys; since this error is larger than all other estimated uncertainties, we retained it as a meaningful measure for the overall uncertainty.
MODELLING
Our modelling considers only the seven upper crustal Mw > 5 events of the 1997–1998 Umbria-Marche sequence (Ekström et al. 1998; Morelli et al. 2000, see Fig. 3). As a result of the absence of unequivocal surface faulting, to establish the initial fault parameters of our forward models we:
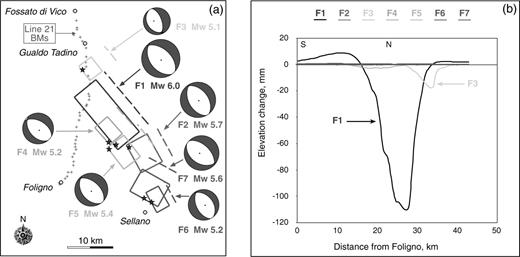
(a) Location of the causative faults of the seven upper-crustal Mw > 5 earthquakes (1997 September–1998 April) and benchmarks of Line 21 surveyed in 1992 and 1998. Focal mechanisms are from Ekström et al. (1998) and Morelli et al. (2000). Solid boxes and dashed lines represent the surface projection and the intersection of the rupture plane with the surface for each fault. Note that no fault reaches the surface. (b) Modelled contribution of each of the seven faults of Fig. 3(a) to the elevation changes measured along levelling Line 21. Slip is assumed to be uniform over the entire fault planes. Only F1 and F3 contribute significantly to the elevation changes along Line 21.
forced all faults to pass through the respective instrumental hypocentres (given in Amato et al. 1998; Barba & Basili 2000);
adopted the fault geometries and seismic moments resulting from CMT analyses (given in Ekström et al. 1998; Morelli et al. 2000);
assumed the unilateral rupture propagation scheme proposed by Pino et al. (1999) and Pino & Mazza (2000) for the two largest shocks, that is to say, we assumed that their hypocentres lie at one end of their causative faults.
Uniform slip approach
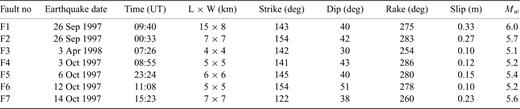
We first tried to discriminate which of the seven upper-crustal Mw > 5 earthquakes could contribute significantly to the displacement of Line 21 (Fig. 3a). Our calculations assume uniform slip on planar, rectangular faults embedded in an elastic half-space, and were performed with a code developed by Ward & Valensise (1989) based on standard dislocation theory. For all faults we also assumed a minimum depth of 2.0 km (that is, all faults are taken to be blind). Table 1 summarizes all adopted parameters for the seven selected shocks/causative faults. The fault responsible for the 1997 September 26, 09:40, Mw= 6.0 mainshock accounts for over 90 per cent of the expected signal observed along Line 21 (Fig. 3b). Only one additional fault, that responsible for the 1998 April 3, Mw= 5.1 shock, is able to produce elevation changes above a minimum threshold (which we arbitrarily set at ±5 mm). As they are very difficult to resolve, any contributions from the other faults are not considered further.
Summary of parameters for the adopted faults.
Calculations made for these two faults under the assumption of slip uniformity (Fig. 4) leave a significant misfit with large residuals in the central–northern section of the investigated levelling line (25–33 km from Foligno, see Fig. 4). The peak of expected subsidence is shifted about 3–4 km to the north and exhibits a magnitude over 30 per cent larger than the observed coseismic signal. We tested that this large misfit is not affected much by changes in fault strike and dip. An obvious way to reduce this discrepancy is to drop the rather strong assumption of slip uniformity for the entire length of F1.
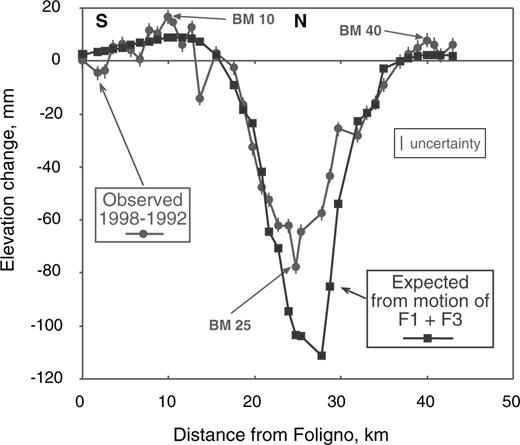
Comparison between coseismic elevation changes observed along Line 21 and those expected from faults F1 and F3, calculated for a uniform slip model. Notice the misfit of the maximum expected subsidence with respect to the observed signal, both in magnitude and location.
Variable slip approach
Previous analyses of the 1997 September 26, 09:40 event based on broad-band seismograms (Pino et al. 1999; Pino & Mazza 2000), GPS and SAR interferometry observations (Hunstad et al. 1999; Stramondo et al. 1999; Salvi et al. 2000) and strong motion recordings (Capuano et al. 2000) suggested strong heterogeneity of coseismic slip. In particular, the maximum dislocation should be concentrated in the southern portion of the fault, near the rupture nucleation. We therefore made a test to find out whether an approach involving spatial variability of slip would reduce the misfit left by the standard uniform-slip analysis. The test is based on the coseismic slip function obtained from regional broad-band seismological data by Pino et al. (1999) and Pino & Mazza (2000) for F1. The technique used for recovering the slip function is extensively described in these papers, but here we summarize the main steps and recall the basic assumptions and constraints.
Relative moment rate functions are derived by applying an empirical Green function approach to the recordings obtained from three broad-band stations located at epicentral distances between 80 and 500 km. A favourable azimuthal distribution allowed the determination of the rupture velocity and slip distribution in spite of the small number of recording sites. The similarity of the epicentral location and source mechanism for the main event and for that used as an empirical Green function ensures a good frequency resolution for the resulting apparent source time functions.
The remarkable azimuthal variability of the relative moment rate functions points to a largely prevalent unilateral effect (southeast to northwest). A fault length of 14 km and a rupture velocity of 2.6 km s−1 are estimated from modelling of the amplitude and duration of these source time functions and under the assumption of unilateral fault propagation. Nevertheless, had the rupture occurred with a circular or bilateral pattern, the inferred rupture length would still represent a lower bound value. The uncertainty associated with the modelling is about 10 per cent.
A slip distribution is then determined through a modified Haskell source model (Kanamori et al. 1992). The model is based on the assumption of slip homogeneity along the fault width. In this case the slip distribution along the length can be obtained from the source time function using simple algebra. For an assigned seismic moment, the slip function is then to be scaled by fixing the fault width, the two being inversely proportional.
The slip distribution obtained by Pino et al. (1999) and Pino & Mazza (2000) through this procedure (Fig. 5a) shows a bimodal configuration where slip in the northern section is less than 60 per cent of the maximum slip in the central–southern section.
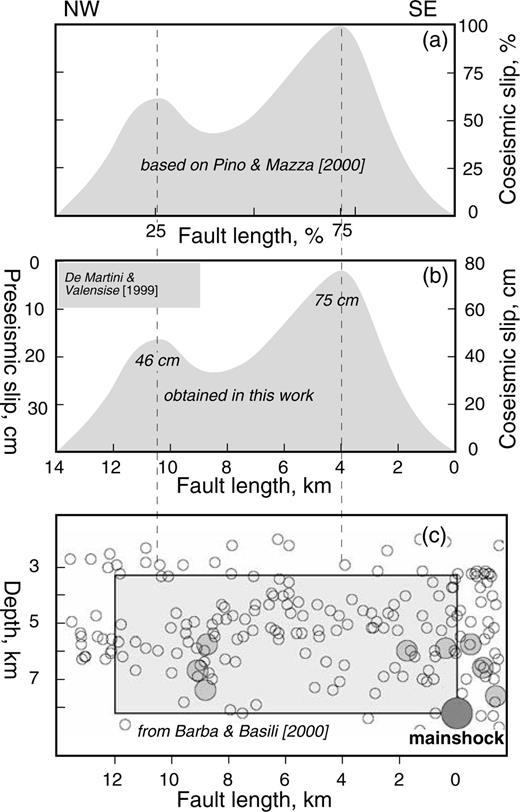
Slip distribution along length of F1: (a) as determined by Pino & Mazza (2000); the scales are non-dimensional since this function may be adapted to different combinations of fault length and width; (b) as determined in this work for the best-fitting model fault; the location and extent of pre-seismic slip determined by De Martini & Valensise (1999) is also shown; (c) distribution of aftershocks following the 1997 September 26 mainshocks, plotted at the same length-scale as the fault shown in (a) and (b), from Barba & Basili (2000) (modified); notice the concentration of aftershocks (light grey and small open circles are M > 4 and M > 2, respectively), around the two main slip patches shown in (a) and (b).
We then performed a grid search analysis by varying the fault length, width and top depth. For each run the slip function is stretched to fit the fault length and then scaled in amplitude to keep the global seismic moment unvaried. Slip variability along strike was simulated by discretizing the fault with seven vertical subfaults, each one characterized by a length equal to one-seventh of the entire fault and by homogeneous slip. The expected elevation changes are then computed as the sum of the seven independent contributions. The fault top, length and width were allowed to vary in the range 12–16 km (with an increment of 1 km), 6–10 km (with an increment of 1 km) and 1.6–5.2 km (with an increment of 0.6 km), respectively, resulting in a total of 175 combinations.
Fig. 6 shows the misfit between the predicted and the observed elevation changes resulting from slip of F1 plus F3. Since the contribution of the latter is negligible (Fig. 3b), all the parameters of this fault (Table 1) were kept unchanged during all tests. Lower rms values are observed for a fault width in the range 7–8 km and for a fault depth of 2.8–4.0 km, corresponding to a maximum depth of 7.9–9.1 km for a 40° dipping fault (Table 1). The fit improves substantially for a length ≥14 km, suggesting that the rupture must have crossed Line 21. Fig. 7(a) shows the best-fitting fault model in map view (length 14 km, width 8 km, depth of fault top 3.4 km); the corresponding fit to the observed elevation changes is shown in Fig. 7(b). Further tests showed that the fit is quickly degraded by even small changes in strike and dip of the fault, which alter the relative position of the uplift and subsidence maxima seen in the data.
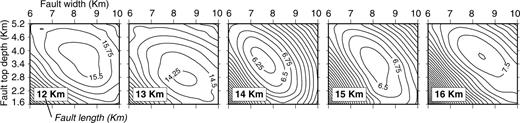
rms misfit (in mm) between predicted and observed surface displacements along levelling Line 21, as a function of fault width and depth of fault top. Each frame refers to the fixed fault length shown in the inset. Contour interval is 0.25 mm. The uncertainty decreases sensibly for fault length ≥14 km.
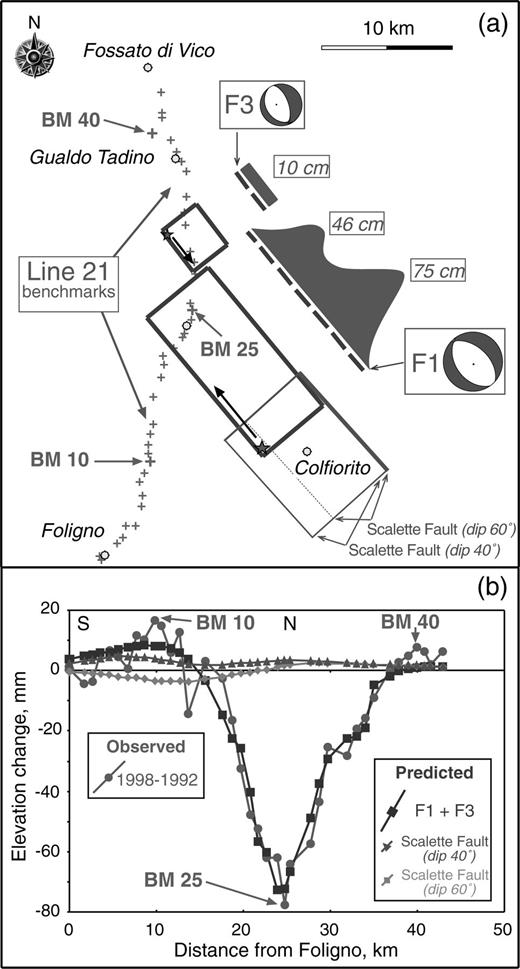
(a) Best-fitting model faults and relative maxima of the variable slip distribution. Directivity (black arrow inside box) from Pino et al. (1999). (b) Observed elevation changes compared with the expected displacements from motion of our best-fitting model faults (F1, F3) and from motion of the Mt Le Scalette Fault of Cello et al. (1997, 1999). See text for further details.
DISCUSSION AND CONCLUSIONS
The analysis of the 1997–1998 coseismic contribution to the elevation changes recorded along IGM levelling Line 21 induced us to focus mainly on the causative faults of the 1997 September 26, 09:40 (Mw= 6.0) and 1998 April 3 (Mw= 5.1) earthquakes, respectively, the largest shock and one of the largest aftershocks of the entire sequence (shown as F1 and F3 in Fig. 3 and Table 1). The location of five additional major shocks of the same sequence suggests that they did not contribute significantly to the observed elevation changes. Although Line 21 shed light essentially on the September 26, 09:40 shock, the modelling and the inferences discussed below have a rather general significance for active faulting along this stretch of the Apennines.
Fault dip and depth
Our best-fitting solution for F1 (Fig. 7) is blind and dips to the southwest at a relatively low angle (40°). The minimum and maximum depth of faulting are 3.4 and 8.5 km, respectively, in close agreement with the aftershock distribution (see, for example, figs 4, 7 and 8 in Barba & Basili (2000); see also Fig. 5c in the present work).
The tests confirm that an anomalously low dip is indeed necessary to fit the uplift recorded above the hanging-wall compartment (southernmost section of Line 21, 5–15 km from Foligno). For faults dipping ≤40° the uplift recorded above the hanging wall exceeds that of the footwall. This ‘bump’ fades away quickly as the dip increases above 40°, and its top and the associated zero-crossing are rapidly misplaced even for minor changes (∼1 km) in fault width or location.
Two major differences arise from the comparison between our results and other fault models derived from GPS (Hunstad et al. 1999) and SAR interferometry data (Stramondo et al. 1999; Salvi et al. 2000). Levelling data require a longer and deeper fault, which could be in agreement with the model derived from interferometry fringes alone (Fig. 8) but not with the GPS data. In fact, the elevation changes expected from our best-fitting model fault and the InSAR fringes (fig. 2 in Stramondo et al. 1999) exhibit similar deformation patterns, both showing tightening of contours/fringes to the NE of the epicentral region. Conversely, the expected maximum subsidence area is shifted by about 1.0–1.5 km northward with respect to the InSAR observations. This could be explained by considering that InSAR data recorded the total surface displacement that took place between 1997 September 7 and October 12, thus including the effects of four earthquakes with Mw > 5.2 (see Fig. 3a and Table 1 for details). Another source of discrepancy between our model and the InSAR fringes is their incoherence towards the northern end of the epicentral region, where two or three external fringes disappear. In contrast, the geodetic levelling line we used is especially suitable for constraining slip at the northern end of the 1997 September 26, 09:40 fault.
Observed InSAR fringes (grey lines) from Stramondo et al. (1999), are compared with the expected displacements from motion of our best-fitting model fault. See text for discussion.
Our solution is quite similar to that obtained from the analysis of strong motion data (Capuano et al. 2000), the agreement being especially good for the top and bottom depth of the fault. Further support on the depth of faulting comes from re-levelling of a 4 km long old aqueduct located in the Colfiorito Plain and running perpendicular to the projection of the top portion of the causative fault of the 1997 September 26, 09:40 shock Basili & Meghraoui (2001). This fortuitous data set strongly suggests that this is a deep low-angle fault that connects upward to the pre-existing steep-angle Mt Le Scalette Fault described by all early investigators of the 1997–1998 sequence.
Slip variability and implications for fault behaviour
Our tests verified that the assumption of uniformity of coseismic slip on F1 is inadequate to reproduce the signal observed along the central–northern section of Line 21. The tests also show that the misfit produced by assuming slip uniformity is not traded-off with fault dip and strike, that is to say, the problem is independent of fault geometry and cannot be solved simply by adjusting these two parameters.
We then introduced a distribution of coseismic slip derived by Pino et al. (1999) and Pino & Mazza (2000) from regional broad-band seismological recordings of the 1997 September 26, 09:40 shock. We scaled this slip function to fit a fault having variable length, width and top depth but a constant seismic moment. For the best-fitting combination of parameters (length 14 km, width 8 km, depth of fault top 3.4 km) the slip distribution exhibits two maxima of 75 and 46 cm, respectively, centred at 4 and 10 km from the southeastern edge of the fault (along strike; Figs 5b and 7a).
We believe this slip pattern suggests the presence of a major and stronger asperity in the central–southern portion of the rupture, which might result from a strong rheological heterogeneity along the fault plane. This conclusion is somehow also supported by the distribution of aftershocks recorded during the first 3 months of the sequence and reported by Barba & Basili (2000) (Fig. 5c), showing a larger density of earthquake release outside and around the two main slip patches.
However, what is the ultimate reason for heterogeneity of coseismic slip along this fault? If we assume that the crustal volume activated during the 1997–1998 seismic sequence is characterized by homogeneous elastic parameters, a constant stress field should give a uniform strain pattern on the 1997 September 26, 09:40 fault plane during a whole seismic cycle. Under this assumption, the 10 cm pre-seismic slip documented by De Martini & Valensise (1999) along the northern portion of the fault plane could justify at least partially the asymmetry in the distribution of coseismic slip. Fig. 5(b) shows that this minor slip patch fits well the ‘missing’ coseismic slip in the northern portion of the fault. What would Line 21 have recorded between 1992 and 1997 September, knowing that the area did not experience any M > 3 earthquake during this time span? Unfortunately, no data are available for this time interval. However, one can speculate that, if a precursory slip did occur on the northernmost section of the 1997 September 26, 09:40 earthquake fault between 1951 and 1992, such a phenomenon must have accelerated or at least continued at the same rate between 1992 and 1997, thus implying that the recorded pre-seismic elevation changes should be considered as a minimum. A slip of 10 cm spread over 41 years yields a minimum slip rate of 2.5 mm yr−1, far more than the ∼1 mm yr−1 slip rate of fastest large Italian normal faults (Valensise & Pantosti 2001b). This implies that the 1951–1992 strains were indeed due to accelerated precursory slip, which could have been detected with modern techniques (for example, with SAR interferometry), provided that the location and overall arrangement of large quiescent active faults is known from independent studies.
2010 Another shallow-dipping blind normal fault?
The 1997 September 26, 09:40 earthquake, and most probably all the other shocks in the 1997–1998 Umbria-Marche sequence, make yet another positively identified example of blind, low-angle seismogenic normal faulting in the Italian Apennines. Other examples include the catastrophic 1908 December 28 Messina Straits earthquake (Mw= 7.0: see, for example, Capuano et al. (1988) and Valensise & Pantosti (1992), among several others) and the moderate-sized 1984 April 29, Gubbio earthquake (Ms= 5.3: Haessler et al. 1988), notably located only 30 km NW of the 1997–1998 epicentral area (Fig. 2). A multidisciplinary study of the M= 6.2, 1995 June 15 Aigion earthquake (Bernard et al. 1997) also revealed an unusual pattern of normal faulting along a low-angle plane for the Gulf of Corinth (Greece), one of the most active rifts in the Aegean (Ambraseys & Jackson 1990; Billiris et al. 1991).
In the case of the Messina Straits, Valensise & Pantosti (1992) contended that the construction of topography in the region is largely controlled by regional uplift, and that low-angle normal faulting represents a major source of seismicity but is a minor player in shaping up the landscape. For the Corinth Gulf, Bernard et al. (1997) maintained that the 1995 Egion earthquake fault cannot be responsible for the long-term topography of the rift, which is rather controlled by larger high-angle normal faults, and suggested that the inception of such low-angle normal faults is very recent. A similar case can be made for the region of the 1997–1998 earthquakes. Although it is generally accepted that the southwest-dipping, high-angle, range-bounding Mt Le Scalette Fault is responsible for creating the Colfiorito basin and hence for shaping up the landscape as we see it today, geodetic evidence for 1997–1998 coseismic strains shows that the fault is no longer active. In fact, present-day deformation testified by the 1997–1998 earthquakes is not emphasizing the basin but is rather disrupting it; while most of the observed topographic relief is due to relatively fast (∼1 mm yr−1) (Dramis 1992; D'Agostino et al. 2001) regional doming of the entire central Apennines, present-day faulting is locally modifying the architecture of the Colfiorito basin, shifting its depocentre to the northwest and forcing its coalescence with other adjacent depressions, as shown by the SAR interferometry images of 1997–1998 coseismic elevation changes (Stramondo et al. 1999; Salvi et al. 2000).
As a further test of the circumstances described above we checked the influence on levelling Line 21 of an Mw= 6 earthquake generated by the Mt Le Scalette Fault, as anticipated by Cello et al. (1997) (written before the earthquake) and restated by Cello et al. (1998) following the 1997–1998 earthquakes. The test assumes a surface breaking geometry (i.e. the fault depth is equal to zero), a fault length and width of, respectively, 10 and 10 km and an average slip of 40 cm (corresponding to an Mw∼ 6.0 earthquake, similar in size to the largest shock of the 1997–1998 sequence). The test was run for two different dips, 60° and 40°, respectively, based on geological and seismological evidence (see Fig. 7). None of the two model faults produce a sizeable geodetic signal on Line 21, confirming that coseismic faulting must have extended far beyond the northwestern tip of the Mt Le Scalette Fault, in an area where no active faulting had been previously reported and that, in fact, was not considered in Cello et al. (1997).
In summary, a careful analysis of the 1997–1998 earthquake sequence shows that characterizing present-day faulting in the central Apennines and anticipating the main essential parameters of future significant earthquakes is more difficult than previously thought. Although the general trend of tectonic structures and the regional stress field do not appear to have changed much during the Quaternary, seismogenic faulting is clearly taking place on structures that cannot be singled out using the standard fault geomorphology–structural geology approach. Looking for evidence of present-day faulting, and hence for potential seismogenic sources, requires the development of alternative and widely multidisciplinary methods of analysis that take fully into account the lessons learned from Colfiorito.
ACKNOWLEDGMENTS
We wish to thank Prof. E Boschi for the encouragement and the fundamental support in the collaboration with IGM. We are grateful to all the IGM staff for the collection of the data in the field and in particular A. Marchioni for the enthusiastic support in the data analysis. The thoughtful revision and constructive comments of two anonymous reviewers helped to improve this paper.
References
