


Summary
We studied fault scarps along the northern sector of the Celano–L'Aquila fault system in the Abruzzi region (central Apennines). Up to ∼9.5 km long, 3 m high, fault scarp traces mark the slope foot of ridgetop valleys at Mt Ocre range. In order to provide direct evidence of the deformation history of these scarps, we initiated geomorphic, ground-penetrating radar (GPR) and trenching investigations. GPR investigations yielded subsurface stratigraphic features of the scarp zones, and determined the locations for trenching sites. A total of five trenches were excavated at two different sites. Structural and stratigraphic analysis of the trench exposures combined with historical considerations, showed three faulting events between 5620 BC and 1300 AD; the most recent of them occurred after 1690 BC. Each of these events produced an estimated minimum vertical displacement ranging between 0.3 and 0.5 m. Our interpretation is that the Mt Ocre fault branch represents the northernmost surface expression of a single 35 km long seismogenic structure associated with M∼ 7 earthquakes. Any attempt to estimate the seismic hazard in the area must consider the presence of this important source.
1 INTRODUCTION
Several studies over the last few decades describe evidence for Late Pleistocene–Holocene tectonic activity in the area between the cities of Celano and L'Aquila in the Abruzzi Apennines, central Italy (Fig. 1). In this area, along a 35 km long lineament, several north-northwest to northwest trending fault scarps, up to 9.5 km long, were detected and studied by geomorphic and geological analysis (Biasini 1966; Giraudi 1989; Cinti et al. 1992; Salvi 1995; Salvi & Nardi 1995; Pantosti et al. 1996). The main scarps have vertical topographic expression between 1 and 8 m and are arranged in a right-stepping en echelon pattern that is clearly observable in the northern part (Mt Cefalone and Mt Ocre ranges, Fig. 1). The scarps are generally located at the base of steep, SW-facing slopes with crest-to-base distances of a few hundred metres (Figs 1 and 2). The overall scarp setting was interpreted as being due to a single tectonic structure: the ∼35 km long, mainly normal, Celano–L'Aquila Fault System (CAFS, Salvi 1995; Salvi & Nardi 1995), consisting of three main fault branches: the Celano-Ovindoli-Piano di Pezza (COP), the Campo Felice (CF) and the Mt Ocre (MO) scarps (Fig. 1). The lack of continuity and the en-echelon arrangement of the branches probably arise from the re-utilization of pre-existing, favourably oriented structural discontinuities (thrust faults associated with the frontal fold thrust, see Salvi & Nardi 1995) and/or from the presence of a minor left-lateral slip component (Pantosti et al. 1996).
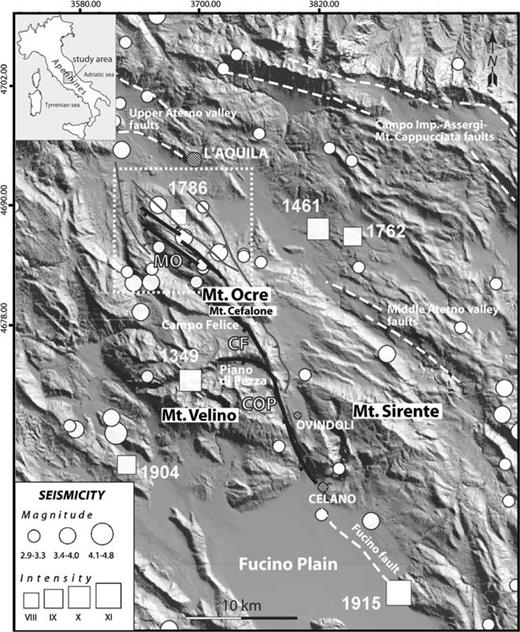
Digital shaded relief map of the Velino-Ocre-Sirente massif in northern Abruzzi showing the three main branches of the Celano–L'Aquila fault system (black solid lines: COP, Celano-Ovindoli-Piano di Pezza; CF, Campo Felice; MO, Mt Ocre). The distribution of historical and instrumental earthquakes (Gruppo di Lavoro CPTI, 1999; INGV seismic catalogue) is also shown. Dashed white lines indicate other active faults in the area (Galadini & Galli 2000), including the 1915 Fucino surface rupture. Small grey lines indicate old thrusts. Dashed white box includes the area in Fig. 2.
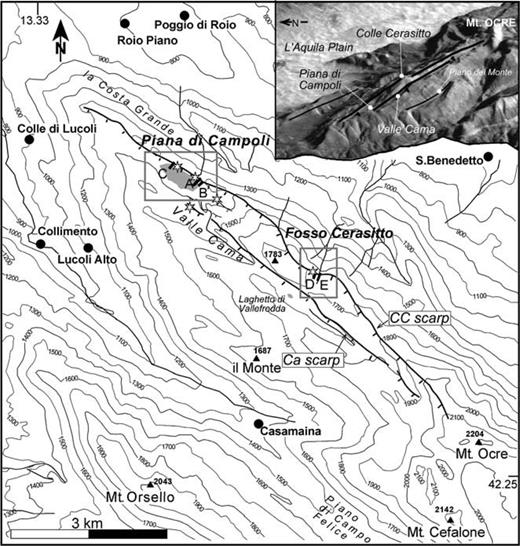
Topographic map of the Mt Ocre area showing the fault scarp traces along the range summit (Cama and Campoli-Cerasitto) and the sites of investigations (grey boxes); altitudes are in metres. The location of the trenches is indicated with black rectangles and the sites of GPR surveys with stars. The inset shows a 3-D image of the area.
This fault system occurs along the main axis of the Apenninic belt. Crustal extension in this area has been active in a NE–SW direction (e.g. Montone et al. 1999) since the Middle Pleistocene, following the ENE retreat of the subducting Adriatic lithosphere due to the Eurasian–African plate collision (Royden et al. 1987).
In the Abruzzi region, the historical occurrence of large earthquakes suggests the presence of important seismogenic faults (Fig. 1), but not all of them have been investigated in detail so far. Although no rates of strain accumulation at the scale of the fault systems are available, GPS estimates of the NE–SW extension rate along the Abruzzi Apennines yield values of 2–3 mm yr−1 (Hunstad et al. 2003).
Recent activity of the Celano–L'Aquila Fault System was first identified by observing morphotectonic landforms such as dammed and headless valleys, scarps in Holocene alluvial fans, and later confirmed by palaeoseismologic data. The latter were only available for the Celano-Ovindoli-Piano di Pezza branch, showing evidence for repeated, mainly normal, faulting with 3 m of maximum slip per event (Pantosti et al. 1996). The Campo Felice branch consists of a clear bedrock scarp at the NE border of the Campo Felice plain, running near the base of the southwestern slope of Mt Cefalone (Fig. 1). Although the stratigraphic analysis of lacustrine deposits in the plain indicates recent tectonic activity of the Campo Felice fault (Giraudi 1998), palaeoseismologic data are difficult to obtain given the absence of favourable trenching sites with recent deposits. New methods for dating surface faulting episodes on bedrock limestone surfaces are presently being tested on this scarp (Giaccio et al. 2002). Further north, the clear morphotectonic landforms that define the Mt Ocre branch (Fig. 1) were studied by Salvi & Nardi (1995). They interpreted the peculiar geomorphologic setting of the Mt Ocre range as the expression of gravitational processes triggered by the repeated seismic activity along the Celano–L'Aquila Fault System. Considering the strong historical seismicity of this part of Italy (Gruppo di Lavoro CPTI 1999, Fig. 1), the characterization of the activity chronology and maximum expected earthquake magnitude for the CAFS has important implications for seismic hazard assessment.
This paper provides new data (geomorphic, palaeoseismologic and ground-penetrating radar; GPR) on the northern termination of the Celano–L'Aquila Fault System, and re-evaluates the interpretation of the Mt Ocre scarps given by Salvi & Nardi (1995). In particular, we concentrate on three alternative hypotheses to explain the Mt Ocre structures: (1) they actually represent the northernmost surface expression of a single 35 km long seismogenic structure (the CAFS) associated to M∼ 7 earthquakes; (2) they represent the expression of an independent ∼10 km long seismogenic fault capable of producing only maximum M∼ 6 earthquakes; (3) they result from gravitational spreading of the ridge occasionally induced by the strong ground shaking produced by large, nearby earthquakes (Salvi & Nardi 1995).
2 THE MT OCRE FAULT BRANCH
The Mt Ocre range has an elliptical-like shape, with a NW major axis (Figs 1 and 2). The range is mostly composed of a well-bedded, NW-striking, NE-dipping monocline of Cretaceous and Miocene limestones (Bosi & Manfredini 1967), the present structural setting of which is the result of NE thrusting over an Upper Miocene turbiditic complex, followed by NW–SE normal faulting since the upper Pliocene (Vezzani & Ghisetti 1998). A peculiar geomorphological feature of the range is the presence of three parallel crests running NW longitudinally for a maximum length of 9.5 km (Figs 1 and 2). They delimit two narrow (maximum width 200 m), ridge-top valleys filled by colluvium and slope debris: the Cama and Campoli-Cerasitto valleys. The latter has an average crest-to-bottom distance of several tens of metres and has no surface outlet, the present drainage being mainly karstic. The base of the NE slope of both valleys is marked by rather continuous, up to 3 m high fault scarps (Figs 2 and 3). The Cama and Campoli-Cerasitto valleys are actually interpreted as narrow, asymmetric tectonic basins resulting from the long-term activity of bordering faults. In the Cama valley the scarp affects the bedrock and is locally marked by a strongly weathered limestone fault plane, whereas the Campoli-Cerasitto scarp cuts across modern slope and colluvial deposits. This setting indicates a younger age for the Campoli-Cerasitto ruptures and provides favourable conditions for trenching, particularly at the Piana di Campoli and Fosso Cerasitto sites (Figs 2 and 3).
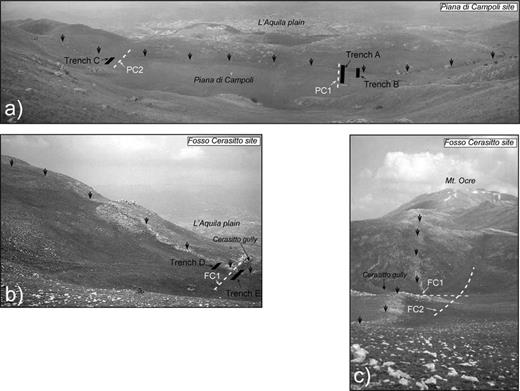
(a) Northeastward view of the fault scarp (black arrows) at Piana di Campoli site; (b) view from southwest and (c) from northwest of the fault scarp (black arrows) at Fosso Cerasitto site. Location of trenches and GPR profiles at both sites is also shown.
The Piana (Italian for plain) di Campoli is a ∼1.5 km long, ∼200 m wide, flat bottom, closed basin located in the northernmost portion of the Campoli-Cerasitto valley (Figs 2 and 3). The NE slope of the plain is bounded by a N50°W, up to 3 m high, southwest-facing scarp that affects slope deposits and alluvium. A few tens of metres up-slope from this scarp and almost parallel to it there is another irregular and strongly weathered scarp running in bedrock. Extensive human modifications of the lower scarp face certainly occurred in the past. Farming in the area ended in the 1950s, but during the previous two centuries this land was cultivated with human and animal labour. The hard work of reclaiming good soil from the debris-covered, barren slopes is testified by the widespread presence of large piles of stones lying around the once ploughed fields (Fig. 3).
The Fosso (Italian for gully) Cerasitto site is located about 4 km southeast from the Piana di Campoli basin along the same scarp (Campoli-Cerasitto) (Fig. 2). This site consists in a small, bowl-shaped, asymmetric basin (Fig. 3), filled by recent alluvial and colluvial sediments. Its northeastern side is bounded by a clear bedrock fault scarp, plunging upslope. Repeated slip along the fault dammed the flow in the Fosso Cerasitto isolating the head of the gully (Fig. 3), and giving rise to the hanging basin. Across the Fosso Cerasitto thalweg the scarp is presently lacking, possibly naturally eroded or removed by past farmers to avoid periodic basin flooding in the wet season.
3 ȀSUBSURFACE INVESTIGATION BY GPR AND TRENCHING
As shown in the previous section geomorphological observations along the Campoli-Cerasitto scarp strongly suggest recent activity of this segment. In order to improve the definition of such activity we carried out subsurface investigations using ground-penetrating radar first, and later cross-fault trenching.
The reason for using GPR was twofold: first, we wanted to confirm our hypothesis on the origin of the scarp, by mapping the scarp continuity at depth, the thickness of the unconsolidated deposits and the shape of any displaced and now buried landforms; secondly, we wanted to select the most favourable sites for opening palaeoseismologic trenches.
3 .1ȀGPR measurements
Ground-penetrating radar is a geophysical technique that uses electromagnetic waves, typically in the frequency range 10–3000 MHz, to detect subsurface structures exploiting the differences in their dielectric properties (in non-magnetic materials). A transmitting antenna sends an electromagnetic pulse which can be reflected and/or scattered by a dielectric discontinuity in the ground, and then be subsequently gathered by a receiving antenna (Daniels 1996). The results of a GPR profile is a two-way time–antennas position image, similar to a reflection seismic section.
A very limited number of GPR applications to palaeoseismologic studies are present in the literature (Gross et al. 2000; Demanet et al. 2001). This is probably due to the difficulty of data interpretation for fault zones, typically arising from many factors: variation of the dielectric properties not necessarily correlated with faulting (i.e. erosion), limited dimension of the sedimentary microfacies created by the faulting, complexity of the structural setting and the presence of volumetric scattering due to coarse scarp talus deposits. However, in some cases the GPR technique can still be considered a powerful tool for the definition of the geometry of sedimentary and tectonic structures and for the detection of shallow faults (Cai et al. 1996; Wyatt & Temples 1996; Wyatt et al. 1996; Liner & Liner 1997).
We conducted GPR surveys, for a total of approximately 1000 linear metres, at several locations across both scarps of the Campoli-Cerasitto and Cama valleys (Fig. 2). The data were collected using a bistatic Pulsekko 100 unit (Sensors & Software Ltd) with the 200, 100 and 50 MHz antennas oriented perpendicular to profile direction (PR–BD mode). Profiles were acquired in step reflection mode using 1.0 and 0.5 m step size for the 50 and 100 MHz antennas, respectively, while 0.5 and 0.2 m were used for the 200 MHz antenna. A trace stacking of 64 and a time window of 800 ns (50 MHz antennas) and 400 ns (100 and 200 MHz antennas) were used. The antenna spacing was 2 m (50 MHz), 1 m (100 MHz) and 0.5 or 1.0 m (200 MHz). Several attempts to record a common mid-point sounding (for the determination of the average wave velocity) have been made at different locations, but none of them resulted in clear information on the pulse velocity. It was, in fact, impossible to detect unambiguous reflections from well-defined dielectric discontinuities. We calculated an average pulse velocity of ∼12 m ns−1 using the shape of the diffraction hyperbolae, but this value is representative only of the limestones. To improve the interpretation of the GPR sections, we calculated approximate depth scale for the sediments using the average literature velocity of 0.07 m ns−1 (Annan 1992). In Figs 4 and 5 we show the GPR sections with topographic corrections, an automatic gain control of 500, a down trace average of 3, the reference time vertical scale and the approximate depth scale for the two main lithologies. For readers not familiar with GPR interpretation, we specify that the two uppermost black bands are due to the signal propagating directly from the transmitting to the receiving antenna. It is also important to notice that the various ‘lines’ visible on each radar section presented in this work and dipping left and right at approximately 45°, are artefacts due to reflection from the edge of the metallic measuring tape used during the survey, as these antennas are not shielded (Sun & Young 1995).
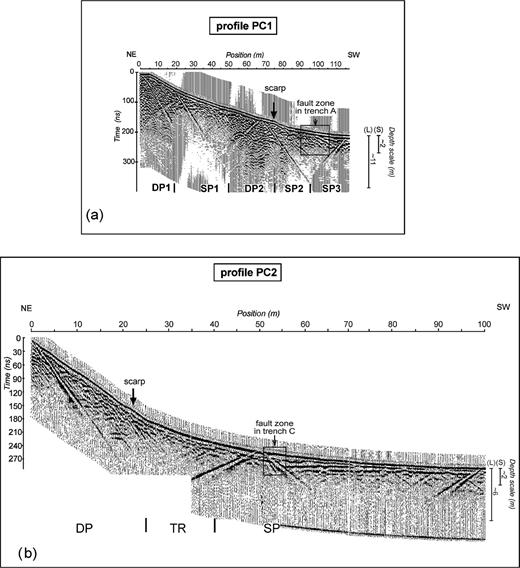
Most representative GPR profiles performed transverse to the scarp at Piana di Campoli (see Fig. 3a for location). (a) PC1 section; (b) PC2 section. Both sections were acquired with a 200 MHz antenna in step reflection mode. The two depth scale bars shown on the right of the section have been calculated for silty sediments (S) and limestone (L) as described in the text. Different radar facies are recognized on the basis of the reflection pattern (DP-SP-TR). The geological interpretation of these zones is discussed in the text.
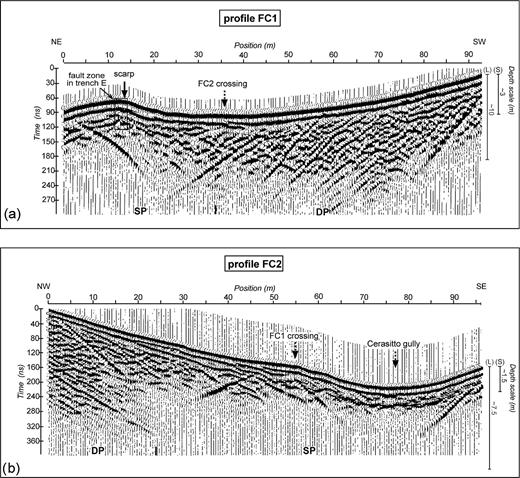
Most representative GPR profiles performed transverse (FC1) and parallel (FC2) to the scarp at Fosso Cerasitto site (see Figs 3b and c for location). (a) FC1 section; (b) FC2 section. Both sections were acquired with a 100 MHz antenna in step reflection mode. The two depth scale bars shown on the right of the section have been calculated for silty sediments (S) and limestone (L) as described in the text. Different radar facies are recognized on the basis of the reflection pattern (DP–SP) and their geological interpretation is discussed in the text.
GPR observations at Piana di Campoli
We carried out several measurements at Piana di Campoli across the main scarp at different locations; we present here two sections for the 200 MHz antennas (PC1 and PC2, Figs 3 and 4).
The results are similar at both sites and show the presence of different radar facies with a peculiar reflection pattern. The radar facies indicated with deep penetration (DP) show crossing reflections and hyperbolic diffractions, while the radar facies indicated with shallower penetration (SP) mainly show layered reflectors, at places overlying sparse hyperbolic diffractions (Fig. 4). Based on surface observations we interpreted the SP zones as areas where the radar waves are absorbed by fine-grained deposits, and therefore as areas with shallower signal penetration. Conversely, the DP facies correspond to NE-dipping limestone outcrops, indicate a deeper penetration of the signal. As a result of the lateral lithological heterogeneity and to the lack of accurate velocity measurements, the depth and the dip of the reflectors are only roughly estimated.
Although the DP2/SP2 interface corresponds at the surface to the scarp (Fig. 4a), section PC1 does not show any direct evidence of a fault here as subsequently confirmed by trenching. Two clear reflectors dipping towards the centre of the basin are visible between 96 and 112 m (Fig. 4a). Such features (SP3) were attributed to well-bedded deposits of medium-grained sediments (∼2 m thick) overlaying finer deposits, which prevent further penetration of the radar signal. As shown in the following, this interpretation was confirmed by trenching, and in fact turned out to be crucial to the actual detection of the fault.
Section PC2 (Fig. 4b) is located about 1 km northwest from section PC1. Here again we note the typical crossing reflection and hyperbolic diffractions due to the bedrock (DP event, 0–25 m). After a short transition zone (TR, 25–40 m) the rest of the section shows a shallower penetration due to the finer plain deposits. An interesting feature is the clear shallow reflector slightly dipping upslope between 53 and 63 m. The reflector is partially masked by the measuring tape artefact, and seems to be truncated at about 53 m, possibly indicating the presence of a fault. Based on this interpretation we selected the central part of the GPR section as the preferred location for trenching.
GPR observations at Fosso Cerasitto
For this site we present two GPR sections: FC1 and FC2, perpendicular and parallel to the scarp, respectively (Figs 3 and 5), both obtained using a 100 MHz antenna.
Along FC1 (Fig. 5a), from about 33 m to the end of the section, we follow an area with high scattering and hyperbolic diffractions; we interpret this radar facies as being due to limestone strata (the bedding strike is perpendicular to the section), overlaid by the coarse rock debris accumulated at the base of the slope. The shallow concave reflector between 74 and 87 m corresponds to a fine-grained colluvium filling the bed of a lateral channel. Another concave reflector is present between 15 and 36 m (Fig. 5a); here the signal attenuation is higher, nevertheless some scattering below the reflector is still visible. We interpreted this feature as a colluvial deposit (∼2 m thick) running along the scarp trace.
Section FC2 is parallel to the fault scarp, i.e. at 90° from FC1 (Fig. 5b). Along this section, we see from the left of the section a deep penetration zone characterized by a lack of hyperbolic diffractions followed by a generally higher attenuation up to the other end of the section (SP). A shallow reflector starting at about 15 m and deepening towards the centre of the basin is clearly visible (Fig. 5b). From 43 to 63 m we see additional reflectors which, further down, evolve into a single, concave reflector in the basin bottom. We interpreted the deep penetration as being due to limestone bedrock, whereas the lack of hyperbolic diffractions might be caused by the geometrical setting of the bedding and the profile direction. The limestone strata dip NE at about 40°, i.e. the radar antennas moved along the strike of bedding, whereas in section FC1 the antennas moved across the strike. The clear continuous reflector starting from 15 m was interpreted as the boundary between the colluvium (thickening downslope) and the underlying bedrock. As the thickness of the finer colluvium deposit increases, so does the attenuation, and the radar signal penetration decreases. The lower concave reflector (from 63 m to the end of the section) indicates a strong change in dielectric properties of the materials. The complete lack of signal below this reflector can only be explained by the presence of a lithologic unit which prevents radar wave penetration (i.e. very fine wet sediments). Using a propagation velocity of 0.07 m ns−1 (typical for silty sediments) we estimate a thickness of about 1.5 m for the colluvium layer.
3 .2ȀTrenching observations
The excavation of fault scarps is a powerful geological technique for investigating the recent activity of faults. The trench walls expose stratigraphy and structures, allowing the reconstruction of the fault history in terms of type, amount and recurrence of movements. The success of trenching is strictly dependent on the site selection; in particular, it is important to know the exact location of the fault scarp and the presence of unconsolidated, datable, recent deposits that could preserve the imprint of past movements along the fault.
For most of its length the scarp system of the Mt Ocre range lies within Upper Jurassic to Lower–Middle Miocene limestones and there are only a few locations where deposits capable of recording information on recent displacements occur. The best sites are at Piana di Campoli and Fosso Cerasitto (see Section 2 for a description, Figs 2 and 3) where, following the results of the GPR investigations, a total of five trenches were excavated. The stratigraphic sequence exposed by the excavations was divided into units (for a description, see the captions of Figs 6 and 7); some units include individual beds from the same sedimentary event and are indicated by a letter following the number. Material for radiocarbon dating, including detrital charcoals, palaeosols and organic fine-grained deposits, was collected in the trenches, providing age constraints for the stratigraphy and for the history of deformation. Table 1 lists the samples and their radiocarbon ages from conventional and accelerator mass spectrometer techniques available for the stratigraphic sequences. In the following text we report the 2σ range of the calibrated 14C ages (Stuiver et al. 1998) adjusted to the nearest decade.
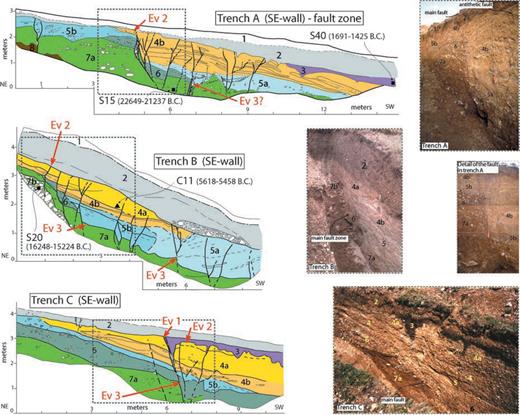
Simplified logs of trenches A, B and C at the Piana di Campoli. Red arrows point at the horizons for the events of deformation. Location of the samples for radiocarbon dating with the calibrated age is indicated (black rectangles for conventional technique and black triangles for accelerator mass spectrometer, see also Table 1). A set of photographs shows the fault zones in the trenches (dashed grey rectangle in the logs). Legend: 1, modern soil; 2, reworked deposit; 3, silt-rich dark organic palaeosol; 4a, yellowish clayey-gravel; 4b, open-work coarse and tannish clayey-silty fine gravels; 5a, poorly cemented gravels in brownish silt; 5b, fine brown sandy silty gravel (trench A), lens of greenish silty gravel (trench B), dark brown clayey-sandy conglomerate (trench C); 6, pebbly layers in dark brown silt; 7a, reddish silty-sand palaeosol; 7b, calcareous blocks in dark massive palaeosol; 8, micrite limestone.
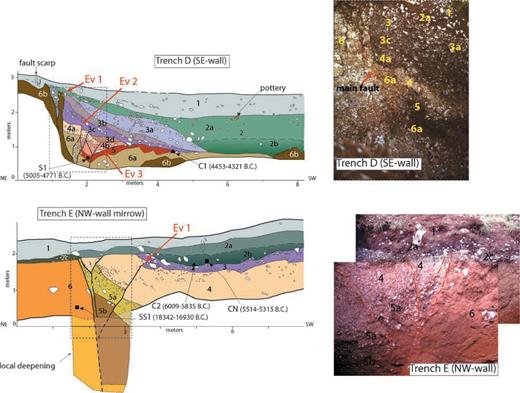
Simplified logs of trenches D and E at the Fosso Cerasitto. Red arrows point at the horizons for the events. Location of the samples for radiocarbon dating with the calibrated age is indicated (black rectangles for conventional technique and black triangles for accelerator mass spectrometer, see also Table 1). Detail of the fault zone in the trenches is shown on photographs. Note that photo of trench E shows the local deepening zone. Trench D: 1, reworked soil; 2a, dark brown silty clay; 2b, black silty clay rich in charcoal; 3a, clear silt with chaotic pebbles; 3b, conglomerate in silty clay; 3c, gravel in poor brown clayey silt; 3d, gravel in poor brownish matrix; 4a, gravel in reddish sandy silt; 4b, poor matrix coarse gravel; 5, dark brown silty palaeosol; 6a, weathered limestone; 6b, massive limestone. Trench E: units 1, 2a and 2b same as trench D; 2c, brown organic sand; 3, brown silty clay; 4, fine gravel in tan sandy-silt; 5a, light brown gravel in clayey sand; 5b, massive brown sandy clay; 6, reddish massive clayey silt.

Trenching at Piana di Campoli
Based on detailed geomorphic and field observations we found Piana di Campoli to be a favourable site for palaeoseismological study. The GPR profiles executed in the area indicate the presence of stratified sediments in lateral contact with massive slope deposits or limestone. These contacts were considered good candidates for a possible fault location. Three trenches were dug across the scarp (Fig. 3): trenches A (N50°E oriented) and B (N60°E oriented) about 100 m apart in the southern portion of the plain, and trench C (N30°E oriented) close to its northern end.
The trenches display similar stratigraphy; it consists of alternating coarse alluvial and mainly fine colluvial deposits and palaeosols (units 3–7), which overlie bedrock (unit 8) (Fig. 6). The bedrock of the area is NE-dipping, micrite limestone, which is strongly weathered and fractured. The upper portion of the exposure in all the trenches is clearly incomplete and truncated by the basal surface of an agricultural layer (unit 2). In fact, the farming of the plain produced about 1 m thick reworked material that caps the underlying units with a sharp, erosional contact for the entire length of excavations (Fig. 6).
Normal faults dissect the sequence below the reworked layer in the three trenches, resulting in a general lowering of the Campoli plain bottom to the SW (Fig. 6). As a consequence of the surface modification induced by repeated ploughing of the scarp base, the fault zones in trenches A and C do not correspond to the surface scarp, which appears to have retreated several metres. Detailed analyses of the exposures outline three events of deformation at this site (Fig. 6). The intensely sheared bedrock suggests long-term slip along the fault zone. Evidence for events 2 and 3 was found in all trenches. In trenches A and B evidence for event 2 is provided by a series of high-angle synthetic and antithetic normal faults (average orientation: N50°–60°W) diffused in a 8 m wide fault zone that deforms the sequence up to unit 4 (Fig. 6). Additional evidence is at 1 m in trench A, where the limestone (unit 8) and the younger units (up to 5b) are displaced by the same amount by a subvertical fault. The fault traces and the stratigraphy are truncated by the erosion so that the horizon for the occurrence of this deformation cannot be estimated (possible event 2 and/or 1). Similarly to trenches A and B, main and antithetic high-angle normal faults are exposed in trench C in a 2 m wide fault zone (Fig. 6). In this trench event 2 deformed the sequence up to the base of unit 3 (Fig. 6). The base of this unit (or the top of unit 4) can be considered the exposed surface when this event occurred even if, as unit 4 is eroded and partially incomplete in the sequence, the horizon is probably higher in the missing portion of the stratigraphy. Based on measurements on unit 4b, a minimum of 0.3–0.5 m of vertical separation is estimated across the main fault zone (trenches B and C). In addition to individual displacements, the deformation is also expressed by a broad warping of the lenses and layers of unit 4b in trench A.
Samples from units 4a (C11) and 3 (S40), which pre- and post-date event 2, respectively, constrain this event between 5620 and 1420 BC (Table 1); based on the location of the horizon discussed above, the upper part of this range is more probable.
Increasing displacements with depth (in trench B and C) and a faulted wedge-shaped sediment (unit 6 in trenches A and B) provide evidence for a previous sudden event of deformation (event 3), for which the horizon is the top of unit 7a (Fig. 6). Removing the deformation produced by younger events in trenches B and C, where the event 3 horizon is clear, unit 7a remains displaced by about 0.5 m. Dating from unit 7 (sample S20 and S15), that pre-dates event 3, constrains the lower interval for the occurrence of this event to about 20 000 yr ago, while its closest upper boundary is constrained by unit 4a (sample C11) to be older than 5460 BC (Table 1). Considering the location of this sample relative to the event 3 horizon (Fig. 6), the preferred age is closer to the lower interval. The erosional contact between unit 6 and 5 and the different environment of sedimentation recorded at the passage from unit 5 to 4, suggest that the stratigraphic sequence is probably incomplete, justifying the ∼14 000 yr long time interval between samples S15 (unit 7) and C11 (unit 4). This may prevent the recognition of further individual events of dislocation occurring within this time interval. However, we cannot exclude the possibility that a possible mixing of older organic material from the overlaying channel deposits affected the palaeosol 7, so that samples S20 and S15 from this unit give an apparent very old maximum age for event 3.
Unit 3 is the youngest preserved deposit exposed in the three excavations and formed on top of eroded unit 4. Only in trench C is this unit intersected by the fault zone. The sharp contact between units 3 and 4a in correspondence with the main fault in trench C suggests the occurrence of a younger event (event 1) after the development of unit 3 (Fig. 6). Dating from this unit (sample S40) indicates that this event should be younger than 1690 BC (Table 1). Another small pit (∼1.5 m deep and 3 m wide) excavated at about 100 m, and parallel to trench C, confirms the presence of the fault at the same position. Here, the subvertical fault affects unit 3 and the underlying units with a throw of about 25 cm. This evidence supports the interpretation of the occurrence of event 1 after the formation of unit 3 (<1690 BC).
Trenching at Fosso Cerasitto
At this site, the geomorphic setting and the GPR data suggested the presence of favourable deposits and two trenches (trench D and E, Figs 2 and 3) were dug across the scarp. In the Cerasitto basin recent deposition occurred mainly at the base of the scarp and in the upthrown side only the bedrock outcrops. Trench D (N40°E oriented) was located 10 m northwest of the Cerasitto gully, where the back-dipping bedrock scarp is ∼1 m high and post-event deposition at the base of the scarp or secondary structures could be present. Trench E (N25°E oriented) was opened in correspondence with the dammed thalweg, with the possibility of finding faulted deposits on both sides of the fault. The stratigraphic sequence exposed in the trenches is composed by alluvial and colluvial deposits (Fig. 7). The upper part of the sequence could be correlated between the trenches (units 3, 2 and 1), whereas the older units belong to different local sedimentary conditions. Stratigraphic and structural analysis of the sequences provided evidence for three faulting events at this site.
Trench D shows strongly weathered limestone (unit 6a) in sharp tectonic contact with colluvial deposits and palaeosols. The deformation zone is located below the surface scarp and is formed by a main high-angle and two secondary normal faults and by an antithetic fault (Fig. 7). Most of the faults activated during multiple events and their movement resulted in a lowering of the units towards the SW. Classical colluvial wedges are not well developed in this trench because of the upslope facing of the scarp (Fig. 3), which minimized the transport of material from the footwall and favoured erosion along the hangingwall. The same geomorphic setting caused the lack of correlative units across the main fault zone (1.5 m), preventing the recognition of individual events at this location. However, based on the displacement of the bedrock (unit 6b) a minimum cumulative slip of about 2 m can be estimated. Two individual events of deformation can be recognized across the secondary faults (events 2 and 3) (Fig. 7). Based on the following considerations, we set the occurrence of event 3 at the top of palaeosol 5. This unit is deformed and sharply truncated by the faults between 1.6 and 2 m. We may reasonably assume the presence of unit 5 in the upthrown side of this fault and the following erosion from unit 4. Unit 4b is a channel located at the base of the scarp, representing a post-event deposit. Based on these considerations, a minimum vertical throw of 0.6 m is estimated for unit 5. This displacement is larger with respect to that of the younger units. The decreasing displacement and the presence of upper terminating faults are evidence for event 2 intersecting the sequence up to unit 4. The top of this unit is the event horizon for event 2; considering that this unit is eroded, the event could be higher in the stratigraphy. Based on the vertical throw of unit 4a along the secondary faults, a minimum vertical slip per event of 0.3 m can be estimated for event 2.
The presence of chaotic gravels and conglomerates (unit 3) in sharp vertical contact with unit 6b along the main fault may be evidence of a youngest event (event 1), which is better constrained in trench E.
Based on the ages of unit 5 (samples S1 and C1), which pre-dates the three events, and the presumed age of the uppermost undisturbed deposit (unit 2a, see later in the text), the events occurred within the time interval 5000 BC–1700 AD (Table 1). Given the location of the event horizon with respect to that of the samples event 3 probably occurred shortly after 5000 BC while event 1 occurred close to the upper time boundary.
Trench E exposes colluvial and alluvial deposits deformed by a main high-angle normal fault (2 m) faced by secondary antithetic and reverse faults (Fig. 7). As in trench D, the lack of correlation between the units on both sides of the main fault prevents a clear reconstruction of the sequence of events. A local deepening of the excavation in correspondence with the main fault exposed unit 6 in the downthrown side at about 4 m below the surface (Fig. 7). Multiple events of deformation produced this minimum ∼3.5 m vertical separation of unit 6 over the last 18 ka (sample SS1). The only individual event was recognized along the reverse fault (Fig. 7). This fault terminates upward within unit 3, suggesting that event 1 occurred during the unit deposition. Units 2 and 3 can be confidently correlated across the two trenches, so that the most recent event suspected in trench D and recognized in trench E is the same. Despite the stratigraphic correspondence, we note that the ages of samples C2 and CN from unit 2b are out of the chronological sequence established in trench D (Table 1 and Fig. 7). Since unit 2 is a colluvial palaeosol we attribute this discrepancy to a probable inclusion of older organic material and to the reworking of the charcoal sample. For this reason, we prefer to discard the ages of samples C2 and CN and constrain the age of unit 2 according to the following considerations. Based on local accounts the inception of agricultural work at these high elevations can be placed between the end of the 18th century and the second half of the 19th century. This is probably the oldest age for unit 1. The presence of the pottery fragments of possible medieval age immediately below the base of this agricultural layer suggests a youngest age for unit 2a in the range 1400 ± 300 AD.
3 .2.1ȀCross-site correlations
Structural and stratigraphic relationships at both Piana di Campoli and Fosso Cerasitto trench sites show the occurrence of at least four individual events of faulting. At Piana di Campoli, event 3 is younger than 20 ka, event 2 occurred between 5620 and 1425 BC and event 1 occurred after 1690 BC. At Fosso Cerasitto, we recognized three events falling in the range 5000 BC–1700 AD. Event 3 probably occurred shortly after 5000 BC, event 2 within the range and event 1 close to the upper time boundary. Unfortunately, differences in the sedimentary microenvironments, the truncation of the upper part of the sequences, and uncertainties on the available ages prevent a clear correlation of the events between the two sites. Nevertheless, the convergence of some age intervals and a rough stratigraphic comparison would suggest that event 1 and 2 at the Piana di Campoli site correspond to events 2 and 3 at the Fosso Cerasitto site, respectively. If this is correct the oldest event at Piana di Campoli (event 3) was not individually recognized at Fosso Cerasitto, whereas the evidence for the youngest event (event 1 at Fosso Cerasitto) was not preserved at Piana di Campoli.
Based on this correlation we may assess that the main result from the trenching along the Mt Ocre fault scarps is the recognition of three sudden events of displacement occurring within the interval 5620 BC–1700 AD, and at least of an older one before 5620 BC but later than 20 ka ago. The most recent faulting event would be constrained between 1690 BC and 1700 AD, with the youngest part of the interval being preferred. In the historical seismic catalogues (Gruppo di Lavoro CPTI 1999, Fig. 1), there are no traces of disasterous events in this region (Fig. 1). As pointed out by D'Addezio et al. (1995) a large event after the 14th century in the Abruzzi region would be recorded in historical memory. Based on this consideration we suggest the 14th century as the youngest possible age for the most recent event along the Campoli-Cerasitto fault.
Considering the large uncertainties on event occurrences, and using the historical information as a further constraint, we provide the range of variability of the fault parameters (Table 2). The time elapsed since the most recent event is within the wide interval 3700–700 yr, with the lower part of the range being more probable. Considering the three youngest events we infer a maximum average recurrence interval of ∼3500 yr. The minimum vertical slip per event ranges between 0.3 and 0.5 m. A minimum long-term vertical slip-rate of 0.19 mm yr−1 is calculated from the cumulative displacement of unit 6 (3.5 m) in trench E recorded over about 18 000 yr. We also note that the varying thickness of the deposits across the faults and the secondary reverse faults observed in the trenches, as well as the pattern of the scarp traces, suggest a minor component of horizontal slip.
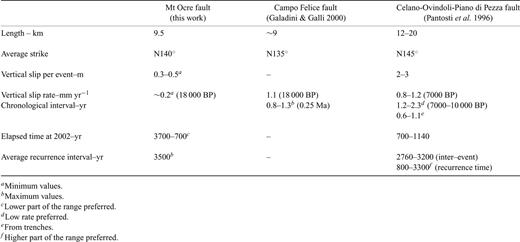
Summary of the available fault parameters for the Celano-L'Aquila fault system.
4 DISCUSSION AND CONCLUSION
Ground-penetrating radar investigations and palaeoseismologic trenching provide the first direct constraints on the deformation history of the Mt Ocre fault branch along the Celano–L'Aquila Fault System. The comparison between GPR profile interpretations and the trench exposures allows us to define the strengths and limits of this geophysical technique in active tectonics research. This work is the first attempt to combine GPR and palaeoseismological techniques in Italy.
Using our measurement methodology, we found that with the exception of one case (PC2 in Fig. 4) the GPR images did not show unambiguous evidence of the tectonic discontinuities at depth. We attribute this to the limited resolution of the surveys. In the shallower part of the fault zone the discontinuities, although sharp, are of submetric extent (for the Mt Ocre normal faults) and would need very high resolution to be detected (i.e. a higher antenna frequency with respect to that used in this work). At larger depths, following the downward increase of cumulative displacement, it is expected that the scale of the lithological (and dielectric) contrasts across the fault increases. However, in our case, the strong attenuation of the GPR signal by very fine and wet sediments do not allow one to reach such depths.
We must also stress that our findings are mainly valid for areas with low tectonic rates and sedimentary environments similar to the Ocre range. Larger slip per event and slip rates, and higher variability of sedimentary conditions may improve the capability of GPR to detect fault zones.
In our work we found the GPR technique to be successful in supplying general stratigraphic information (presence, extent and geometry of limestones, sediments and their main contacts). Such information was used to guide the selection of the best trenching sites (trenches A and B for the Piana di Campoli site and trench E for the Campoli-Cerasitto site), contributing to the success of the palaeoseismologic investigations.
For palaeoseismologists who would like to combine GPR exploration of fault zones with other more direct investigation techniques we remark that: (1) because fine and/or wet deposits cause low penetration, the GPR survey should be performed during the dry season; (2) due to the presence of even a thin layer of clay, the GPR signal can be strongly attenuated (Gueguen & Palciauskas 1994). In this case, the use of a lower-frequency antenna and a higher-voltage transmitter may increase the signal penetration, but it would decrease the vertical resolution, making the detection of thin layers impossible; (3) strong dielectric contrasts between the footwall and the hangingwall are required for the imaging of clear fault surfaces by GPR; (4) depths in the GPR section should be constrained by measurements of radar wave velocity (common mid-point), which in turn cannot always be performed.
The trenching was successful in finding the fault zones at depth. However, the stratigraphic and age correlations between the different trenches were difficult because of the variability of local sedimentary/erosional processes along the fault scarp. The timing of the observed faulting events can only be broadly constrained, but we find a reasonable correlation with the timing of palaeoearthquakes recognized along the Celano-Ovindoli-Piano di Pezza scarps (Fig. 1). Along these fault scarps, Pantosti et al. (1996) found two events between 1900 BC and 1300 AD (the latter date being constrained by the same historical considerations), as we find in the Mt Ocre trenches (1690 BC–1300 AD). Also the third event has a compatible age: 5000–3030 BC for Celano-Ovindoli-Piano di Pezza branch, with respect to 5620–1690 BC (lower range preferred) for Mt Ocre branch.
If we then consider the geomorphic expression of the long-term activity of the single branches of the Celano–L'Aquila Fault System (MO, CF and COP in Fig. 1), we note some remarkable differences. For Campo Felice and Celano-Ovindoli-Piano di Pezza geological and geomorphological studies (Bosi 1975; Salvi & Nardi 1995) indicate that a good part of the limestone ranges which form the footwall of the faults (Fig. 1) represent the expression of a few hundred thousand years of the fault activity (with an average topographic throw of 500 m). In the Mt Ocre branch the active fault scarp (the Campoli-Cerasitto scarp) is not at the interface between the range and a basin, but is running at high elevations along the range crest. The topographic throw of the Campoli-Cerasitto fault is never larger than 40 m, and even considering the parallel Valle Cama fault (presumably inactive) the cumulated topographic throw for the Mt Ocre branch (Campoli-Cerasitto and Cama) is only about 150 m. Trenching observations also show different values of vertical slip per event: 2–3 m for the Celano-Ovindoli-Piano di Pezza fault (Pantosti et al. 1996), against 0.3–0.5 for the Campoli-Cerasitto fault. Assuming that the present geomorphological setting is entirely produced by these faults, the Mt Ocre and Celano-Ovindoli-Piano di Pezza branches show a similar behaviour in both short- and long-term activity, which may indicate a common displacement history. Using the slip per event determined for the Celano-Ovindoli-Piano di Pezza fault by Pantosti et al. (1996), empirical scale laws (Wells & Coppersmith 1994) suggest probable rupture lengths of 30–35 km for the causative fault. Such an extent is therefore in agreement with the simultaneous rupture of the three branches (COP, CF and MO).
The sole correlation of surface ruptures of Celano-Ovindoli-Piano di Pezza and Mt Ocre does not necessarily exclude the possibility of a gravitational origin for the scarps in the Mt Ocre range (our working hypothesis (3), see the introduction), since sackung-type displacements are in general related to seismic triggering (Radbruck-Hall et al. 1976; Mahr 1977). Indeed, some clear gravitational landforms exist in the Mt Ocre range: Piano del Monte, minor upslope scarps on W and E flanks (see the inset in Fig. 2).
Nevertheless, most of the evidence presented so far support our hypothesis (1), i.e. the three branches represent the cumulated expression of simultaneous surface ruptures occurred along the 35 km long Celano–L'Aquila fault system. In Table 2, we summarize the available fault parameters for its three branches.
The location and extent of rupture on all the active fault segments in a given area is instrumental in the accurate assessment of seismic hazard. Our new data on the Celano–L'Aquila Fault System will give additional constraints to such evaluation for central Italy.
ACKNOWLEDGMENTS
We are grateful to P.A. Annan of Sensors & Software Inc, Canada, for lending us the Pulsekko GPR system for this research. Thanks also go to R. Basili for field contribution and to A. Borgia, L. Cucci, S. Stramondo, S.E. Beaubien for discussion and helpful suggestions. Special thanks to E. Masana and M. Unsworth for the thoughtful and constructive comments that helped to improve the paper. This work has been funded by ASI (contracts no ARS 99–19 and I/R/138/00) and by the Istituto Nazionale di Geofisica e Vulcanologia.
References
Author notes
*Uncertain calibration.
