


Summary
The finite difference method is used to calculate the magma dynamics, seismic radiation, and crustal deformation associated with a volcanic eruption. The model geometry consists of a cylindrical reservoir and narrow cylindrical conduit embedded in a homogeneous crust. We consider two models of eruption. In the first model, a lid caps the vent and the magma is overpressurized prior to the eruption. The eruption is triggered by the instantaneous removal of the lid, at which point the exit pressure becomes equal to the atmospheric pressure. In the second model, a plug at the reservoir outlet allows pressurization of only the magmatic fluid in the reservoir before the eruption. Magma transfer between the reservoir and conduit is triggered by the instantaneous removal of the plug, and the eruption occurs when the pressure at the conduit orifice exceeds the material strength of the lid capping the vent. In both models, magma dynamics are expressed by the equations of mass and momentum conservation in a compressible fluid, in which fluid expansion associated with depressurization is accounted for by a constitutive law relating pressure and density. Crustal motions are calculated from the equations of elastodynamics. The fluid and solid are dynamically coupled by applying the continuity of wall velocities and normal stresses across the conduit and reservoir boundaries. Free slip is allowed at the fluid—solid boundary. Both models predict the gradual depletion of the magma reservoir, which causes crustal deformation observed as a long-duration dilatational signal. Superimposed on this very-long-period (VLP) signal generated by mass transport are long-period (LP) oscillations of the magma reservoir and conduit excited by the acoustic resonance of the reservoir—conduit system during the eruption. The volume of the reservoir, vent size, and magma properties control the duration of VLP waves and dominant periods of LP oscillations. The second model predicts that when the magmatic fluid reaches the vent, a high-pressure pulse occurs at this location in accordance with the basic theory of compressible fluid dynamics. This abrupt pressure increase just beneath the vent is consistent with observed seismograms in which pulse-like Rayleigh waves excited by a shallow source are dominant. The strength of the lid plays an important role in the character of the seismograms and in defining the type of eruption observed.
Introduction
Seismic and geodetic measurements around active volcanoes are very useful for a quantitative evaluation of volcanic activity. Recent seismic and geodetic data recorded on dense networks of stations have shed light on the force system associated with volcanic eruptions. For example, Kanamori (1984) analysed explosion earthquakes associated with eruptions of Mount St Helens and showed that these earthquakes were excited by a downward-oriented vertical single force. They interpreted the source mechanism of the single force as a counter force associated with the sudden removal of a lid capping a pressurized fluid-filled cavity located at shallow depth beneath the volcano. Uhira & Takeo (1994) used a moment-tensor inversion technique to analyse seismic signals associated with vulcanian explosions at Sakurajima Volcano, Japan. They showed that volcanic explosions at Sakurajima are accompanied by the contraction of a magma chamber at a depth of a few kilometers. Nishimura (1998) considered the deflation process of a magma chamber connected to the surface by a narrow conduit as a seismic source of explosion earthquakes, and obtained a mathematical description of the observed relation between seismic magnitude and vent radius. These studies strongly suggest that an explosive volcanic eruption macroscopically can be represented by the deflation process of a reservoir system beneath a volcano.
Seismic observations made close to volcanoes provide further details of the spatio-temporal properties of these explosive sources. Based on analyses of seismic data and video pictures obtained at Sakurajima Volcano, Japan, Ishihara (1990) demonstrated that an explosive eruption is preceded a few seconds before by an initial break at a depth of about 2 km beneath the summit crater. Using moment-tensor inversions, Tameguri (2002) suggested that large-amplitude surface waves are generated from the top of the conduit simultaneously with an explosion at the vent.
Long-period (LP) signals in the form of eruption tremor are often observed at many volcanoes during a sustained eruption. Using spectral analyses, Nishimura (1995) showed that eruption tremor observed during the 1989 eruption of Mount Tokachi, Japan, has a source mechanism similar to that of explosion earthquakes. McNutt (1994) summarized the characteristics of eruption tremor observed around the world and showed that the reduced displacement (Aki & Koyanagi 1981) of eruption tremor, which is an indication of the power of the tremor source, is proportional to the Volcanic Explosion Index (VEI), which is related to the amount of erupted materials. Although many source models have been proposed to explain the narrow spectral peaks of LP seismicity (Crosson & Bame 1985; Chouet 1985, 1986, 1988, 1992, 1996; Chouet 1994; Ferrick 1982; Fujita 1995; Kumagai & Chouet 1999, 2000, 2001; Mikada 1992), few source models treat the eruption tremor.
Geodetic measurements made close to a volcano also yield information on mass transport processes beneath a volcano. From an analysis of high-sensitivity tilt and strainmeter records obtained in a vault located 2.7 km from the crater of Sakurajima, Ishihara (1990) found that an inflation of the volcano precedes each explosive eruption by a few hours. The tilt and strainmeter data also show a deflation of the volcano after each eruption. Similar deformation signals associated with volcanic explosions were detected by a strainmeter during the 1988–1989 activity of Mount Tokachi (Miyamachi 1990), and by a tiltmeter located 1.5 km from the active vent of Mount Etna, Italy (Bonaccorso & Davis 1999). Broad-band seismometers deployed near the active vent of Aso Volcano, Japan, recorded the inflation and deflation phases associated with small phreatic eruptions (Kaneshima 1996). Broad-band recordings illustrating inflation and deflation phases accompanying eruptions of Stromboli Volcano, Italy, were obtained by Chouet (1999, 2003). Similar broad-band measurements were shown to accompany vulcanian explosions at Popocatepetl Volcano, Mexico (Arciniega-Ceballos 1999). Although the mechanisms of inflation phases detected by geodetic and seismic measurements may not necessarily originate in the same physical process, these observations show that most volcanic eruptions are associated with an initial inflation phase, followed by a deflation process accompanying the eruption of volcanic materials from the vent.
Several source models have been proposed to explain these characteristics of observed seismic and geodetic signals. In most models the magmatic fluid is simplified to an incompressible liquid or perfect gas, and small pressure fluctuations are assumed to make the mathematical treatment of the fluid dynamics and elastodynamics more tractable. In the case of an eruption, however, it is necessary to take into account the pressure dependence of magma properties as magma migrates toward the surface because the dominant period of seismic waves excited by a pressure transient in a volcanic conduit is strongly affected by the depth dependence of magma properties (Neuberg 2000). The discharge of magma is another critical parameter describing eruptive activity. Several constitutive relationships between fluid pressure and fluid density accounting for the vesiculation process of gases in liquid magma have been proposed to quantitatively evaluate flow motions in a volcanic conduit (Wilson 1980; Ida 1990; Bower & Woods 1997). These studies generally focus on the dynamics of magma motion only, and do not target the seismic radiation and crustal deformation, which represent the most informative data about underground magma dynamics. The purpose of the present study is to fill this gap in our knowledge. We use numerical simulations to simultaneously estimate the dynamics of magma flow in the conduit and reservoir, and associated crustal deformation and seismic radiation during a volcanic eruption. Using the coupled equations of fluid dynamics and elastodynamics, we examine the basic characteristics of magma motions and associated elastic displacement field in the surrounding solid.
Mathematical Formulation of a Volcanic Eruption
We assume the simplified volcanic system illustrated in Fig. 1 to examine the magma motion and seismic wave radiation associated with an eruption. The conduit—reservoir system consists of a magma reservoir connected to the surface by a narrow vertical conduit. The reservoir has a cylindrical shape with radius rv and length ℓv, and the conduit consists of an axially symmetric pipe with radius rc and length ℓc. Before an eruption, a lid representing a lava dome or solidified volcanic plug covers the conduit orifice.
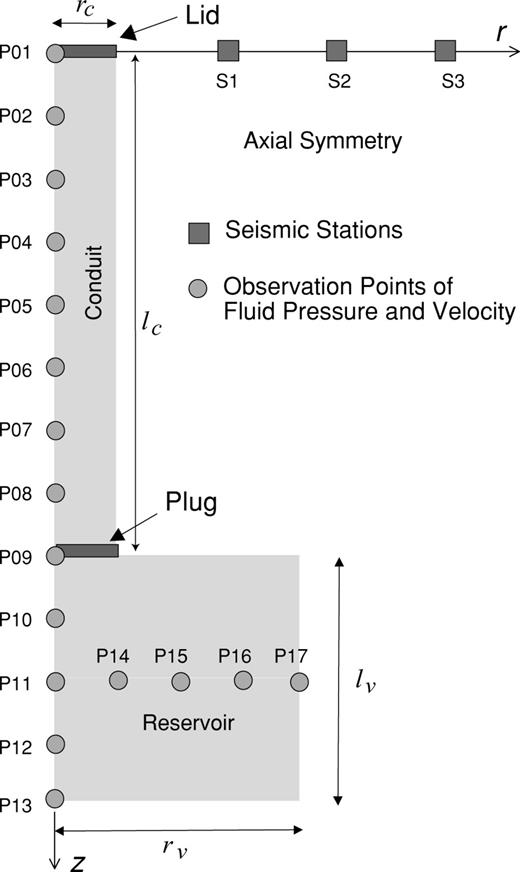
Configuration of the conduit—reservoir system and observation points used in the simulation.
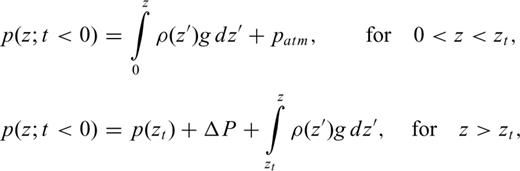
We examine two models of eruption. Our first model (hereafter named Model I) is based on the simple model proposed by Kanamori (1984) and Nishimura (1998). In this model, the reservoir and conduit are both simultaneously pressurized by the addition of new magma to the system, and the fluid is further gravitationally pressurized by its own weight. Accordingly, the volcanic crust surrounding the reservoir—conduit system is stressed by the pressure exerted by the magma in the conduit and reservoir, resulting in an inflation of the crust in the vicinity of the conduit and reservoir. An eruption is triggered by the instantaneous removal of the lid capping the conduit orifice. Magma migrates upward in response to the pressure gradient established between the reservoir and atmosphere, and crustal deformation and seismic wave radiation are generated by the migration of magmatic fluid and associated deflation of the reservoir. We calculate the motions of the fluid and surrounding medium by using the basic equations of compressible fluid dynamics and elastodynamics.
In our second model (hereafter named Model II), we assume a plug at the reservoir outlet. The fluid in the conduit and reservoir is gravitationally pressurized by its own weight. Before an eruption, new magma is supplied to the reservoir only, leading to additional pressurization of the reservoir because of the presence of the plug, which restricts magma transfer from the reservoir to the conduit. Magma motions in the reservoir—conduit system, and associated crustal deformation, are triggered by the instantaneous removal of the plug. Magma migrates upward in response to the pressure gradient between the reservoir and conduit. As the pressure wave triggered by the plug removal reaches the conduit orifice, a high-pressure pulse is generated at this location. This pressure pulse exceeds the material strength of the lid, causing the instantaneous rupture of the lid and triggering an eruption. The upward migration of magma is then controlled by the pressure gradient established between the reservoir and atmosphere. Motions of the fluid and surrounding medium are calculated in the same manner as in Model I.
Calculation of Magma Motion
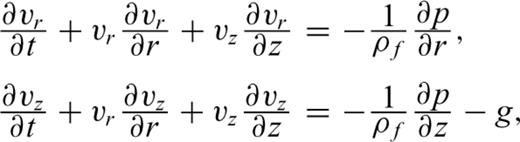

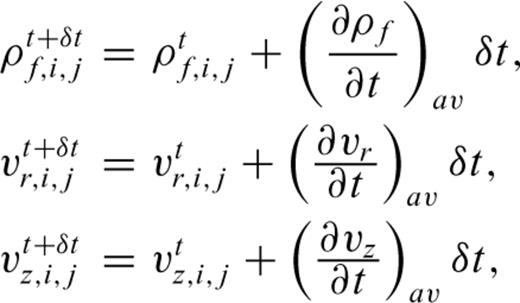
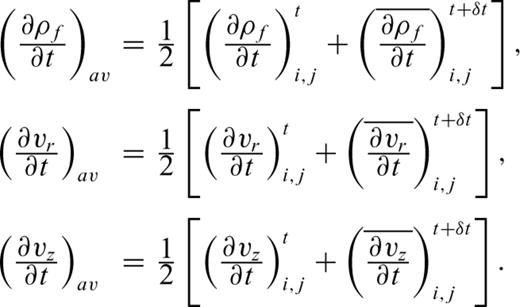
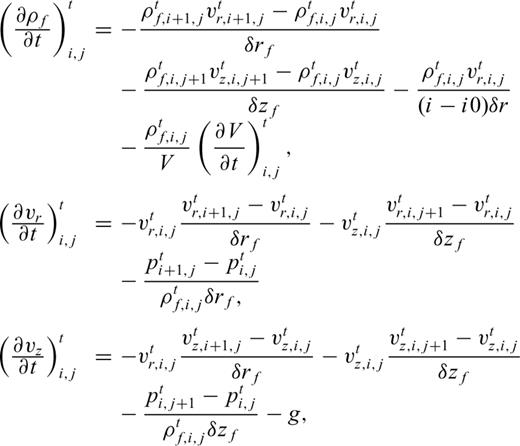
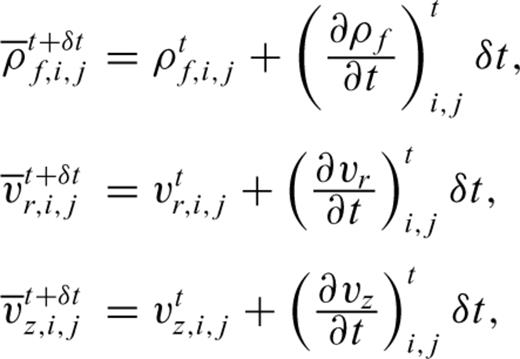
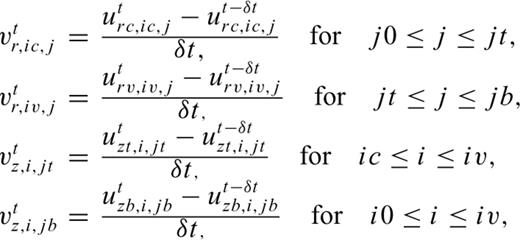
We solve eqs (1)–(3) by the finite difference method of MacCormack (e.g. Anderson 1995) to obtain the spatio-temporal variations of pressure and velocities in the magmatic fluid.
Calculation of Crustal Deformation and Seismic Wave Radiation
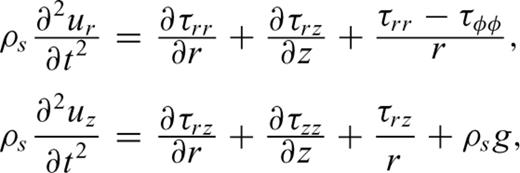
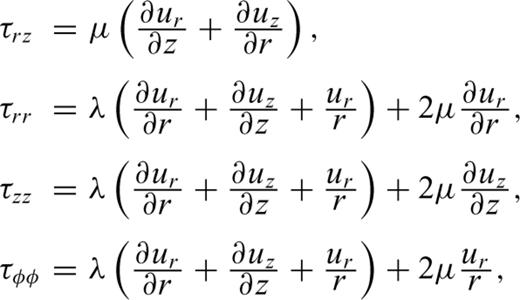
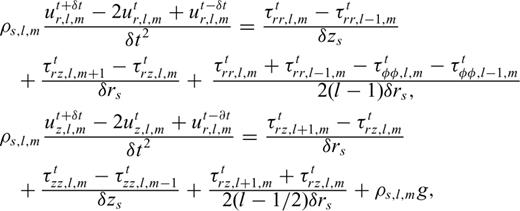
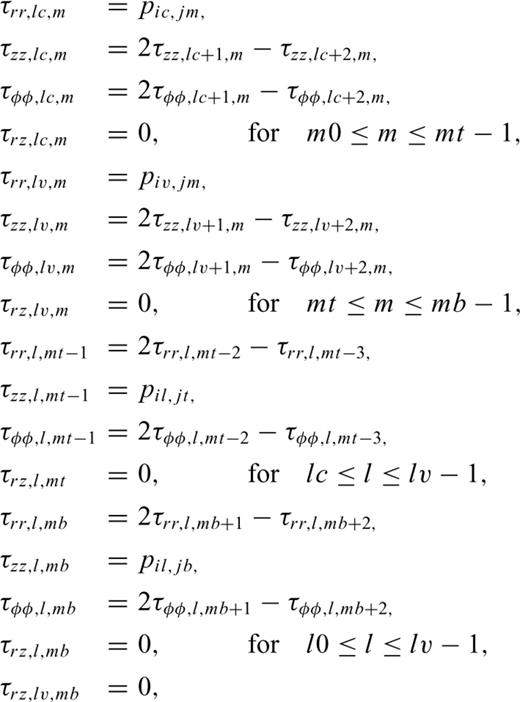
We evaluate eqs (4) and (5) by extending the second-order staggered finite difference scheme of Ohminato & Chouet (1997) to the axially symmetric configuration of our model. The method of Ohminato & Chouet (1997) has the advantage that the topographic configuration and inhomogeneity of the elastic structure can easily be implemented in the model. For the time being, however, we limit our consideration to a homogeneous half space with flat free surface in order to examine the basic characteristics of crustal deformation and seismic wave propagation associated with magma motions.
Boundary and Initial Conditions
The magmatic fluid forces the walls of the conduit and reservoir either inward or outward, and no vacuum is allowed at the boundary between the fluid and crust at all times. Hence, the stresses normal to the conduit and reservoir walls are always balanced with the magmatic pressure, and the radial velocity of the magmatic fluid at the wall is set equal to the radial velocity of the wall. The radial velocity of the elastic wall is obtained by time derivating the calculated radial displacement of the wall. We assume a free slip condition at the conduit and reservoir walls in accordance with our assumption that the magma is an inviscid fluid.
In Model I, an eruption is triggered at t= 0 by setting the magma pressure at the conduit orifice equal to the atmospheric pressure. In Model II, fluid motion is triggered at t= 0 by removing the plug to allow the magma transfer between the reservoir and conduit. In both models, we calculate the spatio-temporal dependences of pressure and velocities in the fluid, and displacements and stresses in the solid as follows: (1) using eqs (1) to (3), fluid motions in the conduit and reservoir are estimated at time t=δt from the fluid motions at t= 0; (2) elastic motions are calculated at t=δt from the elastic motions at t= 0 and fluid pressure at the conduit and reservoir walls at t= 0; and (3) magma motions are calculated at t= 2δt using the boundary conditions for velocities at the walls and magma motions in the conduit and reservoir at t=δt. Steps (2)–(3) are repeated through successive time steps until the end of the simulation. In Model I, the pressure at the conduit orifice remains fixed at the atmospheric pressure during the eruption. In Model II, an eruption starts when the lid cannot sustain the fluid pressure in the conduit. This condition occurs when the pressure at the top of the conduit exceeds the lid strength. In our calculations, spurious pressure ripples leading to unrealistically large estimates of pressure, can occur at the top of the conduit when a strong shock with step-like onset impinges this boundary (see Appendix B for details). The peak amplitude of the ripples can exceed the mean amplitude of the reflected shock wave by about 50 per cent at the lid so that the lid strength tends to be overestimated in our calculations. However, this overestimation does not affect the solid motions as discussed in more detail in Appendix B. At the start of the eruption, the magma pressure at the conduit orifice is set equal to the atmospheric pressure as in Model I. In both models, we apply a sine function to gradually decrease the pressure to atmospheric pressure over an interval of 0.12 s in order to prevent numerical instabilities associated with an abrupt change of pressure at the conduit orifice.


We assume a constant δt in both the solid and fluid and select δdf=δds/nf so that the constant cf=nfcsa/α (nf≥ 1), where nf represents the ratio of grid sizes. This procedure is similar to that used by Chouet (1986) in calculations of the response of a fluid-filled crack to a step in pressure.
The computational domain has dimensions of 5000 m in the z-direction and 2500 m in the r-direction. We set nf= 4 in our calculations and use a grid of 12.5 × 12.5 m in the solid, and 3.125 × 3.125 m in the fluid. The grid interval of 12.5 m in the solid is sufficiently small compared to the wavelengths of seismic waves targeted by our model (e.g. the wavelength is 400 m for a shear wave at the frequency of 5 Hz). While a much finer grid may be required in the fluid to accurately portray the sharp pressure transient expected to occur at the eruption onset, the 3.125 m grid is small enough to adequately interpret the fluid motions in our simulations. Our numerical tests indicate that nf= 4 is an optimum value for simultaneous calculations of the fluid and solid motions, and that using nf≥ 8 induces high-frequency noise in the elastic response of the solid as a result of abrupt stress variations occurring within the space of a few grids in the solid. Using smaller grids in both the fluid and solid would allow the resolution of sharp onsets in pressure and high-frequency elastic motions, albeit at the expense of more extensive computations.
As the spatial grid interval in the fluid is smaller than that used in the solid, radial velocities and normal stresses in the solid at the fluid—solid boundary are interpolated with cubic spline functions to obtain the radial velocities and pressure in the fluid at this boundary.
As defined, our problem has axial symmetry (see Fig. 1), and radial velocities in the fluid and radial displacements in the solid always vanish on the vertical axis of symmetry r= 0. Accordingly, the solution reduces to that of calculating the wavefields in the quarter space r≥ 0 and z≥ 0. The absorbing boundary conditions of Clayton & Engquist (1977) are used to set up the radiation conditions at the edge of the domain in the r−direction, and stress-free conditions are applied at the free surface z= 0.
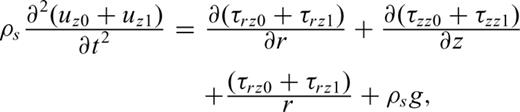
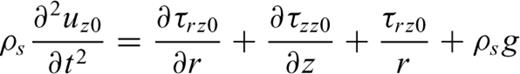
In our approach, the gravitational body force in eq. (4) is only used to calculate the static deformation field due to this force, and this term is removed from the equation when calculating the dynamic field associated with the pressurization and eruption phases so as to avoid spurious high-frequency numerical noise associated with this term. Thus, we only calculate the displacements uz1 relative to the static solution obtained for uz0, and apply radiation conditions at the bottom boundary of the computational domain. Unlike our treatment of the elastodynamics equations, the gravitational acceleration term in eq. (1) describing the fluid dynamics remains present throughout the various phases of calculations. As a result, this term pulls down the fluid—solid system, thereby causing a mismatch in the total net force balance. To verify that this mismatch does not cause unacceptable errors, we computed solutions in which the gravitational force remains present in both the solid and fluid throughout the calculations. To prevent the gravitational force from pulling down all of the solid in these calculations, the vertical displacement uz0 was set to zero at the bottom boundary of the computational domain. The base of the computational domain was set sufficiently far from the base of the reservoir to prevent any bias in the calculated deformation field associated with this bottom boundary condition. Once the crustal deformation due to the gravitational force had converged to an acceptable level of accuracy, we pressurized the reservoir—conduit system and started the magma motion by removing the lid or plug. Except for the presence of significant components of high-frequency numerical noise, the simulated waveforms were found to be quite similar to those obtained when the gravitational body force is removed from eq. (4) during the pressurization and eruption phases. This consistency between the two types of solutions is expected because the mass of the fluid is negligibly small compared to the mass of the solid body. Therefore, the gravitational term in eq. (4) can safely be neglected when computing the dynamic elastic motions resulting from the pressurization and eruption phases.
Simulation Results
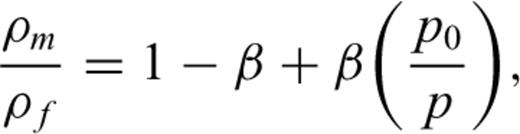
We assume the density of the liquid magma (2500 kg m−3), density of the solid (2700 kg m−3), depth at which vesiculation starts (zm= 5000 m), and P- and S-wave velocities in the solid (3460 and 2000 m s−1, respectively). We examine eruptions from the same shallow magma conduit—reservoir system (rc= 50 m, rv= 200 m, ℓc= 400 m, ℓv= 200 m) for both Models. We further simulate eruptions for Model II with an extended pipe (rc= 50 m, rv= 50 m, ℓc= 400 m, ℓv= 200 m) to examine the importance of the lid strength at the conduit orifice on the fluid and elastic motions.
The reservoir assumed in our simulation is quite shallow compared to reservoir depths of a few kilometers typically assumed for volcanoes. The simulation of a deeper system, however, would require extensive computations because of the larger spatial extent of the computational domain required for these calculations. Furthermore, processes associated with the opening and collapse phases of the volcanic conduit would need to be accounted for in a deep conduit system as the conduit is subjected to a high overburden pressure in such a system. To avoid lengthy calculations associated with deeper systems, the present study focuses on shallow conduit—reservoir systems.
Results for Model I
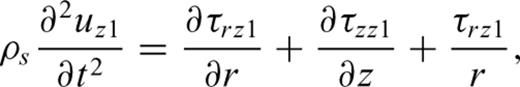
We first investigate the general characteristics of magma motion, crustal deformation, and seismic radiation based on simulation results obtained for Model I. Fig. 2 shows snapshots of the pressure field in the magma. Prior to the eruption, the magma in the conduit and reservoir is overburdened by its own weight and by the lid weight, so that the magma pressure increases with depth. When the eruption starts at t= 0, the magma in the reservoir starts to move upward in response to the pressure gradient established between the reservoir and atmosphere. As shown in the snapshots from t= 0 to t= 9 s, a rarefaction wave propagates downward in the conduit. The propagation speed of the rarefaction wave is about 180 m s−1, which is slightly higher than the fastest acoustic velocity in the magma (165 m s−1).
Snapshots of the pressure field in the magma conduit and reservoir in Model I.
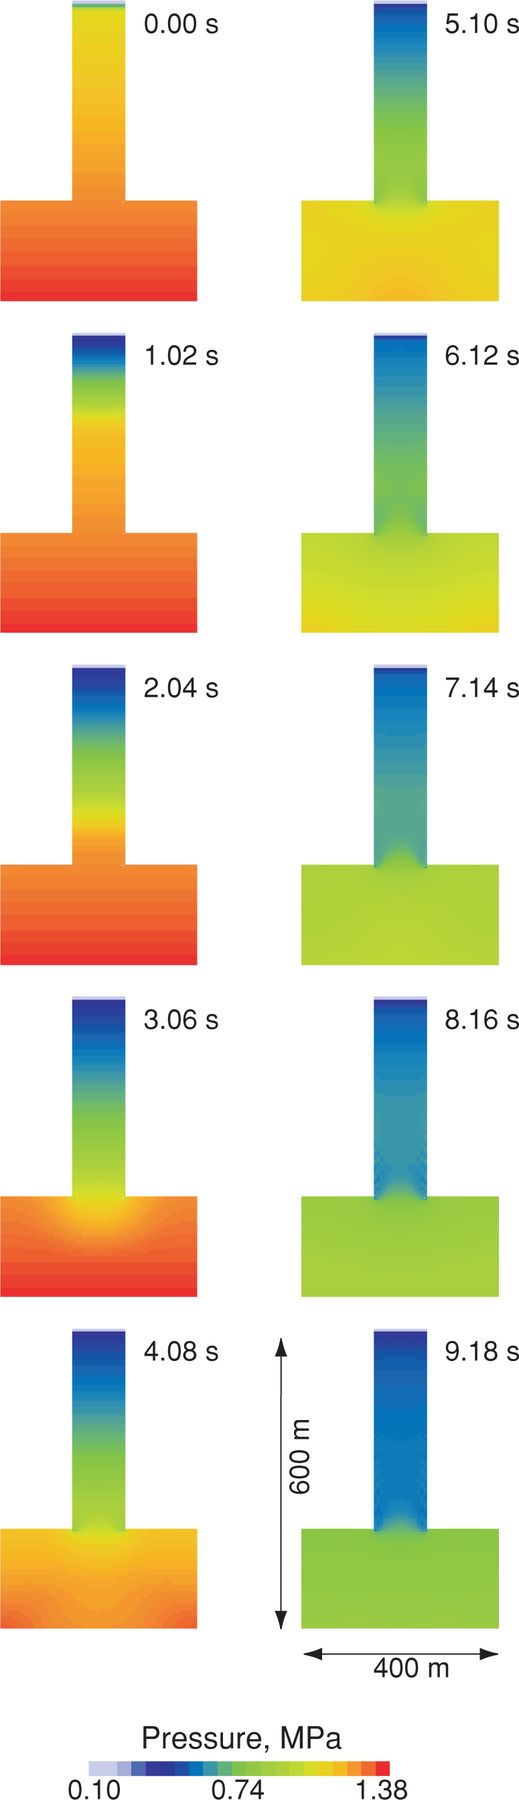
The pressure in the reservoir gradually decreases with time, as indicated by the change in colour in the reservoir from red, to yellow, to light green. For a more detailed examination of small fluctuations in magma pressure, we show in Fig. 3 the spatial variations of the time derivative of pressure, ∂p/∂t, in the reservoir. As seen in the snapshots from t= 3.7 to t= 7 s, a region with high ∂p/∂t repeatedly appears at the bottom circular edge and near the center of the magma reservoir, with a dominant period of about 2.5 s. As the reservoir height and radius are both 200 m, and the acoustic wave velocity of the magma at the reservoir depth is about 165 m s−1, this long-period oscillation is interpreted as an acoustic oscillation of the magmatic fluid in the reservoir.
Snapshots of the spatial variations of the time derivative of pressure, ∂p/∂t, in the magma reservoir in Model I.
Fig. 4 shows the temporal variations of pressure, p(t), and time derivative of pressure, ∂p/∂t, at several locations in the conduit and reservoir. Fig. 4(a) clearly shows that the magma conduit and reservoir deflate almost exponentially for up to 30 s or longer. The time constant of deflation is fixed by the ratio of the cross-sectional area of the vent to reservoir volume. A large vent area and small reservoir volume result in a rapid deflation, while a small vent area and large reservoir volume result in a slow deflation. Gradually decaying oscillations with dominant periods near 2.5 s and shorter-period overtones are observed in the plots of ∂p/∂t (Fig. 4b) as the magma pressure in the reservoir decreases over the 40 s interval. Although the dominant oscillation period is close to 2.5 s, slight variations in periodicities are noticeable at different locations. These variations reflect the complex configuration of the conduit—reservoir system, as well as pressure dependence of the acoustic speed in the magmatic fluid. The fluid velocities (not shown here) display similar decaying LP oscillations. These results indicate that the magma gradually migrates upward in response to the pressure difference between the magma reservoir and atmosphere, and that LP oscillations caused by acoustic resonance of the reservoir are superimposed on the pressure decay associated with mass transport.
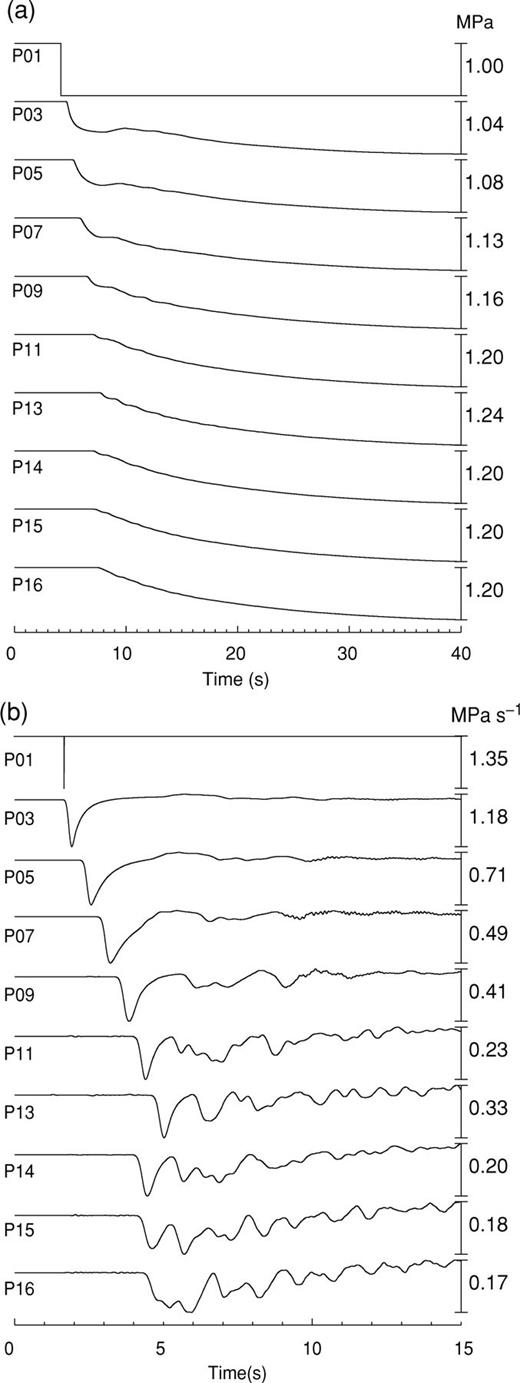
Temporal variations of (a) p(t) and (b) ∂p(t)/∂t at several observation points in the conduit and reservoir system in Model I. See Fig. 1 for locations of observation points. Small-amplitude high-frequency oscillations observed near the ends of the signals at P03, P05, P07, and P09 are numerical artefacts caused by the sharp corner between the conduit and reservoir. The starting times in (a) and (b) are arbitrary.
Fig. 5 shows snapshots of the radial displacement field radiated in the solid during the eruption. Deflation of the conduit propagates downward from the top of the conduit to the reservoir. Measurements of the group velocity of the waves indicate that the group velocity decreases from the P-wave velocity (3460 m s−1) to about 100 m s−1 as the frequency decreases. These dispersion features are the result of the dynamic coupling between the fluid and solid as theoretically predicted by Biot (1952) for a fluid-filled pipe. Similar dispersion characteristics were obtained by Chouet (1986) for a fluid-filled crack.
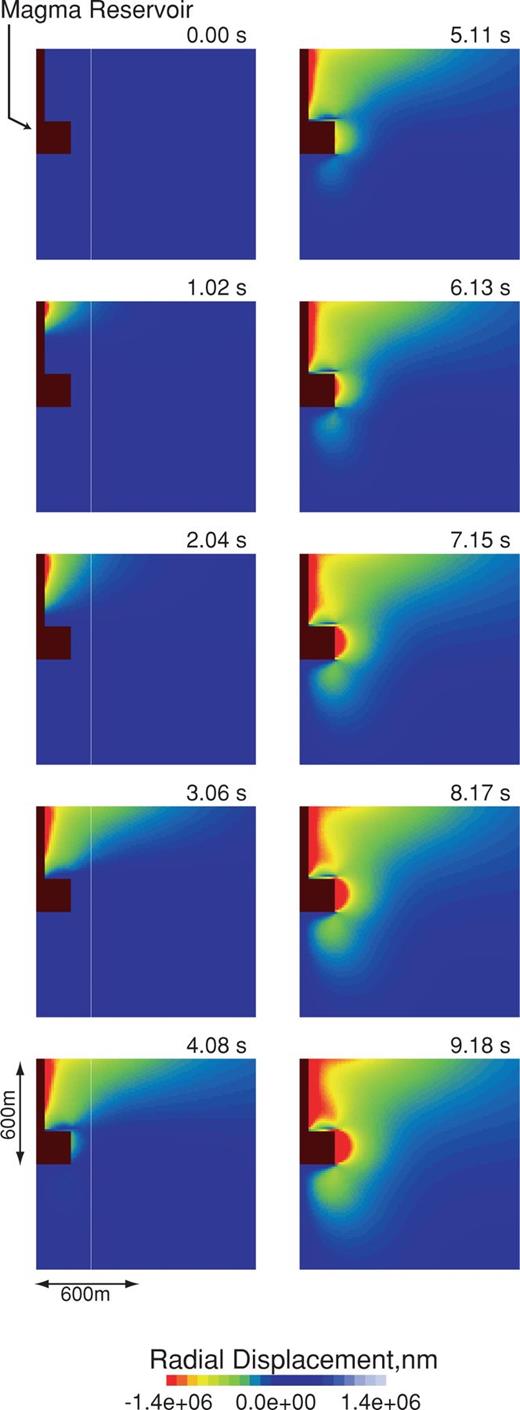
Snapshots of the radial displacement field (in units of 10−9 m) in the solid in Model I.
Deflation motions are identified in the vertical and radial displacements of the ground surface recorded in the near field of the conduit—reservoir system (Fig. 6). These slow displacements (VLP components) result from the gradual deflation of the magma reservoir. Oscillations with a period of about 2.5 s are observed superimposed on the VLP components of displacements due to deflation. As distances from the vent increase, LP oscillations become more evident (for example, compare the synthetics obtained at distances of 100 and 1000 m). The period of 2.5 s is nearly equal to the resonance period of the reservoir and the main axes of the particle orbits at the free surface point toward the reservoir, indicating that these LP signals result from acoustic resonance in the magma reservoir.
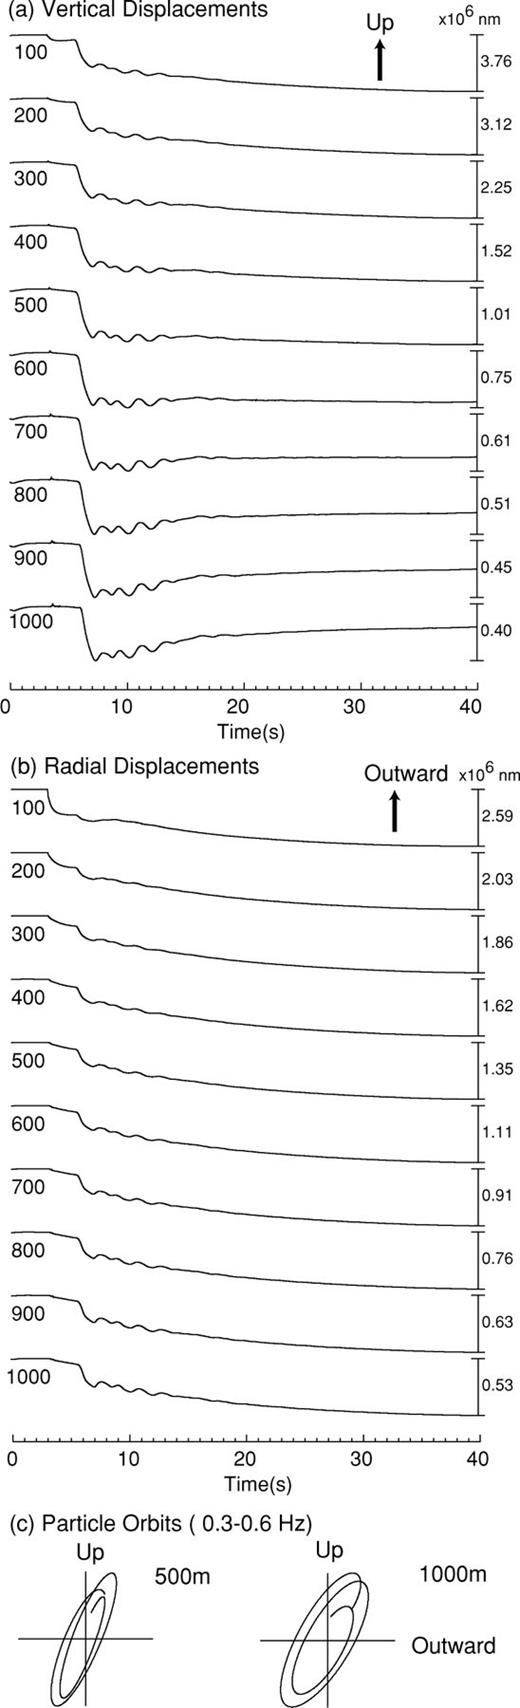
Vertical (a) and radial (b) displacements at the free surface (in units of 10−9 m) at various distances from the conduit axis in Model I. Numbers at the left of each trace represent epicentral distances from the conduit axis (in units of m). (c) Particle orbits obtained from bandpass filtered (0.3–0.6 Hz) seismograms at epicentral distances of 500 and 1000 m. The time windows within which the particle orbits are obtained have a duration of 4 s and start about 3 s after the removal of the lid.
Fig. 7 compares the amplitude spectra of the vertical component of velocity obtained at an epicentral distance r= 500 m for β= 0.5 and β= 1.0. The dominant frequency obtained for a magma characterized by β= 0.5 (basalt) is slightly lower than that obtained for a magma characterized by β= 1.0 (dacite). Note also the frequency shifts and differences in excitations in the subdominant spectral peaks associated with the two types of magma. Similar changes in the spectral peaks are observed when the depth at which vesiculation starts is varied. Since the acoustic velocity of the magma  varies with β and zm (see eq. 3), the resonant period of the reservoir is strongly affected by the properties of the magma. Simulations in which only the initial excess pressure, ΔP, is changed, show that the displacements and velocities are linearly proportional to the initial excess pressure in the reservoir.
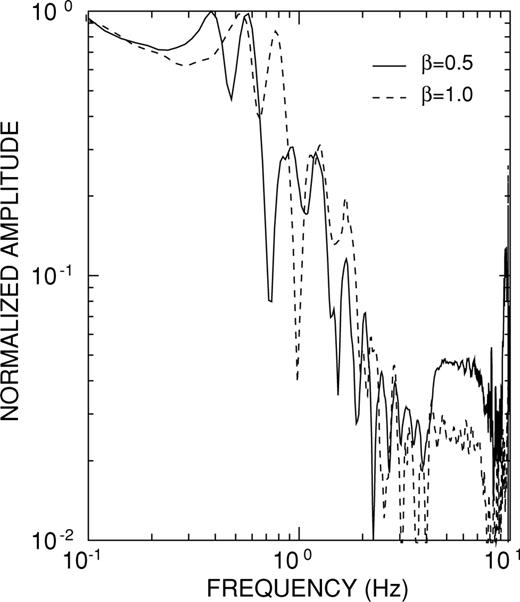
Comparison between amplitude spectra obtained for different magma properties expressed by different factors β. The spectra are obtained at an epicentral distance of 500 m from the conduit axis.
Results for Model II
We simulate the fluid and elastic motions for ΔP= 1 MPa and σlid= 2 MPa. Fig. 8 shows snapshots of the pressure field in the conduit—reservoir system, and Fig. 9 illustrates the spatio-temporal evolution of fluid pressure in the conduit and reservoir during the initial pressurization and after the reservoir plug is removed. Notice the compression shock propagating upward and rarefaction shock propagating downward in the snapshots from t= 0.26 to t= 1.28 s in Fig. 8. The propagation speed of the rarefaction shock (170 m s−1) is slower than that of the upgoing compression shock (280 m s−1). The wave front of the compression shock is a step-like signal with amplitude of about 0.3 MPa. These characteristics of upgoing and downgoing shocks are fully consistent with observations of unsteady wave motions in shock tube experiments, and with numerical simulations of shock waves in a conduit (Morrissey & Chouet 1997). Oblique shock waves, generated at the orifice of the reservoir, are reflected several times in the conduit (see snapshots from 1.28 to 2.30 s in Fig. 8). Small fluctuations, visible for a few seconds behind the step-like signals in Fig. 9(b), are caused by the superposition of oblique shock reflections and pressure oscillations in the conduit—reservoir system. When the shock wave reaches the top of the conduit, it causes a sudden build-up of pressure at this location. This surge of pressure is the result of the compressibility of the fluid and is discussed in detail in the following section. When the pressure at the bottom surface of the lid exceeds the lid strength, the lid is removed and the eruption starts, at which point the pressure at the orifice is set equal to the atmospheric pressure (see pressure trace at P01 in Fig. 9(b); see also Appendix B for details concerning the implementation of this condition). The pressure wave reflected from the conduit orifice then propagates downward into the reservoir (see t > 1.8 s in Figs 8 and 9b). While the high-pressure waves travelling in the conduit are dominant in this model, small-scale pressure fluctuations associated with the resonance of the reservoir are also observed as in Model I.
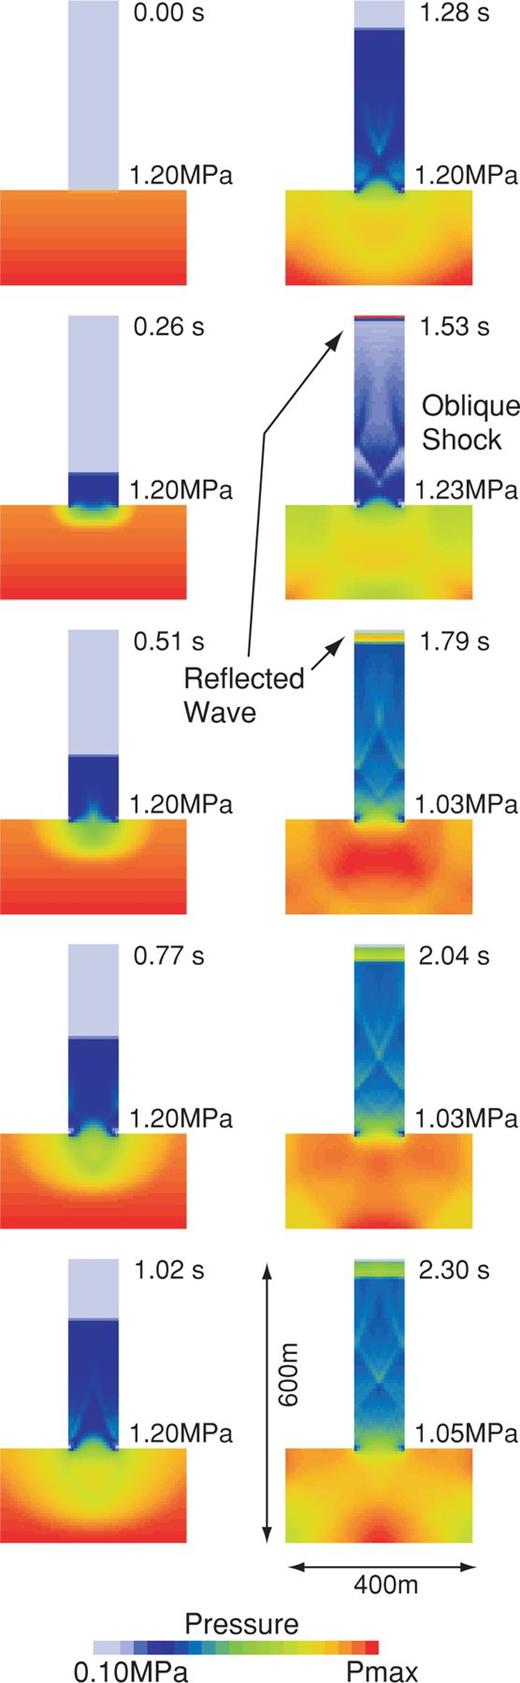
Snapshots of the pressure field in the conduit—reservoir system in Model II. Notice the oblique shock waves visible in the conduit above the reservoir for t > 1.4 s. The pressure in each snapshot is normalized by the maximum pressure, Pmax, (red colour) indicated at the right of the reservoir plug.
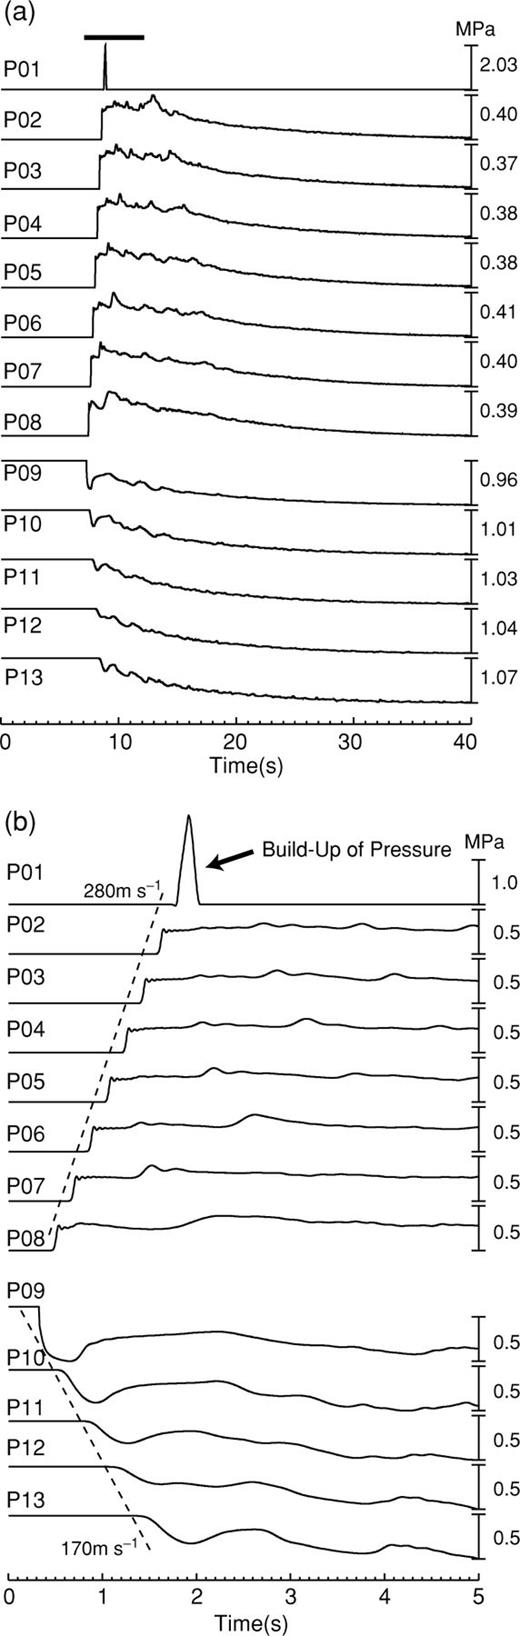
Temporal variations of p(t) at several observation points (P01-P13) in the conduit and reservoir system in Model II during the first 40 s of the pressurization and eruption process (a), and during the initial 5 s of this process (b). The black strip at the top of (a) identifies the enlarged section of record shown in (b). The dashed lines in (b) mark the propagations of the compression and rarefaction shocks in the conduit and reservoir.
Fig. 10 shows snapshots of the vertical and radial displacement fields in the solid. A large VLP deflation motion of the ground surface starts with the initiation of magma motion and resulting contraction of the reservoir. Superimposed on this VLP motion are oscillatory motions with periods near 2.5 s due to the acoustic resonance of the reservoir. A pulse-like signal is also observed in the ground response to the eruption in this model. This signal is radiated by the sudden build-up of pressure at the vent resulting from the impact of the high-pressure fluid upon the lid capping the conduit orifice. This pulse is not observed in the seismograms obtained in Model I.
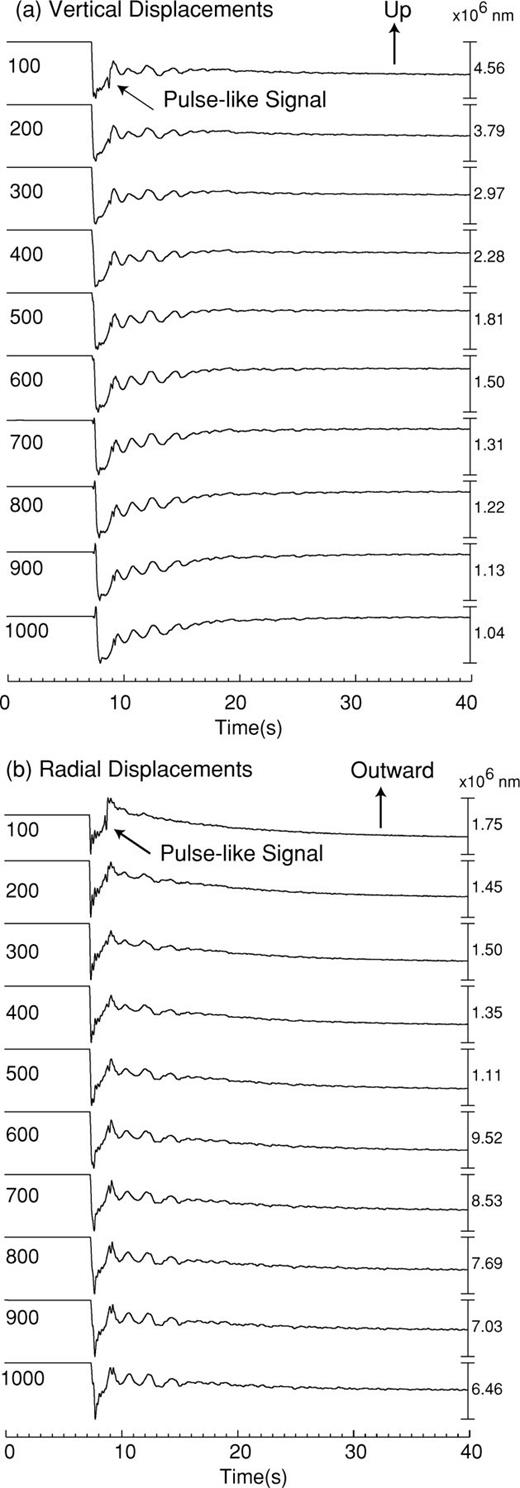
(a) Vertical and (b) radial displacements (in units of 10−9 m) at the free surface in Model II. Numbers at the left of each trace represent epicentral distances from the conduit axis (in units of m). The initial phase is excited by the removal of the plug at the reservoir outlet, and the following LP signals result from the acoustic resonance of the reservoir. The pulse-like signals are Rayleigh waves excited by the high-pressure build-up at the vent.
The pulse-like signal excited by the pressure build-up at the vent is conspicuous in eruptions from an extended vertical pipe (rc= 50 m, rv= 50 m, ℓc= 400 m, ℓv= 200 m, ΔP= 1 MPa). Fig. 11 shows snapshots of the fluid pressure in the pipe and radial velocities in the solid during the interval t= 1.07 − 2.09 s. As illustrated in the snapshots at t= 1.58 s, a pulse-like signal is excited at the conduit orifice by the build-up of pressure in the volcanic pipe. This signal is radiated in the solid. Fig. 12(a) compares vertical and radial displacements at an epicentral distance r= 500 m for different material strengths of the lid, σlid, ranging between 1 and 0.2 MPa. The pulse-like signals are clearly observed for σlid= 1 MPa, however the amplitude of this signal becomes smaller as the strength of the lid decreases. This means that the seismograms contain information about the boundary condition at the conduit orifice, and that the material strength of the lid can be estimated from the amplitude of the pulse-like signal. The particle orbits for the pulse display retrograde elliptical motions characteristic of a Rayleigh wave (Fig. 13). Note that the overall characteristics of the waveforms in Fig. 12 are distinct from those seen in Fig. 10. These results indicate that the seismic waves are markedly affected by the system of forces resulting from the conduit—reservoir configuration considered.
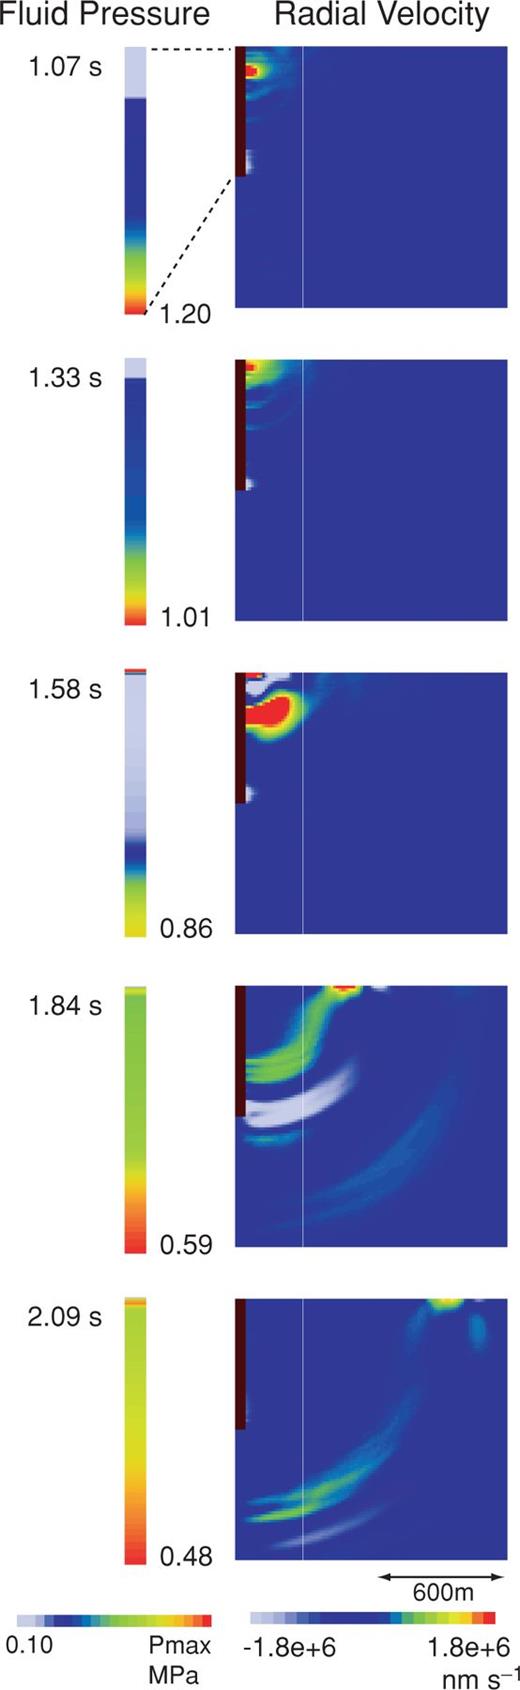
Snapshots of fluid pressure in the volcanic pipe (left) and radial velocity field (in units of 10−9 m s−1) in the solid (right) during the interval t= 1.07 − 2.09 s in Model II. The maximum fluid pressure in each snapshot is indicated at the bottom right of the volcanic pipe.

Effect of lid strength σlid. (a) Vertical and radial displacements (in units of 10−9 m) at an epicentral distance of 500 m. (b) Vertical fluid velocity at the vent. An extended pipe with radius of 50 m and length of 600 m is assumed in this calculation (rc= 50 m, rv= 50 m, ℓc= 400 m, ℓv= 200 m). The leftmost dashed line in (a) marks the onset of inflation of the magma reservoir (the reservoir is the segment of pipe ℓc < z < ℓc+ℓv), the dashed line immediately to the right marks the end of the inflation phase, and the rightmost dashed line marks the time of plug removal and start of magma motion in the pipe. Note that the inflation of the reservoir at the base of the pipe causes a deflation of the ground surface at an epicentral distance of 500 m (e.g. Bonaccorso & Davis 1999).
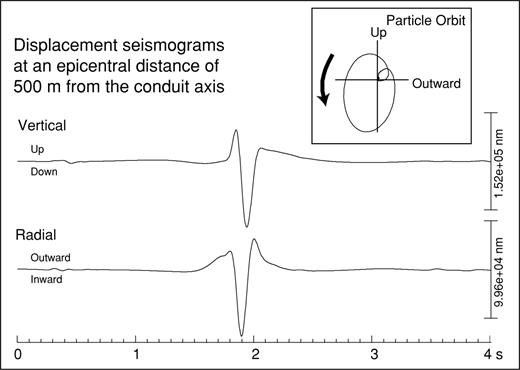
Vertical and radial displacements (in units of 10−9 m) at an epicentral distance of 500 m from the volcanic pipe in Model II. The particle orbit shows a retrograde motion typical of a Rayleigh wave. The seismograms and particle orbit are bandpass filtered from 1 to 8 Hz.
Fig. 12(b) shows the vertical velocity of the fluid at P01 (see Fig. 1). The initial velocity varies from 270 to 340 m s−1 for different lid strengths. Note, however, that these velocities are strongly dependent on the boundary condition applied at the vent, which arbitrarily sets the fluid pressure equal to the atmospheric pressure at the start of the eruption in this model. Following this initial phase, the vertical velocities of the fluid become essentially independent of the applied boundary condition, indicating that the subsequent flux of magmatic fluid from the vent is independent of the lid strength.
Discussion
Mechanism of high-pressure build-up at the conduit orifice
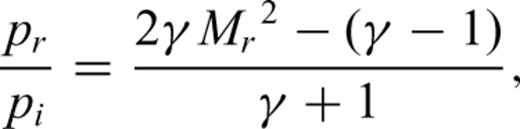
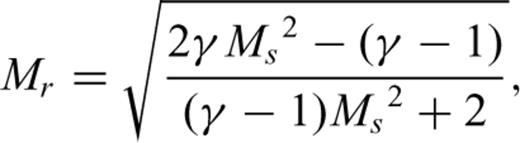
Our simulation results for Model II display an abrupt increase of pressure at the vent, where the pressurized high-velocity fluid migrating upward from the reservoir is forced to a sudden stop. These results indicate that a pressure build-up exceeding the incident wave pressure by more than twofold can be achieved at the top of the conduit. This large pressure amplification is the result of the nonlinearity of the compressible fluid dynamics. Fig. 14 provides a simplified representation of the fluid motion in the top region of the conduit. A fluid with Mach number Mi and pressure pi is propagating upward, forming a shock front with Mach number Ms propagating ahead of the fluid (Fig. 14a). The fluid reaches the lid capping the conduit where it is reflected, forming a shock wave propagating downward with a Mach number Mr (Fig. 14b). We denote as pr the pressure in the fluid behind the downgoing shock wave.
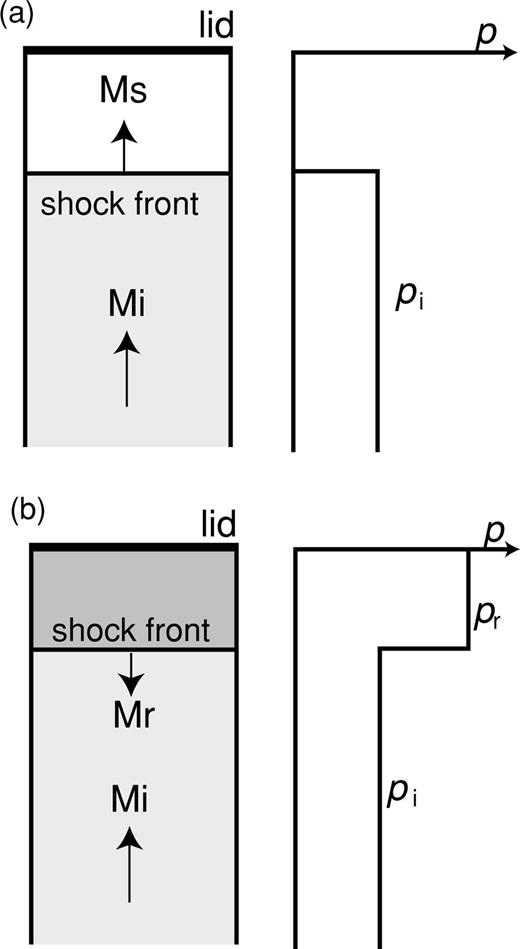
Schematic illustration of the fluid motion at the conduit orifice. The conduit orifice is sealed by a lid.
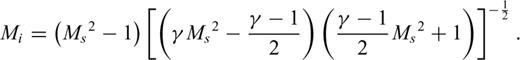
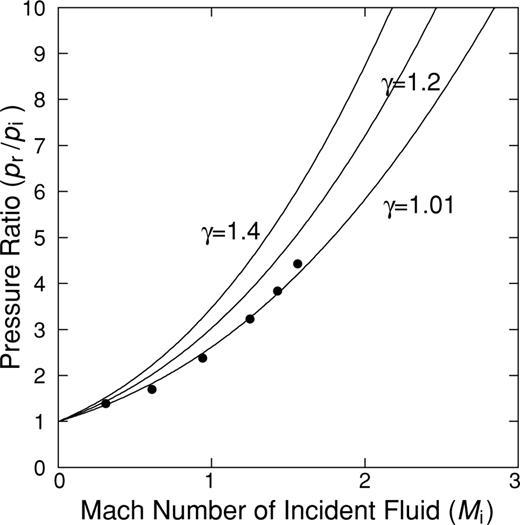
Relation between the Mach number of the incident fluid and pressure in the shock generated by reflection at the conduit orifice. The vertical scale is normalized by the pressure of the incident wave. The simulated results are shown by solid circles (see text for explanations).
The basic characteristics of the simulation results obtained with Model II are in agreement with the theoretical prediction, although significant differences are noted between model and theory. For example, the downgoing high-pressure wave in our model (see Figs 9 and 11) is small and does not display a step-like onset as in the schematic illustration in Fig. 14(b). Rather, it shows marked fluctuations of amplitude at P02 to P04. These differences originate in the triggering condition used for the eruption, and geometry of the reservoir. In our simulation the lid is removed and the pressure at the orifice of the conduit is set to gradually decrease to the atmospheric pressure over an interval of 0.12 s when the pressure exceeds the lid strength. Pressure fluctuations induced by acoustic resonance in the reservoir then affect the fluid motions in the conduit. To obtain a reflected shock wave similar to the theoretical prediction and better compare our numerical results with the theory, we simulate the fluid motion in an extended pipe (rc= 50 m, rv= 50 m, ℓc= 400 m, ℓv= 400 m) with infinite lid strength (σlid=∞). Fig. 16 shows the temporal variation of pressure beneath the conduit orifice. The initial excess pressure ΔP is 1.0 MPa. The downward propagating shock wave reflected at the lid displays a clear step-like front in agreement with the schematic illustration in Fig. 14. The large overshoot of pressure at P01 does not fit the theoretical prediction but is the result of numerical artefacts in our finite-difference scheme (see Appendix B). We further simulate the fluid motions for ΔP= 0.1, 0.2, 0.5, 1.5 and 2.0 MPa, and estimate the ratios of pr/pi and incident Mach number Mi at P02 (50 m below the lid) for each ΔP. The results are shown by solid circles in Fig. 15. The numerical results coincide with the theoretical values for γ= 1.01. Therefore, we conclude that a large build-up of pressure can occur just beneath the vent in a volcanic eruption. It is worth noting here that this pressure pulse is not detectable by geodetic measurements because of its short duration.
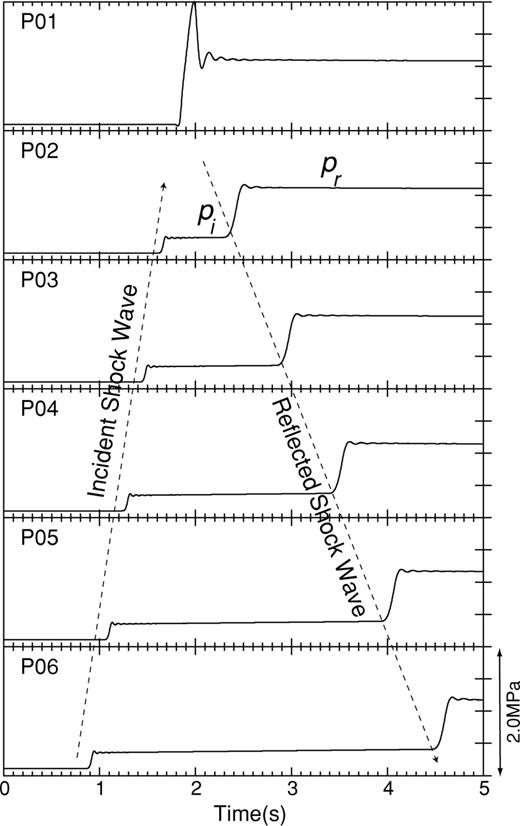
Temporal variations of p(t) at locations P01 through P06 along the conduit axis. The large overshoot of pressure at P01 is the result of numerical artefacts.
Comparison between simulations and field observations
We have examined the magma motions, crustal deformation, and seismic wave radiation associated with two models of a volcanic eruption. Many seismograms associated with various types of eruptions have been observed at different volcanoes, which allow a comparison between our simulation results and field observations.
Both Models I and II predict the LP seismic waves that are often detected in seismic measurements performed in the vicinity of erupting volcanoes. These waves become more evident in the far field. Changes in the dominant period of eruption tremor have been observed at several volcanoes (e.g. Chouet 1997; Hagerty 1997). Slight changes in the dominant period of the signal are predicted by our model, due to a slight change in the acoustic velocity of magma with depth. However, large changes in the dominant period can not be accounted for by our model. Using a more realistic constitutive relation between fluid pressure and density, in which the dynamics of the vesiculation process is fully accounted for, may improve our model.
In both Models I and II, VLP motions originate in the deflation of the reservoir—conduit system. VLP signals have been observed at Mount St Helens (Kanamori 1984), and Mount Tokachi and Mount Asama (Nishimura & Hamaguchi 1993), and have been interpreted as the result of a reaction force associated with an eruption (Kanamori 1984). Recent broad-band seismic observations have shed additional light on the spatio-temporal properties of the sources of seismic waves associated with explosions. For example, Tameguri (2002) demonstrated that the dominant signals of explosion earthquakes at Sakurajima Volcano are Rayleigh waves originating from a source located immediately beneath the vent. This Rayleigh wave source is activated about 1 s after an initial explosion occurs at a depth of a few kilometers beneath the vent. A VLP inflation preceding an eruption by a few tens of second has also been observed to accompany vulcanian explosions at Popocatepetl Volcano, Mexico (Arciniega-Ceballos 1999). The basic characteristics of Model II, which show an initial motion of the fluid and seismic wave radiation at depth prior to an eruption, and subsequent excitation of a Rayleigh wave at the vent at the eruption onset, are consistent with these observations.
Although Vulcanian-type eruptions often accompany explosion earthquakes, many eruptions are dominated by eruption tremor. For example, at Mount St Helens the first catastrophic blast at 0830 on 1980 May 18 was preceded by strong explosion earthquakes (e.g. Kanamori & Given 1983), while the eruption starting three hours later was not explosive but characterized by a sustained flux of fragmented materials causing eruption tremor. Sakurajima Volcano is famous for its Vulcanian-type eruptions, but it sometimes shows Strombolian-type eruptions accompanying BL-type earthquakes. Based on analyses of explosion and BL-type earthquakes, Iguchi (1995) suggested that the boundary conditions at the vent may control the type of eruption at Sakurajima. Explosion earthquakes (Vulcanian-type eruptions) mark the destruction of lava domes obstructing the vent, and BL-type earthquakes (Strombolian-type eruptions) occur when the conduit is filled with fluid magma and the vent is unobstructed. These observations suggest that either Model I, or Model II with a small σlid, may both represent ‘weak’ eruptions.
Other considerations
Our models should only be viewed as seminal models because of the simplifying assumptions we have used to describe a volcanic eruption. In these models, the pressure at the vent is arbitrarily set equal to the atmospheric pressure during an eruption. This assumption does not take into account the overburden pressure due to the volcanic plume, which is expected to fluctuate as the eruption proceeds. The accompanying fall-back of volcanic materials from the plume into the conduit provides an additional feedback mechanism that will induce pressure fluctuations at the vent. The flow behaviour in the atmosphere will affect the underground flow of magma and control the long-period characteristics of the observed eruption signals. To incorporate such effects in future eruption models, the flow in the atmosphere will need to be calculated simultaneously with the fluid dynamics in the conduit and reservoir, and elastodynamics in the solid. Furthermore, the configuration of the magma conduit and reservoir we have used may be too simplistic. An irregular shape for the reservoir system, in which the cross-sectional area of the conduit and reservoir are varied, may be more realistic as suggested by the complex distributions of dyke widths observed in volcanic fields. As pointed out by Wilson (1980), the conduit may be eroded by the flow of magma. Erosion may be especially important in the shallowest part of the conduit. Conduit and reservoir collapses may also occur in response to mass withdrawal from the system. As such collapses occur mostly during the late stages of eruptions, our simulation results are still useful for an understanding of the overall characteristics of an eruption, and are especially adequate to describe the process leading up to and acting during the initial phase of an eruption.
We considered an inviscid fluid under the assumption that strong vesiculation of volatile gases will significantly reduce the viscosity of the magma (e.g. Wilson 1980). Other types of magma flow, such as the slug flow discussed by Chouet (1999); Chouet (2003), and fragmentation process of magma in the conduit, are not described by eq. (3) and are not a target of our simulations. Although our calculations are strictly limited to the simplified aspects of an eruption, we believe that the overall characteristics of magma motions in the shallow reservoir, and seismic wave radiation excited by the eruption are well reproduced.
Conclusions
We have used the finite difference method to calculate the magma motions, seismic radiation, and crustal deformation associated with a volcanic eruption. Our main results are summarized as follows.
Magma pressure gradually decreases with time as the magma migrates upward in response to the pressure difference between the magma reservoir and atmosphere. LP oscillations of the magma reservoir and conduit are excited by acoustic resonance of the conduit—reservoir system during the eruption. The dominant period of oscillation depends both on the size of the conduit—reservoir system and magma properties. These VLP and LP oscillations are detected in the displacement field measured at the free surface.
The magmatic fluid is highly pressurized just beneath the vent when the fluid abruptly migrates upward and is instantaneously stopped by a lid blocking the conduit orifice. This build-up of pressure is detected as a single pulse-like Rayleigh wave in the seismograms, a feature similar to those observed in actual seismograms of explosion earthquakes.
The material strength of the lid at the conduit orifice plays an important role in the generation of seismic waves. A strong lid leads to a large-amplitude single-pulse explosion earthquake. A weak lid leads to seismograms dominated by LP oscillations and gradually changing crustal deformations.
Acknowledgments
We are indebted to Phil Dawson and Javier Almendros for critical reviews. Careful and thoughtful reviews by Takao Ohminato and Masato Iguchi were very helpful for improving the manuscript. This study was motivated when T.N. visited the USGS with a support of a Grant for Scientific Research and the Programme for the Overseas Researcher of MEXT, Japan, and is partially supported by ACT-JST and a Grant for Scientific Research from MEXT (No.14080202).
References
Appendix
Appendix A: Explicit Forms of the Finite Difference Equations in the Fluid and Solid

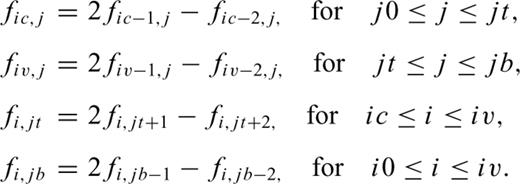
 , and
, and  into eqs (1) and (2) and replacing the spatial derivatives with backward differences, we obtain the corrector steps:

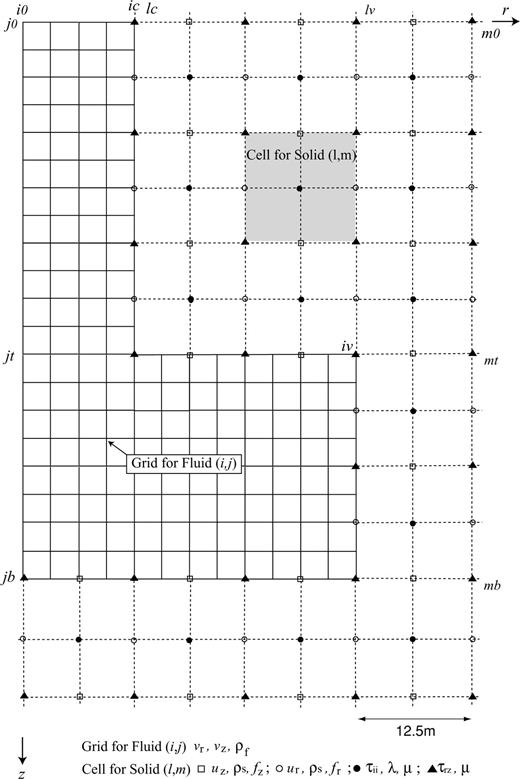
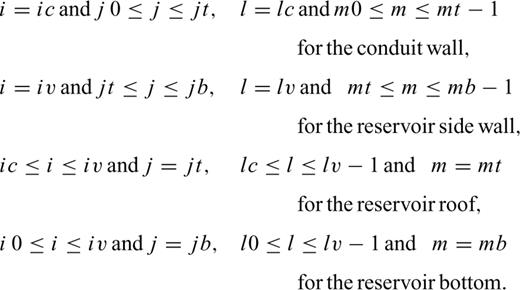
Grid architectures of the fluid and solid used in our finite-difference simulations.

Appendix
Appendix B: Fluid Motion at the Conduit Orifice
As indicated in eq. (A8), the pressure at the conduit orifice is extrapolated from the pressure at the nearby two gridpoints in our finite-difference scheme. This extrapolation algorithm works well especially when the fluctuations of pressure between nearby gridpoints are small. However, unrealistic waves may be produced when an abrupt change of pressure occurs at the conduit orifice. In Model II, the shock with step-like onset impinging the lid induces artificial ripples near the wave front of the reflected shock. Fig. B1 shows plots of the fluid pressure at grid nodes along the conduit wall close to the lid in an extended pipe (rc= 50 m, rv= 50 m, ℓc= 400 m, ℓv= 400 m) with ΔP= 1 MPa. We observe ripples with a peak amplitude exceeding the mean amplitude of the reflected shock wave by about 70 per cent at the lid. In this case, therefore, the strength of the lid is overestimated by about 70 per cent in absolute value. The peak amplitude of such ripples decreases to 20 per cent of the mean amplitude of the reflected shock wave for the case of ΔP= 0.1 MPa. These ripples lead to an error in our estimation of the pressure condition leading to the removal of the lid and start of the eruption in Model II, but do not affect the solid motions because the ripple amplitudes decrease rapidly with increasing distance from the lid. For example, the peak ripple amplitude exceeds the mean amplitude of the reflected shock by 20 per cent at a depth of 6.25 m in Fig. B1. The stress σrr in the solid near the conduit orifice is coupled with the fluid pressure p at grids located 6.25 m and 18.75 m from the lid. Ripples are relatively weak at these locations and their effect in the elastodynamics is trivial. The ripples can also be reduced via the expedient of using a smaller grid interval δdf, however, at the expense of more extensive computations.
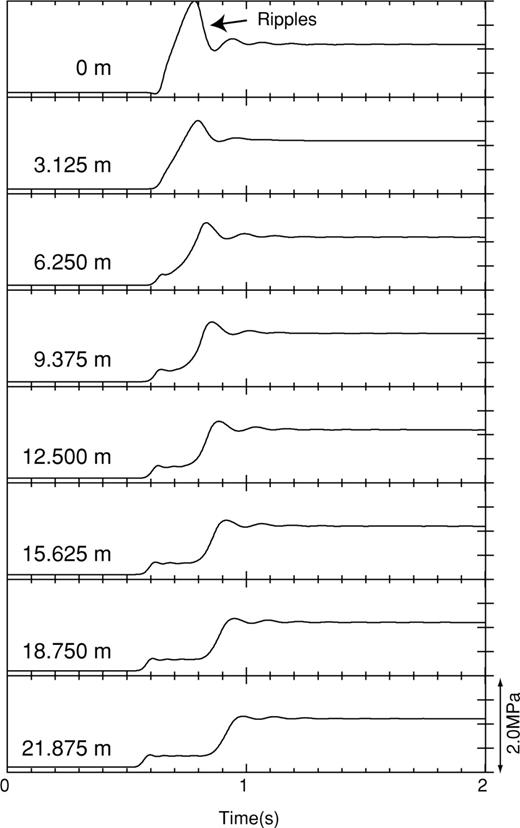
Temporal variation of p(t) at grid nodes along the conduit wall close to the conduit orifice. The vertical distances from the orifice are indicated at the left of each trace.
