


Summary
The Solomon Islands arc area is a complex plate convergence zone. At the North Solomon Trench on the northern side of the arc, it is believed that the Pacific Plate was subducting before coming into collision with the Ontong Java Plateau, the world's largest oceanic plateau. After the collision about 5 Ma, northeastward subduction initiated along the southern side of the arc at the San Cristobal Trench, another trench on the south side. GPS observations and crustal seismic structure surveys confirm that convergence occurs at both trenches. Without detailed and accurate seismicity, it is difficult to characterize the plate subduction to reveal the tectonics of such a complex zone where a key mechanism of continental growth may also exist. In 1994, an ocean-bottom seismometer (OBS) experiment was carried out for the first time in the area around the Solomon Islands arc to locate microearthquakes. Observations started in late August and continued until early September. Five digital recording OBSs were deployed around the Russell Islands west of Guadalcanal Island. OBS spacing was about 20 km. All the OBSs were recovered and yielded data with a good signal-to-noise ratio. 40 earthquakes, with magnitudes in the range 1.5–4.4 were located over 8 days. The seismicity clearly images the two subducting plates. Though the seismicity beneath the arc side slope of the San Cristobal Trench is relatively high, we can see the seismicity which is related to the subducting Pacific Plate beneath Santa Isabel Island. In addition, earthquakes occur within the crust beneath the southern part of the New Georgia Basin and the Russell Islands. An aseismic area extending 40 km inward from the San Cristobal trench axis implies initial aseismic slip of the India—Australia Plate at a small dip angle.
1 Introduction
The Solomon Islands arc is formed by a linear double chain of islands (Fig. 1). The arc-trench system is a complex plate convergence zone (Coleman 1966; Cooper & Taylor 1985). On the northern side is the North Solomon Trench beneath which the Pacific Plate is being consumed. The tectonic significance and the fate of the buoyant Ontong Java Plateau, the largest of large igneous provinces (LIPs), colliding into the Solomon Islands arc are still not fully understood. However, recent geological and geophysical studies have given a better understanding for the tectonics of the Ontong Java Plateau and the Solomon Islands arc. For example, Phinney (1999) showed close similarity between the accreted Malaita accretionary prism and the incoming plateau. The crustal structure beneath the Malaita accretionary prism is also similar to that of the Ontong Java Plateau (Miura 1998; Miura 2003). On the southern side of the arc, the San Cristobal Trench, beneath which the India—Australia Plate and the Solomon Sea Plate are subducting under the Solomon Islands arc. However, the San Cristobal Trench becomes less conspicuous west of the Gaudalcanal Island.
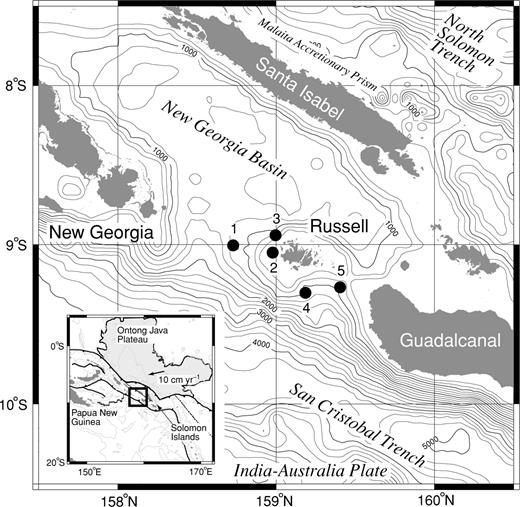
Map of the major bathymetric features in the vicinity of the Solomon Islands region, showing the positions of OBSs. Contour interval is 250 m. Solid circles and numerals denote the positions of OBS and the OBS number, respectively. Outline of the Ontong Java Plateau and major plate boundaries are shown in the inset. The plate vector in the inset was calculated from NUVEL-1A (DeMets 1994) using a fixed India—Australia Plate.
A plate subduction zone is usually best defined by seismological data, especially by determination of hypocentres that define a dipping planar feature. Cooper & Taylor (1985) revealed the seismological characteristics around the Solomon Islands using the International Seismological Centre (ISC) data. Seismic activity is clustered around Bougainville Island and San Cristobal Island. In these regions, a seismic zone dipping northeast to a depth of more than 200 km is related to the subduction of the Solomon Sea Plate and the India—Australia Plate. However, the region between the New Georgia Islands and Guadalcanal Island has low seismicity, and no dipping planar feature is defined beneath the San Cristobal Trench by the ISC data. On the other hand, a seismic zone dipping southwest in depths between 50 and 200 km beneath New Georgia Basin is interpreted as being associated with the subducting Pacific Plate (Cooper & Taylor 1985). Though the seismicity based on data from a worldwide network is useful to give us an awareness of the general tectonics, it is nearly impossible to reveal the detailed seismicity of a complex area. And it also cannot define these features well in a tectonically complex area such as the Solomon Islands arc area (Cooper & Taylor 1985; Cooper 1986b). Furthermore, the ISC data do not include earthquakes with magnitudes of less than 3.5.
To reveal the microseismicity of the area, in 1994 we carried out the ever first seismic experiment using an OBS array in the area around the Solomon Islands. The main purpose of this observation is to estimate an accurate distribution of hypocentres, especially the seismicity associated with the subduction at the San Cristobal Trench at approximately 159°E, and in the area between the San Cristobal Trench and the North Solomon Trench. The precise hypocentral distribution is useful to identify the overall slab structure where it cannot resolve details needed for a tectonic interpretation such as the dip of the slab and slab thickness.
2 Observation
Five OBSs were deployed around the Russell Islands (Fig. 1). The average spacing between the OBSs was about 20 km. In the investigated area, the San Cristobal Trench broadens, and the hypocentre distribution determined by ISC does not show a clear plane feature. The OBSs were deployed and recovered using a chartered diver's boat and the deployment locations were determined using the Global Positioning System (GPS). The errors of the OBS positions are estimated to be less than 0.2 km due to the shallow depths. We also determined the water depth of the OBS sites as the minimum distance between the ship and an OBS measured by the acoustic transponder system during the recovery. The water depths of the OBS sites range from 579 to 1184 m. Geographical coordinates and water depths of OBSs are listed in Table 1. All the OBSs were recovered after the observation. OBSs were deployed on 1994 August 28 and 29 and the recovery was carried out from September 5 to 7. The period of the observation for all five OBSs was 8 days.
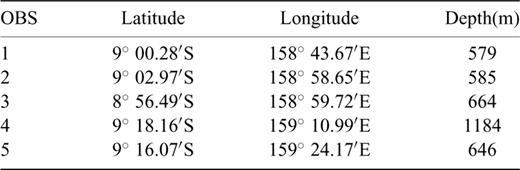
OBS coordinates (WGS84) and water depths.
We used a digital recording type OBS (Shinohara 1993). Each OBS is equipped with both vertical and horizontal velocity sensitive electromagnetic geophones with a natural frequency of 4.5 Hz. Seismic signals from the geophones were digitally recorded continuously with 16-bit resolution. Accurate timing, estimated to be within 0.05 s, is provided by a crystal oscillator.
3 Data and Hypocentre Determination
First, we plotted all vertical seismometer data for the whole observation period to detect events. Then, we selected events from the plotting by a manual method. Seismic activity in the surveyed area was stable during the experiment without a remarkable change of the number of detected events in time. Events detected by all five OBSs were selected for hypocentre determinations (Fig. 2). P- and S-wave arrival times were picked on a computer display (Urabe & Tsukada 1991). Time differences between P- and S-wave arrival (S−P times) at each OBS are distributed from 2 to 20 s. A broad distribution of S−P times indicates a wide region of seismic activity. However, a relatively large number of events that have S−P times from about 3 s to about 10 s suggests that there were many hypocentres near the OBS network.
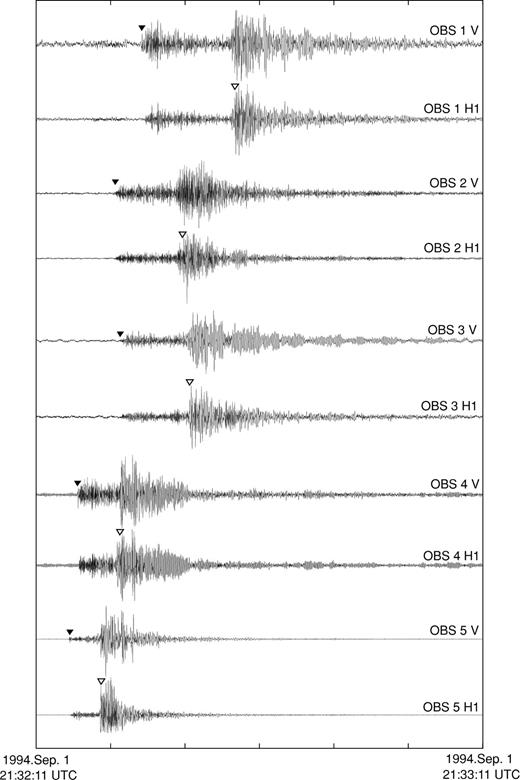
Example of OBS seismograms of an earthquake. The vertical component and one component of the two horizontal sensors for each OBS are shown. The origin time of the event is 21:32:10.5 UTC on 1994 September 1 and the estimated coordinate of the hypocentre is 9° 25.7′S, 159° 25.8′E. The depth and magnitude of the event are 23.8 km and 2.5, respectively. Each trace is normalized to its maximum amplitude. OBS number and component are labelled above each trace. Solid inverted triangles and open inverted triangles indicate P- and S-wave arrivals, respectively.
In 1995, extensive seismic experiments were carried out in the study area using MCS and OBSs to obtain a detailed seismic structure (Mann 1996; Miura 1998; Phinney 1999; Miura 2003). However, the deep velocity structure under the arc area is still ambiguous due to its complex structure. Cooper (1986a) also determined the shallow P-wave velocity structure in the studied area from a refraction survey using sonobuoys. Cooper (1986b) showed two transects of the arc using sonobuoy data and gravity data. Miura (1998) and Miura (2003) presented a detailed transect of the arc using OBS data. Although the area has a large lateral heterogenity in the seismic structure caused by the complexity of the tectonics, a simple 1-D velocity structure for the hypocentre location was modelled by introducing the results of refraction studies (Cooper 1986a,b; Miura 1998; Miura 2003). P-wave velocities from 2.3 to 4.0 km s−1 define the first crustal layer, with P-wave velocities from 6 to 6.8 km s−1 in the second layer in the crust. The thicknesses of the first crustal layer and the second layer are 2 and 28 km, respectively. The total crustal thickness is 30 km and the underlying Pn velocity is 8.0 km s−1. We also assumed that the ratio of P- to S-wave velocity in the crust and mantle is 1.73, because S-wave structure in the deep region is not available. Since the thickness of sedimentary layers changes at each OBS site, the estimated traveltimes by the location program must be corrected. The correction for the local variation of the sedimentary structure beneath each OBS was made by calculation from the time difference between P-wave arrival and PS converted wave arrival assuming the Vp/Vs ratio of the sedimentary layer.
Hypocentres were determined by a maximum-likelihood estimation technique of Hirata & Matsu'ura (1987). As a result of the uncertainty of the thickness of the sedimentary layer and the seismic velocity in the sedimentary layer, we used the following method. First, we located the hypocentre using P- and S-wave arrival times and the calculated correction value for the sedimentary layer. Averaged differences between the observed traveltime and the estimated traveltimes (O-C times) for each OBS were calculated. The averaged O-C times are added to the previous correction values, and the hypocentres were relocated. We repeated this procedure three times. After this procedure, the averaged O-C times become less than 0.1 s. Magnitudes of the events were estimated using the signal duration (F-P time).
4 Results
The OBS network located 40 earthquakes with magnitudes ranging from 1.5 to 4.4 (Fig. 3). The OBS array could uniformly determine events with magnitudes of greater than 2.0 (Fig. 4). The seismicity in the study area is generally uniform in time. To evaluate each location, we calculated error ellipses from the total covariance matrix of the location program (Hirata & Matsu'ura 1987) (Fig. 5). Although our OBS network is small in comparison with the area where the hypocentres are determined, the errors of location of hypocentre are sufficiently small.
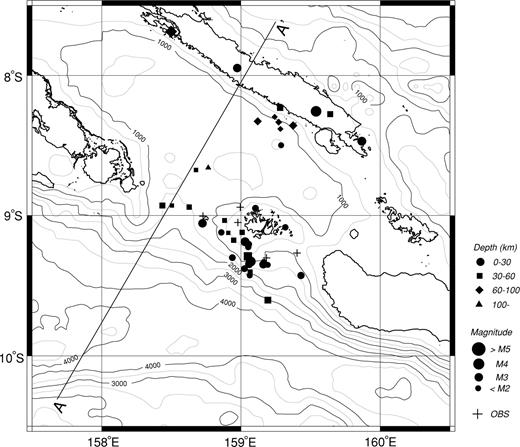
Epicentres located by the 1994 OBS experiment with bathymetry. The contour interval is 500 m. The positions of OBSs are shown by crosses. Shape and size of symbols indicate depth and magnitude of the events, respectively. A cross-section of Fig. 5 runs through A and A′.
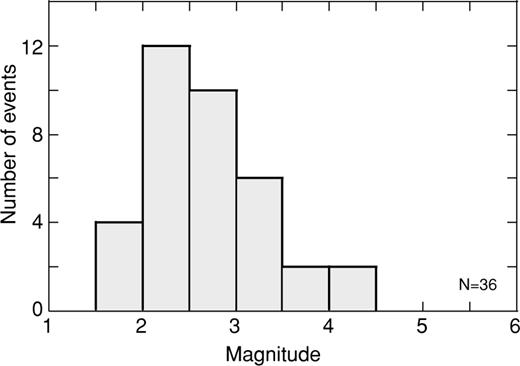
Histogram of the located events with respect to magnitude. Magnitude of the events is estimated using the signal duration and magnitudes of 36 events could be determined. The OBS network is estimated to be able to locate events with magnitude greater than 2.
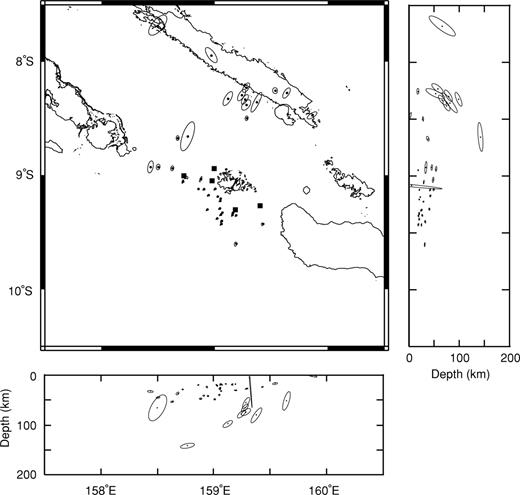
The distribution of located earthquakes with error ellipses. Vertical sections along latitude (right) and longitude (lower) are also shown. Positions of OBS are denoted by solid squares.
Seismic events beneath the slope on the island arc side in the San Cristobal Trench are relatively frequent, but there is no seismic activity beneath the area within the trench where the water depth is greater than about 3000 m. No hypocentres were detected in the central region beneath the Guadalcanal Island and the New Georgia Islands. Deep seismic activity is also seen to the north, beneath the Santa Isabel Island and the New Georgia Basin. There are several shallow earthquakes beneath the southern part of the New Georgia Basin and the Russell Islands. Beneath the slope on the island arc side of the San Cristobal trench, seismic activity is limited to depths of between 0 and 60 km with hypocentral depths increasing with distance from the trench. Below the Santa Isabel Island and the New Georgia Basin, foci are deeper than those beneath the slope of the San Cristobal Trench side.
5 Discussion
In a cross-section of the hypocentral distribution projected on a vertical plane perpendicular to the strike of the island arc (Fig. 6), we can clearly see two dipping planes. Although we could locate only 40 earthquakes during the observation period, the OBS observations are consistent with those from the ISC. Compared with the ISC data, our result has higher spatial resolution and this enables us to more clearly interpret the tectonics in the study area. The southern plane starts from about 40 km inward of the San Cristobal trench at depths of 15 km, and continues downward to the north with the deepest recorded event at a depth of 60 km. The southern plane is considered to define the upper boundary of the subducting India—Australia Plate. The northern dipping plane starts just below the Santa Isabel Island at a depth of 50 km, and dips to the south. The seismic activity is lower than that in the southern plane, but the deepest recorded event is at a depth of 150 km. The northern plane is interpreted to be the upper boundary of the subducting Pacific Plate.
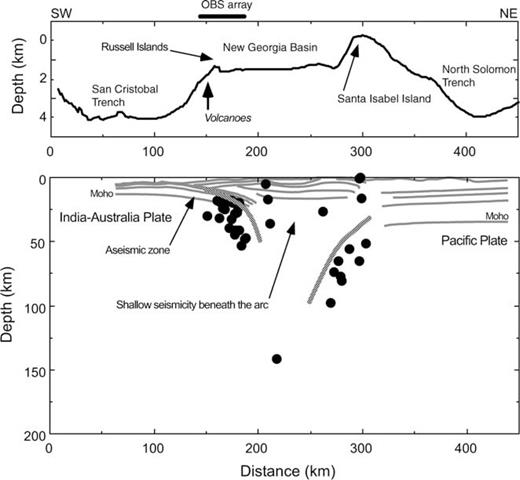
Vertical section of topography (upper) and microseismicity (lower) along a profile denoted by A and A′ in Fig. 1. The projected vertical plane is perpendicular to the strike of the island arc. Solid circles indicate the hypocentres. Horizontal axis is distance from the southern end of the projected line. The P-wave velocity interfaces from the seismic structure across the Solomon Islands arc (Miura 1998; Miura et al. submitted) are also shown by grey curves. Two dipping planes which are considered to be associated with the subduction can be clearly seen (thick grey curves).
The polarity reversal of subduction in the Solomon Island arc has been proposed using geological and geophysical data (e.g. Kroenke 1972; Cooper & Taylor 1985). The subduction of the Pacific Plate in the North Solomon trench at present is interpreted to be inactive, because the subduction of the San Cristobal trench was initiated after the collision of the Ontong Java Plateau with the Solomon Islands arc. However, recent seismic survey showed that the crustal structure beneath the Malaita accretionary prism is similar to that of the Ontong Java Plateau (Miura 1998; Miura 2003). From the seismic velocity structure, they presented that the Malaita accretionary prism consists of the material of the uppermost Ontong Java Plateau and the lower part of the Ontong Java Plateau continues to subduct. GPS data show convergence at the San Cristobal trench with the Guadalcanal Island moving largely as part of the Pacific Plate (Tregoning et al. 1998). However, a significant relative motion between the Guadalcanal Island and the Pacific Plate was estimated. They concluded that there is convergence between the Solomon Island arc and the Pacific Plate. Our results image the boundaries of the two subducting plates clearly. This result is consistent with a seismic structure survey using OBSs and airguns (Miura 1998; Miura 2003) and GPS observations (Tregoning et al. 1998). In addition, Petterson (1997) showed that convergence between the Solomon Island arc and the Pacific Plate is currently occurring from faulting and deformation of sediments on the Malaita Island. Consequently, there is evidence for subduction of the Pacific Plate beneath the Solomon Islands. Our results are consistent to the subductions of both side of the Solomon Island arc.
We could locate the shallow earthquakes for which the depth is less than 30 km beneath the southern part of the New Georgia Basin, the Santa Isabel Island and the Russell Islands because of high sensitivity of the OBS network. Beneath active island arc regions such as the Japan island arc, the earthquakes usually occur in the upper crust. The events in the upper crust of an active arc are thought to be caused by activity of an arc such as volcanic activity or deformation of the crust. Three shallow microearthquakes occurred beneath the Santa Isabel Island (Fig. 3). The epicentres of these events are close to the position of the major fault system (the Kia—Korigole—Kaipito fault system). The seismic activity of the major fault system around the Santa Isabel Island is comparable to convergence of the Solomon Islands arc and the Pacific Plate. Tregoning et al. (1998) presented a global seismic network determined thrust and normal shallow earthquakes along and north of the Kia—Korigole—Kaipito fault system, which may be related to subduction of the Pacific Plate.
Although OBS data show a clear north-dipping plane in San Cristobal, an aseismic area extending 40 km inward from the San Cristbal trench axis implies initial aseismic slip at a small dip angle. Aseismic areas are also found close to the Japan trench and the Nankai trough (Hirata 1985; Obana 2001). Only a few earthquakes occurring beneath the New Georgia Basin are quoted in the ISC catalogue. The OBS network can locate earthquakes with magnitudes below 2.0, if the depth of the event is shallow. Because our OBS array can detect smaller events than the ISC network, the seismicity in the shallow region beneath the New Georgia Basin can be determined. No earthquake is determined beneath Guadalcanal Island and the New Georgia Islands from our observation.
There are five events which we could not locate. To estimate epicentral locations of those events, we calculate azimuths of the approaching wave from the events. For the measurement of the azimuth, we use the P-wave arrival times of three OBSs (nos 2, 4, 5). We found that there is no earthquake for which the waves approach from the directions of Guadalcanal Island and the New Georgia Islands. On the other hand, many earthquakes were located beneath Guadalcanal Island and the New Georgia Islands by the ISC. There are two possibilities to explain this inconsistency. The observation span of the ISC data covers more than 20 years, however, our observation time is only 8 days. There may have been no seismicity beneath Guadalcanal Island and the New Georgia Islands over our observation period. The low seismicity beneath the New Georgia Islands is interpreted as being related to subduction of the warm lithosphere of the Woodlark spreading ridge (Cooper & Taylor 1985; Mann 1998). Another explanation of the low seismicity is that the area is locked at the trench related to the attempted subduction of buoyant seamount features on the extinct Woodlark spreading ridge. The Guadalcanal Island region may be in a similar collisional setting with the entry of the Louisiade Plateau into the San Cristobal trench. (Mann 1998). The second possibility is that our OBS network cannot observe seismic waves from the direction of the Guadalcanal Island and the New Georgia Islands due to a low-Q region or a complex structure. At this stage, we cannot discriminate the two hypotheses from our observation.
6 Conclusions
To investigate the seismicity in the Solomon Islands arc area, five OBSs were deployed near the Russell Islands and 40 earthquakes were located during approximately 1 week. The earthquakes were evenly distributed in time and magnitudes ranged from 1.5 to 4.4. In a vertical cross-section of the hypocentral distribution, two subducting plates are clearly imaged. The seismicity is higher on the southern subduction zone on the arc side of the San Cristobal Trench. A significant number of earthquakes occurring beneath the southern part of the Santa Isabel Island defines the northern subduction zone. An aseismic zone extending 40 km inward of the San Cristobal trench axis implies that subduction of the India—Australia Plate is initially aseismic at a very small dip angle. An activity of the Solomon Islands arc is inferred from earthquakes with small magnitudes in the crust beneath the southern part of the New Georgia Basin and the Russell Islands.
Acknowledgments
We express thanks to Dr B. McGrail, Messrs A. Keikere and L. Tivuru, Ministry of Energy, Water and Mineral, Solomon Islands, for helps in the OBS observation. The work of the officers and crew of M/V Solomon Islands is appreciated. Discussions with Drs A. Taira, S. Miura and Y. Aoyagi are helpful for the data processing and the interpretation. We also thank Dr D. M. Chirstie for a critical reading of the manuscript. Comments by Drs P. Mann and M. Recq helped us to improve the manuscript. Many of the figures were created using GMT (Wessel & Smith 1991).
References
